Market Overview
| Study Period | 2021 - 2031 |
|---|---|
| Forecast Data Period | 2026 - 2031 |
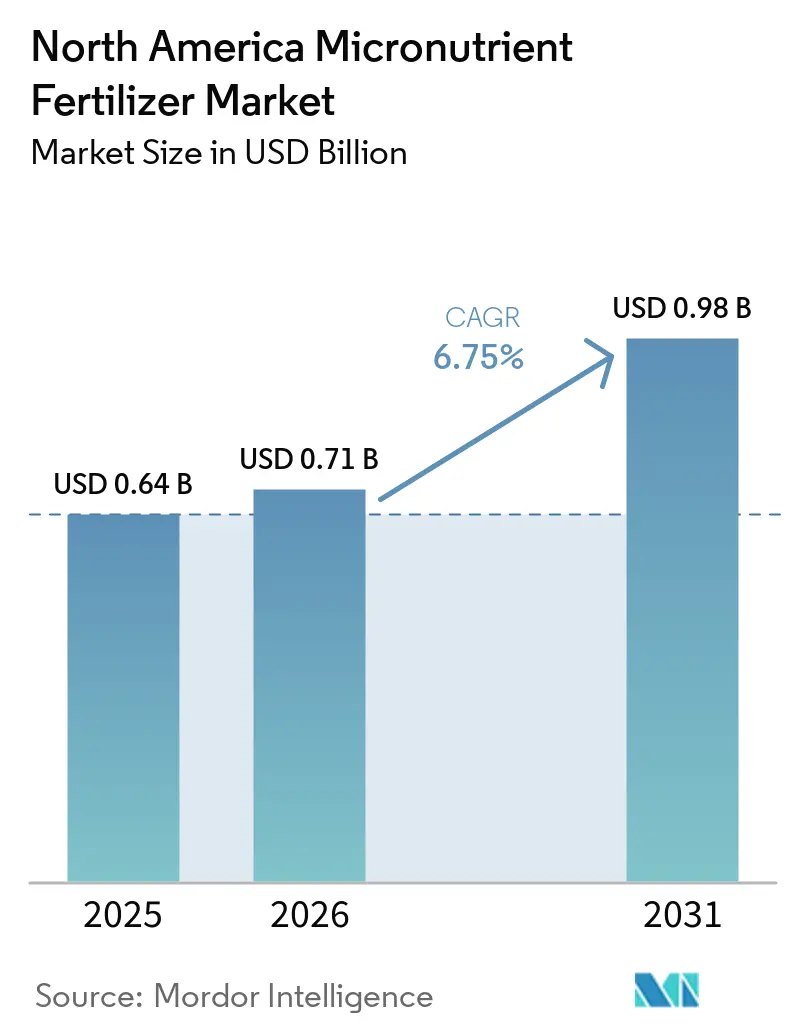
| Base Year Market Size (2025) | USD 0.64 Billion |
| Market Size (2026) | USD 0.71 Billion |
| Market Size (2031) | USD 0.98 Billion |
| Growth Rate (2026 - 2031) | 6.75% CAGR |
| Market Concentration | Medium |
Major Players*Disclaimer: Major Players sorted in no particular order Image © Mordor Intelligence. Reuse requires attribution under CC BY 4.0. | |
North America Micronutrient Fertilizer Market Analysis by Mordor Intelligence
The North America micronutrient fertilizer market size is projected to grow from USD 0.64 billion in 2025 to USD 0.71 billion in 2026 and is forecast to reach USD 0.98 billion by 2031 at 7.16% CAGR over 2026-2031. Uptake accelerates as soil-test data confirm that 35% of regional soils now show zinc and boron deficiencies, a pattern that directly limits yield potential [1]Source: USDA Natural Resources Conservation Service, “Soil Health and Micronutrient Management,” USDA.gov . Precision agriculture tools, genetically modified crop traits with elevated micronutrient demand, and cost-share programs that offset application expenses collectively keep demand on an upward path. Consolidation among agricultural retailers improves product access in rural areas and supports advisory services that translate diagnostics into prescriptions. Meanwhile, chelated liquid innovations target indoor farms and vertical agriculture, where controlled environments need highly bioavailable nutrient forms. Together, these factors anchor medium-term growth while opening niches for specialized suppliers that can navigate evolving regulations on heavy-metal thresholds.
Key Report Takeaways
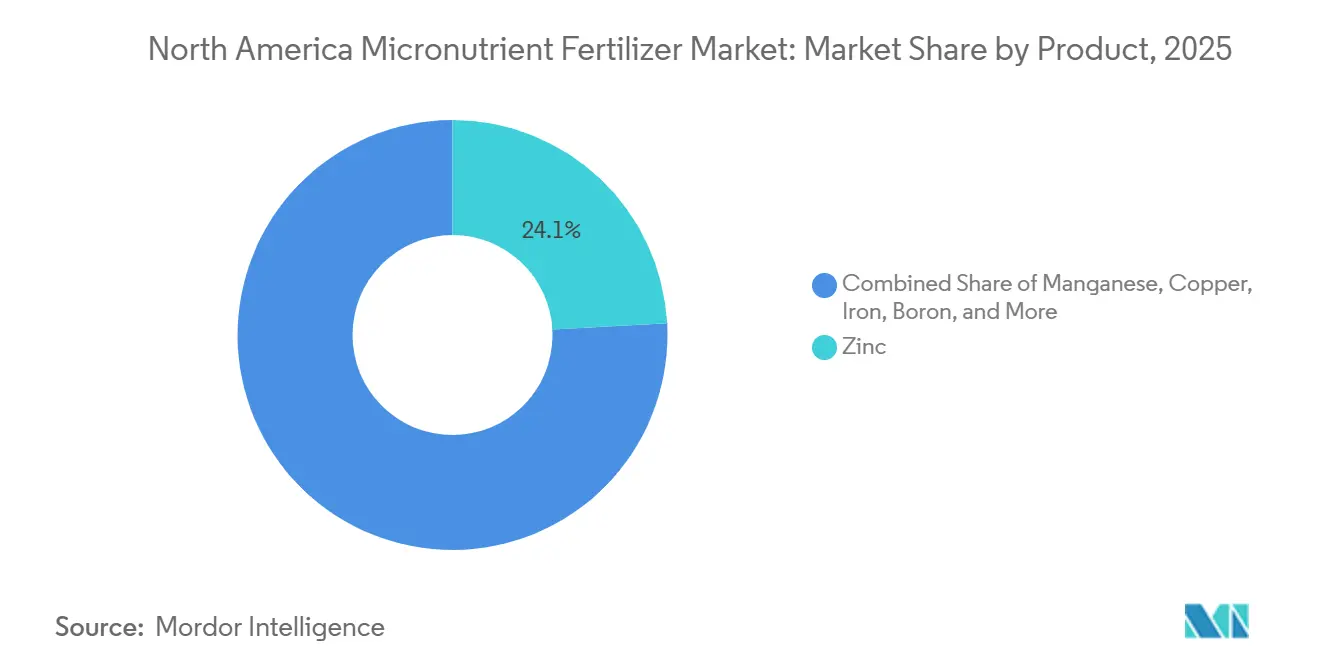
- By product, zinc led with a 24.1% share of the North America micronutrient fertilizer market in 2025, while boron is projected to advance at a 7.3% CAGR through 2031.
- By form, conventional formulations accounted for 78.0% of North America micronutrient fertilizer market share in 2025, while specialty formulations are set to grow the fastest at a 6.6% CAGR during the same period.
- By specialty type, water-soluble solutions captured 51.6% of segment sales in 2025 and are forecast to post the highest 6.7% CAGR to 2031.
- By application mode, soil application held 77.9% of the North America micronutrient fertilizer market size in 2025, whereas fertigation is projected to expand at a 6.6% CAGR through 2031.
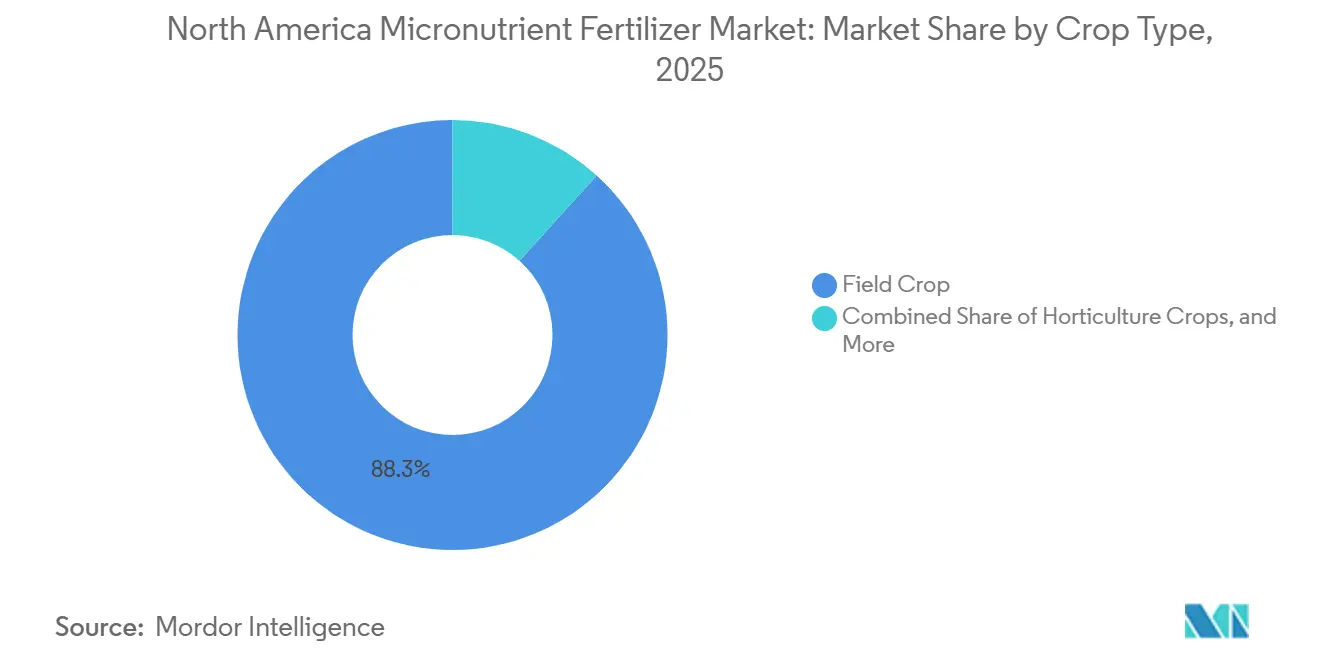
- By crop type, field crops represented 88.3% of demand in 2025, while horticultural crops are on course for the quickest rise at a 7.4% CAGR between 2026 and 2031.
- By geography, the United States held 54.1% of the market in 2025, whereas Mexico is projected to expand at a 6.6% CAGR through 2031.
Note: Market size and forecast figures in this report are generated using Mordor Intelligence’s proprietary estimation framework, updated with the latest available data and insights as of 2026.
North America Micronutrient Fertilizer Market Trends and Insights
Drivers Impact Analysis*
| Driver | (~) % Impact on CAGR Forecast | Geographic Relevance | Impact Timeline |
|---|---|---|---|
| Rising soil micronutrient deficiencies verified by soil-test results | +1.8% | Core North America, strongest in the Midwest and the Great Plains | Medium term (2–4 years) |
| Expansion of GM-crop acreage with higher micronutrient requirements | +1.5% | United States and Canada | Long term (≥ 4 years) |
| Government subsidies for precision micronutrient application | +1.2% | United States EQIP and Canadian provincial programs | Short term (≤ 2 years) |
| Integrated retailer distribution networks improving accessibility | +0.9% | Rural North America | Medium term (2–4 years) |
| Adoption of chelated liquids in indoor and vertical farms | +0.7% | Urban controlled-environment hubs | Long term (≥ 4 years) |
| E-waste-derived boron lowers input costs | +0.3% | Electronics-recycling regions | Long term (≥ 4 years) |
| Source: Mordor Intelligence | |||
Rising Soil Micronutrient Deficiencies Verified by Soil-Test Results
Laboratory reports show zinc deficiency in 35% of tested soils during 2024, up from 28% four years earlier. Yield losses of 15-20% in deficient corn fields highlight the economic hit. High-pH prairie soils worsen the issue because alkaline conditions lock micronutrients in unavailable forms. Similar trends surface for boron on sandy or high-rainfall sites, where leaching intensifies losses. Growers now integrate site-specific prescriptions into seeding and fertilization runs, making micronutrient application a core element rather than a rescue measure. This data-driven shift hastens movement away from blanket NPK blends toward targeted formulas that close observable gaps.
Expansion of GM-Crop Acreage with Higher Micronutrient Requirements
Ninety-four percent of U.S. corn and 96% of soybean acreage used GM traits in 2024[2]Source: American Society of Agronomy, “Genetically Modified Crops and Micronutrient Requirements,” agronomy.org. Newer hybrids with enhanced protein need roughly 25% more zinc and manganese, while herbicide-tolerant soybeans pull more copper and iron to maintain photosynthesis under chemical stress. Seed firms now bundle genetics with nutrient recommendations, creating bundled demand that rides every wave of trait adoption. Field trials also reveal that deeper roots from biotech lines access subsoil stores better, but only when the profile holds enough available micronutrients, setting the stage for supplemental programs that release full genetic potential.
Government Subsidies for Precision Micronutrient Application
USDA EQIP raised reimbursement for micronutrient application to 50% in 2024, complementing state initiatives in Iowa, Illinois, and Nebraska. Canadian provinces follow suit via the Canadian Agricultural Partnership, particularly for horticulture[3]Source: California Environmental Protection Agency, “Fertilizer Heavy Metal Content Regulations,” calepa.ca.gov. Enrollment rose to 40% of eligible farms in 2024 from 22% two years earlier. The subsidy cuts payback periods for precision fertigation rigs and lab diagnostics, converting hesitant growers into early adopters. Environmental framing also helps, as regulators view targeted micronutrient use as a route to lower overall fertilizer loads.
Integrated Retailer Distribution Networks Improving Accessibility
Regional dealers merging into national platforms unlock 8-12% cost savings on specialty inputs thanks to bulk purchasing. Centralized hubs invest in temperature-controlled storage that prevents chelate degradation, ensuring consistent quality upon delivery. Expanded soil-testing labs within these networks feed recommendations directly into grower portals, closing the loop from diagnosis to delivery. Variable-rate maps uploaded to in-cab monitors shorten the decision cycle and push uptake even among risk-averse producers.
Restraints Impact Analysis*
| Restraint | (~) % Impact on CAGR Forecast | Geographic Relevance | Impact Timeline |
|---|---|---|---|
| Higher per-acre cost versus bulk NPK blends | −1.4% | Commodity-crop regions | Short term (≤ 2 years) |
| Regulatory uncertainty on heavy-metal limits in formulations | −0.8% | United States state variations and cross-border trade | Medium term (2–4 years) |
| Molybdenum ore supply diverted to battery sector | −0.6% | Global supply chain | Long term (≥ 4 years) |
| Advisor knowledge gap on nutrient stacking effects | −0.4% | Smaller advisory services | Medium term (2–4 years) |
| Source: Mordor Intelligence | |||
Higher Per-Acre Cost Versus Bulk NPK Blends
Micronutrient programs cost USD 35-45 per acre against USD 8-12 for standard NPK, a 300-400% premium that narrows margins when commodity prices soften. Tenants on annual leases hesitate to invest in soil health that outlives their contracts. Some insurers now offer coverage tied to documented deficiencies, nudging uptake, but widespread relief likely hinges on lower-cost sources such as recycled boron or bundling incentives from seed and input suppliers.
Regulatory Uncertainty on Heavy-Metal Limits in Formulations
States like California enforce Proposition 65 limits that surpass federal baselines, forcing batch-specific labeling and formulation tweaks. Companies juggling multiple rule sets face higher testing costs and product segmentation that erode scale efficiencies. Cross-border trade into Canada and Mexico adds another compliance layer. Industry groups lobby for harmonized standards, yet near-term clarity remains elusive, delaying some product launches and inventory planning.
*Our forecasts treat driver/restraint impacts as directional, not additive. The impact forecasts reflect baseline growth, mix effects, and variable interactions.
Segment Analysis
By Product: Zinc Leads as Boron Accelerates
Zinc retained the largest share of the North America micronutrient fertilizer market in 2025, with 24.1%, because alkaline soils with a pH above 7.5 limit natural zinc availability. Deficiency signs, stunted growth, and interveinal chlorosis are easy for growers to spot, so zinc is often the first micronutrient added to standard blends. Copper followed at a significant share, largely because specialty and organic producers value its dual nutrition and fungicidal traits. Molybdenum ranked close behind, reflecting its role in nitrogen fixation for legume crops even as battery makers tighten global supply lines. Iron is secured by targeting high-pH soils that lock up native iron, while manganese focuses on soybeans grown in no-till fields rich in organic matter.
Boron showed the fastest momentum with a 7.3% CAGR through 2031 as fruit and vegetable acreage expands and buyers demand uniform fruit set. Emerging elements such as nickel and silicon are in the “Others” bucket and are growing in importance as research highlights their value in intensive systems. Innovation centers on chelation chemistries and dust-free granules that raise bioavailability and allow lower application rates. These improvements ease cost pressure in broad-acre programs while helping high-value crops hit strict quality grades. Suppliers also test multi-element mixes that address multiple deficiencies simultaneously, reducing labor and field passes. Together, these shifts keep zinc on top yet open space for boron and other rising nutrients to capture share as agronomic knowledge spreads.


By Form: Specialty Formulations Gain Market Traction
Conventional granular and powder products accounted for 78.0% of 2025 sales because they fit into existing spreaders and planters without additional equipment or training. Lower production costs and established supply chains keep prices competitive, which matters on large corn and soybean farms that track every input dollar. Steady adoption is evident as more fields test for shortfalls in zinc, boron, or both.
Specialty formulations are the fastest-growing, with a 6.6% CAGR through 2031, driven by premium crops and precision systems that reward nutrient-use efficiency. Specialty products use chelation, slow-release coatings, and multi-element blends to deliver more nutrients per pound. This higher efficiency can offset the sticker price by trimming the total rate and cutting extra trips across the field. Growers in horticulture, organic programs, and controlled-environment sites accept the premium because crop value is high and quality standards are tight. Continuous product innovation also supports environmental goals by reducing runoff risk, a growing concern for regulators and buyers alike.
By Specialty Type: Water-Soluble Solutions Lead Innovation
Water-soluble micronutrients are the largest segment and accounted for 51.6% of market revenue in 2025, driven by their complete dissolution, which prevents clogged emitters in drip lines and ensures even foliar coverage. The category is projected to advance at a 6.7% CAGR through 2031 as more farms add fertigation equipment and hydroponic systems that allow real-time, stage-specific feeding. Rapid uptake makes these products a go-to option when tissue tests show an unexpected shortfall.
Liquid formulations held the remaining share and are growing as ready-to-use convenience trims on-farm mixing time. Bulk shuttle tanks and returnable totes cut packaging waste and lower freight costs for high-volume users. Stabilizers now keep nutrients in suspension across wide temperature and pH swings, protecting equipment and minimizing downtime. Both formats help growers align nutrient delivery with precision maps, creating a tight link between diagnostics and action.
By Application Mode: Soil Dominance with Fertigation Growth
Soil applications accounted for 77.9% of the 2025 value because broadcast and banded methods fit standard field operations. Variable-rate technology lets growers adjust rates by zone, keeping soil delivery relevant even as other methods evolve. Fertigation is the fastest mover, with a 6.6% CAGR through 2031 as irrigated acres expand and water stewardship rules tighten. Foliar sprays held a significant share because they give specialty crops a quick rescue when deficiencies appear, yet they also trigger Worker Protection Standard requirements that add training and gear costs.
Hardware upgrades such as GPS-guided booms and sectional control make every method more precise. These advances reduce overlap, conserve product, and help growers document stewardship for buyers and regulators. As a result, selection often hinges on crop mix, equipment fleet, and local water policy rather than on product availability.
By Crop Type: Field Crops Anchor Volume while Horticulture Rises
Field crops represented 88.3% of 2025 demand because even low per-acre rates add up across millions of acres. Corn leads usage due to its high zinc and manganese needs, and soybeans increasingly require manganese and iron as yield goals climb. Pulse and forage systems also rely on molybdenum to secure nitrogen from the air.
Horticultural crops are projected to expand at a CAGR of 7.4% from 2026 to 2031, driven by the expansion of fruit, nut, and vegetable cultivation for both domestic consumption and export markets. High market value lets these growers invest in intensive nutrient programs that safeguard quality traits such as color, firmness, and shelf life. Turf and ornamental uses sit on steady demand from golf courses, sports fields, and landscapes that prize visual appeal. Altogether, the crop mix shows how broad-acre staples secure baseline volume while specialty crops supply much of the market’s growth momentum.
Geography Analysis
The United States is the largest geography, accounting for 54.1% of the North America micronutrient fertilizer market in 2025. Adoption aligns with widespread precision farming, where 75% of crop acres deploy GPS-based variable-rate maps that often include micronutrient layers. Soil maps document zinc and manganese shortfalls in the Corn Belt and Plains, convincing growers to add targeted doses as insurance. Federal and state programs covering up to 50% of diagnostic and application costs remove a critical barrier, while an extensive retailer network delivers products within tight planting windows.
Mexico is poised for the fastest 6.6% CAGR over 2026-2031. Investment in drip and subsurface irrigation across avocado, berry, and greenhouse vegetables permits fertigation schedules that fine-tune micronutrient ratios. Export contracts to the United States and Canada impose strict quality grades, incentivizing producers to adopt premium blends. Government extension programs and private agronomists disseminate fertigation protocols, raising technical competence in previously underserved regions.
Canada maintains stable contributions as prairie growers fold boron into canola rotations and manganese into wheat regimens. The Provincial Partnerships Fund on-farm trials that validate yield boosts, thereby spreading confidence among growers traditionally focused on macronutrients. Climatic volatility heightens interest in soil health strategies, where balanced micronutrition supports stress resilience, driving gradual yet steady volume growth. Other North American territories, including Central America, show nascent demand tied to the expansion of specialty export crops. However, lower mechanization and fragmented retail chains delay widespread adoption. As multinational suppliers extend training and logistics support, these areas could see accelerations beyond 2031.
Competitive Landscape
North America’s supplier base features a moderate concentration; the top five firms manage to hold a majority share of sales. The Mosaic Company leads with a prominent share, capitalizing on integrated phosphate mining and value-added processing into chelated liquids. The Andersons Inc. and Yara International ASA follow, each leveraging robust distribution footprints and agronomic advisory teams. Mid-size specialists carve out space with niche formulations for controlled-environment or organic systems, exploiting gaps left by volume-oriented majors.
Digital agronomy platforms evolve into primary battlegrounds. The Mosaic Company and Nutrien Ltd. integrate soil lab results, satellite imagery, and equipment control into single dashboards that simplify decision-making. Patents on stabilized micronutrient coatings rose to 45 filings in 2024, signaling active R and D races. Partnerships between input companies and machinery makers multiply, exemplified by the 2024 Nutrien Ltd. and Deere & Company deal that feeds micronutrient prescriptions to variable-rate spreaders in real time. Price competition remains rational owing to formulation complexity and regulatory compliance costs, leaving innovation and bundled services as chief differentiators.
Smaller entrants focus on circular-economy sourcing, such as boron from e-waste or zinc from galvanized scrap, promoting both sustainability and cost advantages. Organic certifications and heavy-metal compliance become points of brand equity, especially for greenhouse and specialty crop customers willing to pay premiums.
North America Micronutrient Fertilizer Industry Leaders
Sociedad Quimica y Minera de Chile SA
The Andersons Inc.
The Mosaic Company
Wilbur-Ellis Company LLC
Yara International ASA
- *Disclaimer: Major Players sorted in no particular order


Recent Industry Developments
- April 2023: ADOB, a major provider of chelating micronutrients, foliar, and other specialty farming solutions based in Poland, was acquired by Nouryon. Through the acquisition, the company broadened its innovative crop nutrition portfolio.
- October 2022: The Andersons entered an agreement to acquire the assets of Mote Farm Service Inc. to expand its retail farm center network.
- March 2022: The Haifa Group entered a purchase agreement with HORTICOOP BV to acquire Horticoop Andina, the distributor of nutritional products for agriculture. Through this acquisition of the brand, Haifa intends to expand its market presence in the Latin market and strengthen its position as a global superbrand in advanced plant nutrition.


North America Micronutrient Fertilizer Market Report Scope
Boron, Copper, Iron, Manganese, Molybdenum, Zinc, Others are covered as segments by Product. Fertigation, Foliar, Soil are covered as segments by Application Mode. Field Crops, Horticultural Crops, Turf & Ornamental are covered as segments by Crop Type. Canada, Mexico, United States are covered as segments by Country.Product
| Boron |
| Copper |
| Iron |
| Manganese |
| Molybdenum |
| Zinc |
| Others |
Form
| Conventional |
| Specialty |
Specialty Type
| Liquid Fertilizer |
| Water Soluble |
Application Mode
| Fertigation |
| Foliar |
| Soil |
Crop Type
| Field Crops |
| Horticultural Crops |
| Turf and Ornamental |
Geography
| Canada |
| Mexico |
| United States |
| Rest of North America |
| Product | Boron |
| Copper | |
| Iron | |
| Manganese | |
| Molybdenum | |
| Zinc | |
| Others | |
| Form | Conventional |
| Specialty | |
| Specialty Type | Liquid Fertilizer |
| Water Soluble | |
| Application Mode | Fertigation |
| Foliar | |
| Soil | |
| Crop Type | Field Crops |
| Horticultural Crops | |
| Turf and Ornamental | |
| Geography | Canada |
| Mexico | |
| United States | |
| Rest of North America |


Market Definition
- MARKET ESTIMATION LEVEL - Market Estimations for various types of fertilizers has been done at the product-level and not at the nutrient-level.
- NUTRIENT TYPES COVERED - Micronutients: Zn, Mn, Cu, Fe, Mo, B, and Others
- AVERAGE NUTRIENT APPLICATION RATE - This refers to the average volume of nutrient consumed per hectare of farmland in each country.
- CROP TYPES COVERED - Field Crops: Cereals, Pulses, Oilseeds, and Fiber Crops Horticulture: Fruits, Vegetables, Plantation Crops and Spices, Turf Grass and Ornamentals
| Keyword | Definition |
|---|---|
| Fertilizer | Chemical substance applied to crops to ensure nutritional requirements, available in various forms such as granules, powders, liquid, water soluble, etc. |
| Specialty Fertilizer | Used for enhanced efficiency and nutrient availability applied through soil, foliar, and fertigation. Includes CRF, SRF, liquid fertilizer, and water soluble fertilizers. |
| Controlled-Release Fertilizers (CRF) | Coated with materials such as polymer, polymer-sulfur, and other materials such as resins to ensure nutrient availability to the crop for its entire life cycle. |
| Slow-Release Fertilizers (SRF) | Coated with materials such as sulfur, neem, etc., to ensure nutrient availability to the crop for a longer period. |
| Foliar Fertilizers | Consist of both liquid and water soluble fertilizers applied through foliar application. |
| Water-Soluble Fertilizers | Available in various forms including liquid, powder, etc., used in foliar and fertigation mode of fertilizer application. |
| Fertigation | Fertilizers applied through different irrigation systems such as drip irrigation, micro irrigation, sprinkler irrigation, etc. |
| Anhydrous Ammonia | Used as fertilizer, directly injected into the soil, available in gaseous liquid form. |
| Single Super Phosphate (SSP) | Phosphorus fertilizer containing only phosphorus which has lesser than or equal to 35%. |
| Triple Super Phosphate (TSP) | Phosphorus fertilizer containing only phosphorus greater than 35%. |
| Enhanced Efficiency Fertilizers | Fertilizers coated or treated with additional layers of various ingredients to make it more efficient compared to other fertilizers. |
| Conventional Fertilizer | Fertilizers applied to crops through traditional methods including broadcasting, row placement, ploughing soil placement, etc. |
| Chelated Micronutrients | Micronutrient fertilizers coated with chelating agents such as EDTA, EDDHA, DTPA, HEDTA, etc. |
| Liquid Fertilizers | Available in liquid form, majorly used for application of fertilizers to crops through foliar and fertigation. |


Research Methodology
Mordor Intelligence follows a four-step methodology in all our reports.
- Step-1: IDENTIFY KEY VARIABLES: In order to build a robust forecasting methodology, the variables and factors identified in Step-1 are tested against available historical market numbers. Through an iterative process, the variables required for market forecast are set and the model is built on the basis of these variables.
- Step-2: Build a Market Model: Market-size estimations for the forecast years are in nominal terms. Inflation is not a part of the pricing, and the average selling price (ASP) is kept constant throughout the forecast period for each country.
- Step-3: Validate and Finalize: In this important step, all market numbers, variables and analyst calls are validated through an extensive network of primary research experts from the market studied. The respondents are selected across levels and functions to generate a holistic picture of the market studied.
- Step-4: Research Outputs: Syndicated Reports, Custom Consulting Assignments, Databases & Subscription Platforms


