Market Overview
| Study Period | 2021 - 2031 |
|---|---|
| Forecast Data Period | 2026 - 2031 |
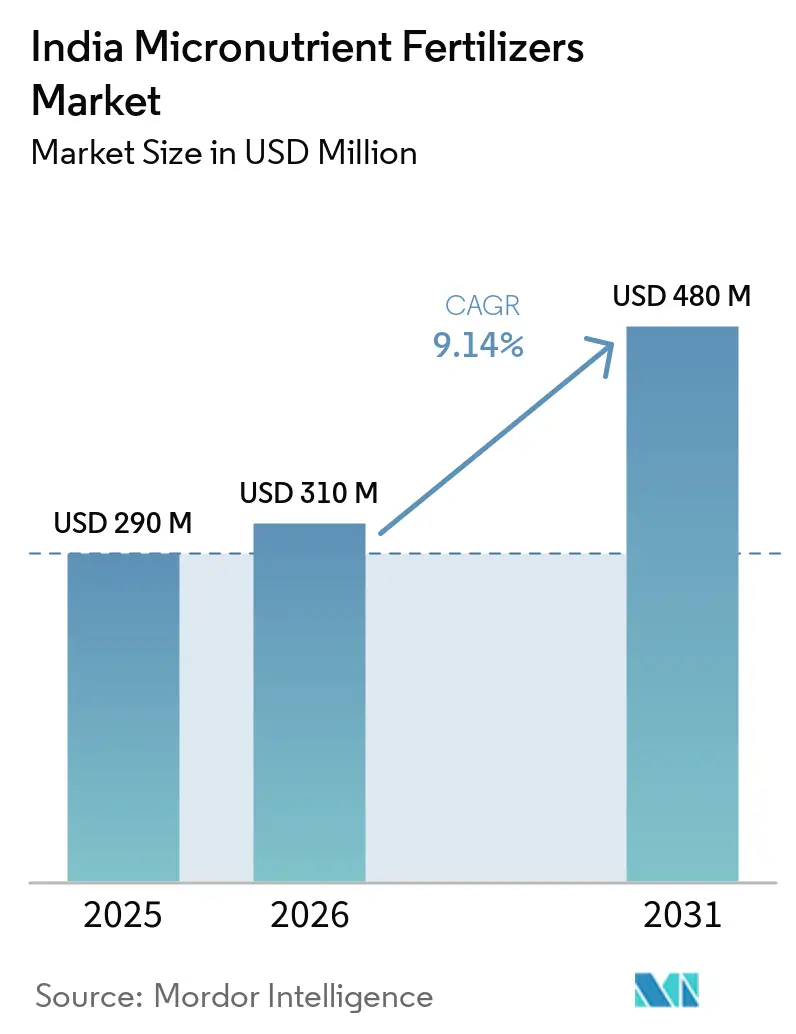
| Base Year Market Size (2025) | USD 290 Million |
| Market Size (2026) | USD 310 Million |
| Market Size (2031) | USD 480 Million |
| Growth Rate (2026 - 2031) | 9.14% CAGR |
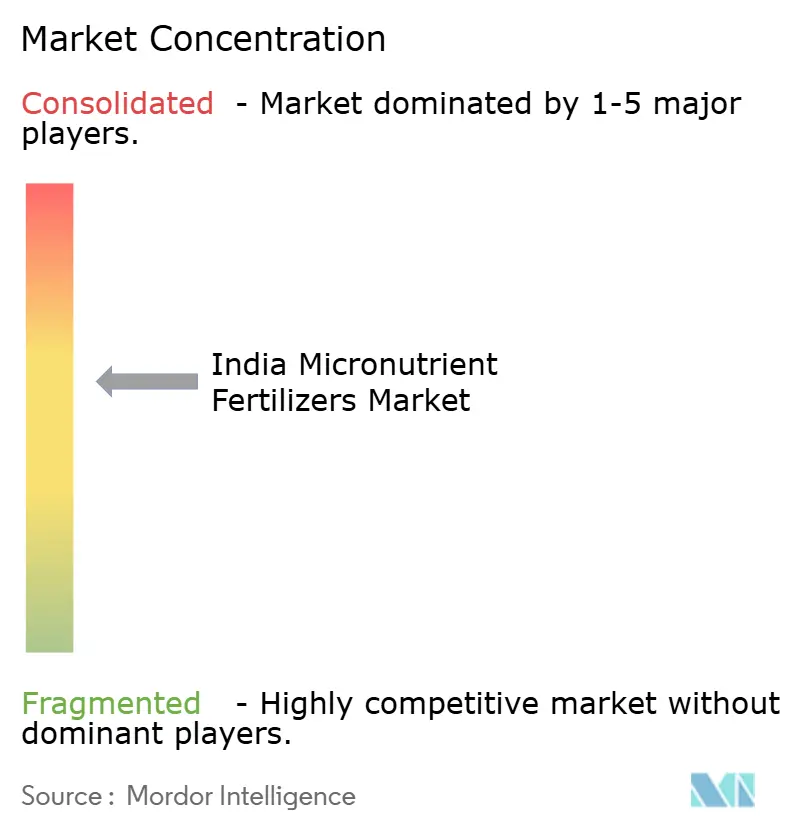
| Market Concentration | Medium |
Major Players *Disclaimer: Major Players sorted in no particular order Image © Mordor Intelligence. Reuse requires attribution under CC BY 4.0. | |
India Micronutrient Fertilizers Market Analysis by Mordor Intelligence
The India micronutrient fertilizers market size is projected to grow from USD 290.0 million in 2025 to USD 310.0 million in 2026 and is forecast to reach USD 480.0 million by 2031 at 9.14% CAGR over 2026 to 2031. This trajectory reflects the widening soil-health gap across 146 million hectares of cultivated land, intensifying public investment in balanced nutrition, and the rapid scale-up of micro-irrigation systems that favor soluble and chelated inputs [1]Source: Indian Council of Agricultural Research, “Soil Health and Nutrient Management,” ICAR, icar.org.in . Persistent zinc, boron, and iron deficiencies have sharpened farmers' focus on precision supplementation, while rising horticultural exports push demand for premium formulations. Convergence between digital soil testing, nano-encapsulation, and government subsidies lowers adoption barriers, yet price volatility in mined concentrates and counterfeit products in tier-2 and tier-3 markets temper growth momentum. Technology-enabled traceability, fortified NPK blends under the Nutrient-Based Subsidy (NBS-2) window, and carbon-credit premiums for yield-linked emission reductions provide new revenue avenues for input producers and growers alike [2]Source: Fertiliser Association of India, “Fertiliser Statistics 2024-25,” FAI, faidelhi.org .
Key Report Takeaways
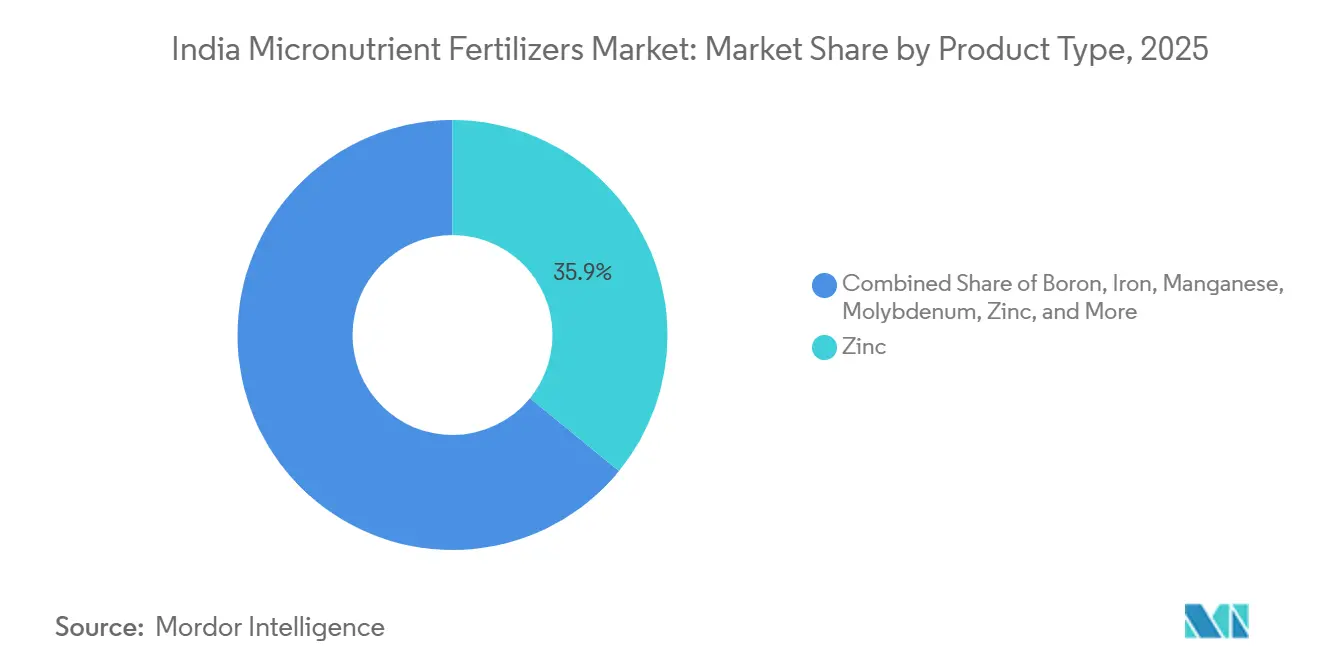
- By product type, zinc formulations accounted for the largest India micronutrient fertilizers market share in 2025, representing 35.9% of the market, while boron products are projected to be the fastest-growing segment, registering a CAGR of 10.6% during 2026–2031.
- By application mode, soil application accounted for the largest India micronutrient fertilizers market size in 2025, representing 45.8% of the market, whereas fertigation is projected to be the fastest-growing application method, expanding at a CAGR of 12.1% during 2026–2031.
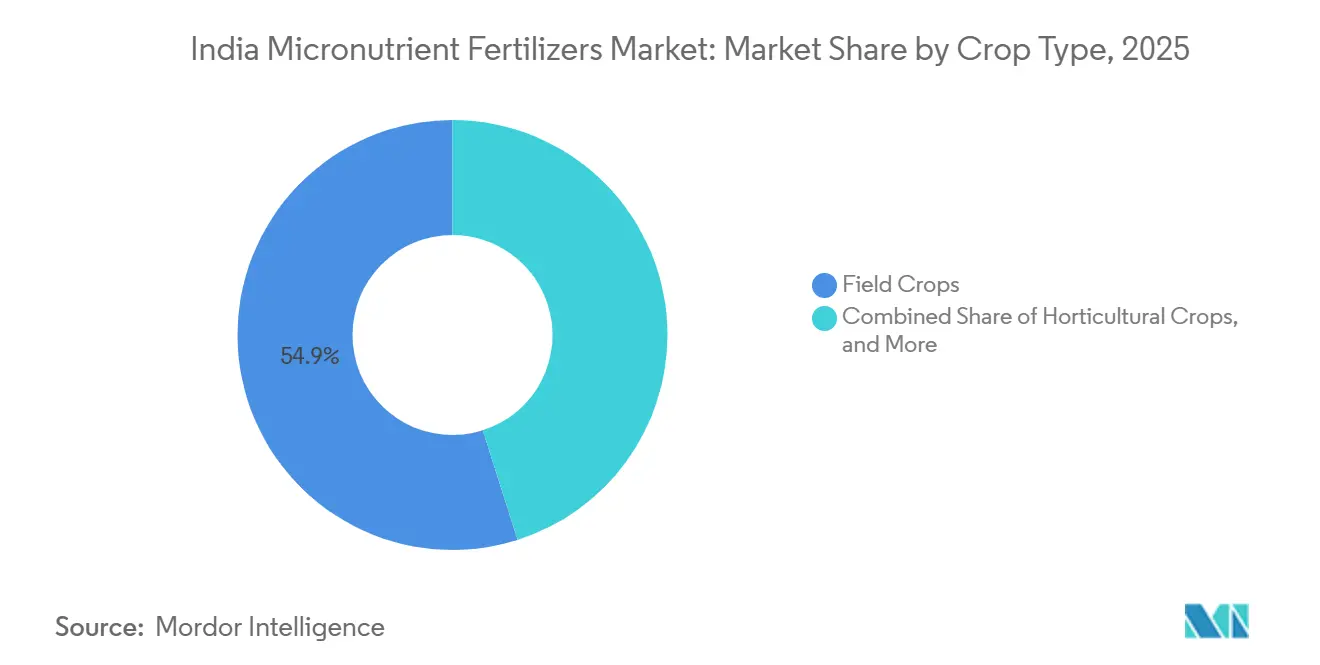
- By crop type, field crops accounted for the largest share of the India micronutrient fertilizers market, representing 54.9% in 2025, while horticultural crops are forecast to be the fastest-growing segment, advancing at a CAGR of 11.0% during 2026–2031.
Note: Market size and forecast figures in this report are generated using Mordor Intelligence’s proprietary estimation framework, updated with the latest available data and insights as of 2026.
India Micronutrient Fertilizers Market Trends and Insights
Drivers Impact Analysis*
| Driver | (~) % Impact on CAGR Forecast | Geographic Relevance | Impact Timeline |
|---|---|---|---|
| Rising Soil Micronutrient Depletion Across Intensively Farmed Districts | +1.80% | Punjab, Haryana, Western Uttar Pradesh, and North Karnataka | Medium term (2-4 years) |
| Government Subsidy Extension for Fortified NPK Blends (NBS-2) | +1.50% | National, early gains in Maharashtra, Karnataka, and Andhra Pradesh | Short term (≤ 2 years) |
| Rapid Adoption of Specialty Chelated Formulations by Horticulture Clusters | +1.20% | Maharashtra, Karnataka, Gujarat, and Andhra Pradesh | Medium term (2-4 years) |
| Expansion of Fertigation Infrastructure under Pradhan Mantri Krishi Sinchayee Yojana (PMKSY) Micro-Irrigation Scheme | +1.00% | Rajasthan, Gujarat, Maharashtra, and Karnataka | Long term (≥ 4 years) |
| Emerging Nano-Micronutrient Products from Indian Ag-Tech Start-Ups | +0.80% | Punjab, Haryana, and Western Maharashtra | Long term (≥ 4 years) |
| Carbon-Credit Premium for Micronutrient-Driven Yield Boosts | +0.40% | Maharashtra, Karnataka, and Tamil Nadu | Long term (≥ 4 years) |
| Source: Mordor Intelligence | |||


Rising Soil Micronutrient Depletion Across Intensively Farmed Districts
Continuous rice-wheat and cotton cycles in Punjab, Haryana, and Western Uttar Pradesh have depleted zinc, boron, and iron reserves faster than natural replenishment, resulting in reduced yield gains despite increased macronutrient use. Soil Health Card data show that 78% of Punjab’s and 65% of Haryana’s cultivated soils now test zinc-deficient [3]Source: Punjab Agricultural University, “Soil Health Assessment Report 2024,” PAU, pau.edu . Economists estimate significant annual output losses associated with these gaps. Corrective zinc applications deliver 200-400 kg per-hectare wheat gains and 300-600 kg rice gains, prompting district authorities to intensify extension outreach. Mandatory micronutrient labeling under the Fertilizer Control Order (FCO) and expanded lab testing capacity serve as a backstop for quality assurance, making the driver structurally positive for the India micronutrient fertilizers market.
Government Subsidy Extension for Fortified NPK Blends (NBS-2)
Beginning December 2024, micronutrient-fortified DAP and NPK grades will qualify for direct farm-gate support, reducing retail prices by 40–50% and increasing adoption in Maharashtra, Karnataka, Andhra Pradesh, and Tamil Nadu from 15% in 2022 to 28% in 2024 [4]Source: Indian Institute of Horticultural Research, “Micronutrient Management in Horticultural Crops,” ICAR-IIHR, iihr.res.in . The budgetary outlay under the NBS window increased from INR 795 billion (USD 9.62 billion) in 2023-24 to INR 875 billion (USD 10.5 billion) in 2024-25, encouraging manufacturers such as IFFCO and Coromandel to expand their blending capacity by 35%. Digital tracking through Primary Agricultural Credit Societies reduces the risk of diversion, and the mandatory Fertilizer Control Order (FCO) specifications ensure that every bag sold contains functional levels of zinc, boron, or iron. The subsidy is front-loaded, so the bulk of market lift is projected within the next two seasons, though balanced nutrition awareness will persist beyond the payout period.
Rapid Adoption of Specialty Chelated Formulations by Horticulture Clusters
High-value crops, such as grapes, citrus, mango, and pomegranate, exhibit a faster uptake of the Ethylene diamine tetraacetic acid (EDTA)- and amino acid-chelated micronutrients, which offer three-to-five times higher bioavailability than sulfate salts. Despite commanding 40–60% price premiums, chelates reduce application rates 30–40% and enhance fruit color, brix, and shelf life, attributes that export houses reward. Maharashtra’s Nashik grape belt, Karnataka’s mango tracts, and Gujarat’s citrus orchards have recorded double-digit growth in chelate use, supported by drip lines that allow precise fertigation. Multinationals Yara Fertilisers India Private Limited and BASF India Limited have commissioned domestic plants to localize their output and avoid import costs, while the Bureau of Indian Standards (BIS) has introduced new chelate stability norms that protect grower returns.
Emerging Nano-Micronutrient Products from Ag-Tech Startups
Domestic startups are commercializing nano-encapsulated zinc and boron that boast 80–90% uptake efficiency and reduced leaching losses. Trials on progressive farms in Punjab and Western Maharashtra have recorded yield increases of 10–14% for wheat and soybeans with application rates one-tenth those of bulk grades. Yara and Tata Chemicals formed a joint venture in November 2024 to co-develop nano dispersions adapted to alkaline soils, validating commercial traction for the technology. Although currently niche, the platform attracts venture funding and aligns with the government’s carbon-credit framework, which rewards higher nutrient-use efficiency.
Restraints Impact Analysis*
| Restraint | (~) % Impact on CAGR Forecast | Geographic Relevance | Impact Timeline |
|---|---|---|---|
| Counterfeit and Spurious Product Circulation in Tier-2/3 Agri-Inputs Markets | −1.2% | Uttar Pradesh, Bihar, Odisha, and Madhya Pradesh | Short term (≤ 2 years) |
| Volatility in Mined Zinc and Boron Concentrate Prices | −0.8% | National | Medium term (2-4 years) |
| Limited Farmer Awareness in Eastern and North-Eastern States | −0.6% | West Bengal, Assam, Jharkhand, and Seven Sisters North Eastern States | Medium term (2-4 years) |
| Logistics Bottlenecks for Bulk Micronutrient Movement to Land-Locked Regions | −0.4% | Madhya Pradesh, Chhattisgarh, and Jharkhand | Long term (≥ 4 years) |
| Source: Mordor Intelligence | |||
Counterfeit and Spurious Product Circulation in Tier-2/3 Agri-Inputs Markets
Subpar powders masquerading as micronutrient blends account for 15–20% of the supply in Bihar, Uttar Pradesh, and Odisha, where small dealers dominate input retail. Lab tests reveal that metal contents are 30–50% below the labels, causing crop failures that discourage legitimate purchases. Limited inspectorates and a lack of accredited laboratories hinder enforcement under the Fertilizer Control Order. Large producers have added QR code verification, and the smartphone penetration gaps and poor digital literacy are slowing down take-up. Until authentication scales and dealer audits tighten, counterfeit leakage will shave 1.2 percentage points off the India micronutrient fertilizers market CAGR in the near term.
Logistics Bottlenecks for Bulk Micronutrient Movement to Land-Locked Regions
Haulage costs for micronutrient powders to Central India climb 18–22% above coastal averages due to road congestion and limited rail siding access. Seasonal floods in the Narmada and Son river basins compound delays, causing stock-outs during peak sowing. Manufacturers holding small depots in Chhattisgarh and Jharkhand face higher working capital locks. Unless rail freight concessions expand under the Bharatmala corridors, the bottleneck will persist, shaving 0.4% points off long-term growth.
*Our forecasts treat driver/restraint impacts as directional, not additive. The impact forecasts reflect baseline growth, mix effects, and variable interactions.
Segment Analysis
By Product Type: Zinc Retains the Lead, Boron Posts the Fastest Climb
Zinc formulations accounted for 35.9% of the India micronutrient fertilizers market share in 2025, highlighting their critical role in addressing one of the country's most prevalent soil nutrient deficiencies. Demand remains particularly strong in the cultivation of rice, wheat, and maize, where zinc application is directly associated with improved yields and enhanced nutrient-use efficiency. The segment's position has been further reinforced by the expansion of soil-testing initiatives and balanced fertilization programs.
The market is gradually shifting toward boron-based products, which are projected to register a CAGR of 10.6% during 2026–2031. The increasing cultivation of fruits, vegetables, oilseeds, and plantation crops is driving demand for boron, which plays a vital role in flowering, pollination, fruit set, and crop development. Additionally, the growing adoption of specialty micronutrient blends and fertigation-compatible formulations is creating new growth opportunities beyond traditional zinc products. Fertilizers containing iron, copper, manganese, and molybdenum continue to play an important supporting role in addressing crop- and region-specific nutrient deficiencies across India's diverse agricultural systems.


By Application Mode: Soil Broadcasting Dominates, Fertigation Rallies
Traditional soil broadcasting accounted for 45.8% of India micronutrient fertilizers market share in 2025, embedded in smallholder farming routines that pair basal macronutrients with trace elements. The approach leverages existing spreader equipment and cooperatives’ bulk-bag logistics, keeping unit costs low.
Fertigation exhibits the strongest upside, with a 12.1% CAGR through 2031, as drip lines advance under the Pradhan Mantri Krishi Sinchayee Yojana (PMKSY) subsidy and water scarcity drives precision feeding. Drip-compatible chelates slash application rates and deliver uniformity, particularly in vineyards and vegetable tunnels. Foliar sprays remain a tactical fix for acute deficiencies, capturing share in peri-urban horticulture. Over the forecast window, fertigation’s share is set to double, nudging soil application below the 90% threshold for the first time in two decades.
By Crop Type: Field Crops Still Rule, Horticulture Sprints Ahead
Field crops accounted for 54.9% of the India micronutrient fertilizers market size in 2025, with rice and wheat alone covering approximately 75 million hectares. Demand is closely tied to food security priorities and public procurement programs that emphasize yield stability. Zinc- and iron-based fertilizers dominate nutrient recommendations, with applications primarily delivered through bulk sulfate formulations at sowing.
Horticultural crops are projected to register a CAGR of 11.0% during 2026–2031, driven by increasing demand for fruits, vegetables, spices, and plantation crops that require precise micronutrient management to enhance yield, quality, and shelf life. The growing adoption of chelated micronutrients, water-soluble formulations, and fertigation practices is further supporting segment growth. Turf and ornamental crops, while remaining a niche but high-value segment, continue to benefit from demand generated by golf courses, landscaping projects, nurseries, and urban greening initiatives that prioritize plant appearance, quality, and overall aesthetic value.
Geography Analysis
Northern granaries, including those in Punjab and Haryana, together absorbed a major share of 2024 sales, underpinned by intensive rice-wheat rotations that enhance zinc mining. Yield plateaus and generous extension budgets make the twin states reliable, albeit mature, demand centers. Western powerhouses Maharashtra and Gujarat had seen a good market, driven by diversification into sugarcane, cotton, and horticulture. Maharashtra alone delivered growth, driven by cooperative distribution and a vibrant fruit export pipeline.
Southern front-runners Karnataka and Andhra Pradesh are clocking the fastest gains, largely due to the proliferation of drip irrigation, grape pack-houses, and floriculture clusters. Government e-marketplace portals and start-up-driven advisory apps enhance last-mile delivery, narrowing knowledge gaps and increasing repeat purchases.
The east and northeast remain under-penetrated, holding a significant collective share. Yet schemes such as Rashtriya Krishi Vikas Yojana earmark targeted subsidies and field demonstrations to lift awareness in Jharkhand, Odisha, Assam, and the Seven Sisters. As logistics corridors under Bharatmala and riverine ferries come online, these regions could emerge as swing markets late in the decade, adding upside optionality to the India micronutrient fertilizers market forecast.
Competitive Landscape
The market is moderately concentrated, with the major companies such as, Chambal Fertilizers & Chemicals Ltd, Yara Fertilisers India Private Limited, Zuari Agro Chemicals Limited, Coromandel International Limited, and Deepak Fertilizers and Petrochemicals Corporation Limited, commanding significant shares in 2024. Legacy distribution, captive blending capacity, and established farmer trust underpin their lead. Strategic acquisitions such as Chambal’s takeover of Sunrise Agri Products and Yara’s nano alliance with Tata Chemicals showcase inorganic plays that bolster specialty portfolios.
Technology is the new battleground. Leaders deploy nano-encapsulation, controlled-release coatings, and soluble chelates to differentiate beyond commodity powders. Digital agronomy platforms deliver soil test-based prescriptions, locking growers into closed-loop ecosystems that bundle seed, nutrition, and financing. Mid-tier players defend their territory by forging regional dealer tie-ups and offering credit lines to retailers, although thin capitalization limits their R&D spend.
Start-ups disrupt at the edge with app-based advisory services, blockchain traceability, and carbon credit linkage. While their current volumes are modest, partnership models with co-operatives grant them fast lane access to half a million farmer networks. Regulation under the Fertilizer Control Order favors incumbents with compliant laboratories and recurring license renewals, yet the surge of private testing laboratories gradually reduces entry barriers. Overall rivalry intensifies as niche premium segments outpace the broad-acre base, prompting incumbents to defend share through price promotions and loyalty schemes.
India Micronutrient Fertilizers Industry Leaders
Chambal Fertilizers & Chemicals Ltd
Yara Fertilisers India Private Limited
Zuari Agro Chemicals Limited
Deepak Fertilizers and Petrochemicals Corporation Limited
Coromandel International Limited
- *Disclaimer: Major Players sorted in no particular order

Recent Industry Developments
- October 2025: Coromandel International has commissioned a USD 25 million plant in Kakinada to enhance its production capabilities. This new facility has resulted in a 40% increase in the output of chelated zinc and boron, strengthening the company's position in the agricultural inputs market.
- October 2025: India expanded the NBS scheme to include micronutrient-fortified DAP and NPK, aiming to enhance nutrient use efficiency and improve crop productivity. An additional INR 50 billion (USD 600 million) has been allocated to the 2025-26 budget to support this initiative.
- December 2024: IFFCO introduced nano urea combined with micronutrient packs across 15 states following an investment of USD 30 million in nanotechnology. This initiative aims to enhance agricultural productivity by providing farmers with advanced nutrient solutions that improve crop yield and soil health.


India Micronutrient Fertilizers Market Report Scope
Boron, Copper, Iron, Manganese, Molybdenum, Zinc, Others are covered as segments by Product. Fertigation, Foliar, Soil are covered as segments by Application Mode. Field Crops, Horticultural Crops, Turf & Ornamental are covered as segments by Crop Type.Product
| Boron |
| Copper |
| Iron |
| Manganese |
| Molybdenum |
| Zinc |
| Others |
Application Mode
| Fertigation |
| Foliar |
| Soil |
Crop Type
| Field Crops |
| Horticultural Crops |
| Turf and Ornamental |
| Product | Boron |
| Copper | |
| Iron | |
| Manganese | |
| Molybdenum | |
| Zinc | |
| Others | |
| Application Mode | Fertigation |
| Foliar | |
| Soil | |
| Crop Type | Field Crops |
| Horticultural Crops | |
| Turf and Ornamental |


Market Definition
- MARKET ESTIMATION LEVEL - Market Estimations for various types of fertilizers has been done at the product-level and not at the nutrient-level.
- NUTRIENT TYPES COVERED - Micronutients: Zn, Mn, Cu, Fe, Mo, B, and Others
- AVERAGE NUTRIENT APPLICATION RATE - This refers to the average volume of nutrient consumed per hectare of farmland in each country.
- CROP TYPES COVERED - Field Crops: Cereals, Pulses, Oilseeds, and Fiber Crops Horticulture: Fruits, Vegetables, Plantation Crops and Spices, Turf Grass and Ornamentals
| Keyword | Definition |
|---|---|
| Fertilizer | Chemical substance applied to crops to ensure nutritional requirements, available in various forms such as granules, powders, liquid, water soluble, etc. |
| Specialty Fertilizer | Used for enhanced efficiency and nutrient availability applied through soil, foliar, and fertigation. Includes CRF, SRF, liquid fertilizer, and water soluble fertilizers. |
| Controlled-Release Fertilizers (CRF) | Coated with materials such as polymer, polymer-sulfur, and other materials such as resins to ensure nutrient availability to the crop for its entire life cycle. |
| Slow-Release Fertilizers (SRF) | Coated with materials such as sulfur, neem, etc., to ensure nutrient availability to the crop for a longer period. |
| Foliar Fertilizers | Consist of both liquid and water soluble fertilizers applied through foliar application. |
| Water-Soluble Fertilizers | Available in various forms including liquid, powder, etc., used in foliar and fertigation mode of fertilizer application. |
| Fertigation | Fertilizers applied through different irrigation systems such as drip irrigation, micro irrigation, sprinkler irrigation, etc. |
| Anhydrous Ammonia | Used as fertilizer, directly injected into the soil, available in gaseous liquid form. |
| Single Super Phosphate (SSP) | Phosphorus fertilizer containing only phosphorus which has lesser than or equal to 35%. |
| Triple Super Phosphate (TSP) | Phosphorus fertilizer containing only phosphorus greater than 35%. |
| Enhanced Efficiency Fertilizers | Fertilizers coated or treated with additional layers of various ingredients to make it more efficient compared to other fertilizers. |
| Conventional Fertilizer | Fertilizers applied to crops through traditional methods including broadcasting, row placement, ploughing soil placement, etc. |
| Chelated Micronutrients | Micronutrient fertilizers coated with chelating agents such as EDTA, EDDHA, DTPA, HEDTA, etc. |
| Liquid Fertilizers | Available in liquid form, majorly used for application of fertilizers to crops through foliar and fertigation. |


Research Methodology
Mordor Intelligence follows a four-step methodology in all our reports.
- Step-1: IDENTIFY KEY VARIABLES: In order to build a robust forecasting methodology, the variables and factors identified in Step-1 are tested against available historical market numbers. Through an iterative process, the variables required for market forecast are set and the model is built on the basis of these variables.
- Step-2: Build a Market Model: Market-size estimations for the forecast years are in nominal terms. Inflation is not a part of the pricing, and the average selling price (ASP) is kept constant throughout the forecast period for each country.
- Step-3: Validate and Finalize: In this important step, all market numbers, variables and analyst calls are validated through an extensive network of primary research experts from the market studied. The respondents are selected across levels and functions to generate a holistic picture of the market studied.
- Step-4: Research Outputs: Syndicated Reports, Custom Consulting Assignments, Databases & Subscription Platforms


