United Kingdom Car Insurance Market Size and Share
Market Overview
| Study Period | 2020 - 2031 |
|---|---|
| Forecast Data Period | 2026 - 2031 |
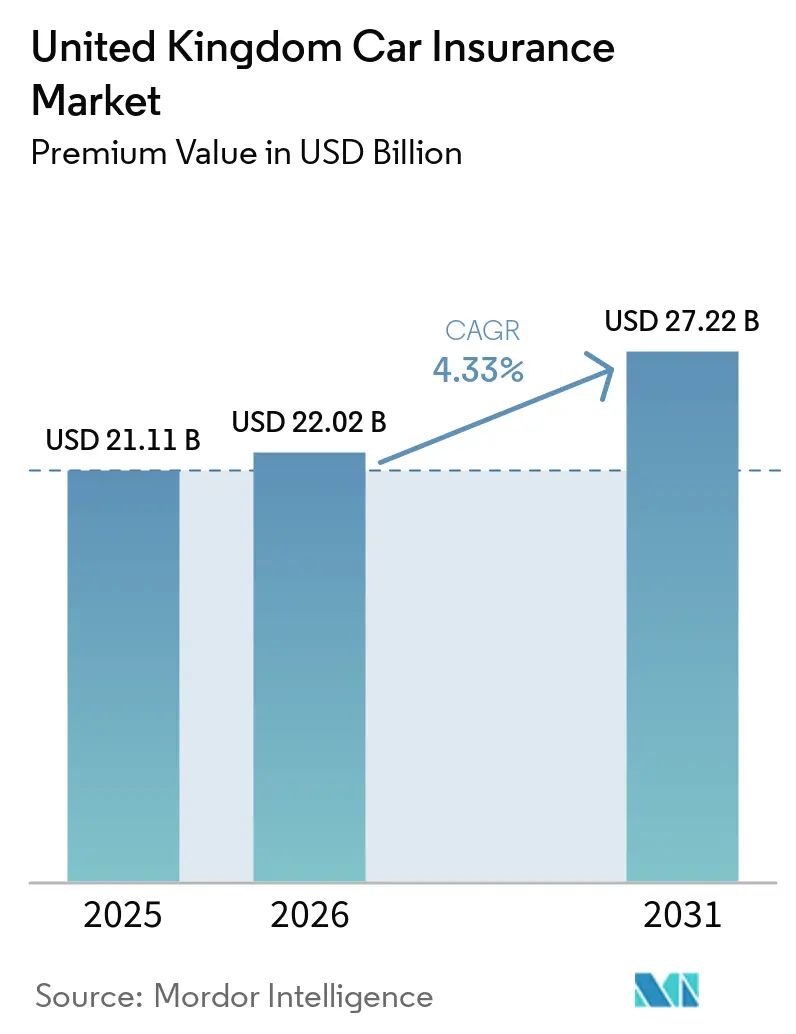
| Base Year Market Size (2025) | USD 21.11 Billion |
| Market Size (2026) | USD 22.02 Billion |
| Market Size (2031) | USD 27.22 Billion |
| Growth Rate (2026 - 2031) | 4.33% CAGR |
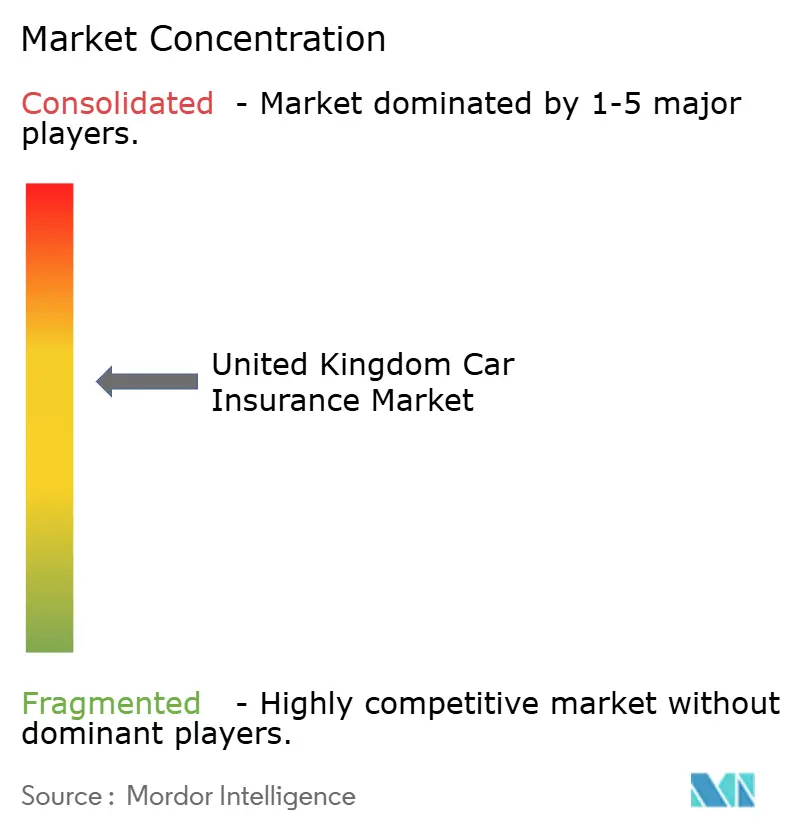
| Market Concentration | Medium |
Major Players *Disclaimer: Major Players sorted in no particular order Image © Mordor Intelligence. Reuse requires attribution under CC BY 4.0. | |
United Kingdom Car Insurance Market Analysis by Mordor Intelligence
The United Kingdom Car Insurance Market size in terms of premium value is expected to increase from USD 21.11 billion in 2025 to USD 22.02 billion in 2026 and reach USD 27.22 billion by 2031, growing at a CAGR of 4.33% over 2026-2031.
Strong premium growth rests on insurers’ ability to recalibrate pricing for escalating repair costs, widen usage-based offerings, and embed cover at the point of vehicle sale. Mega-mergers are intensifying competition, while rapid electrification, telematics adoption, and AI-driven claims automation reshape operating models. Regulatory scrutiny under the FCA Consumer Duty pushes product redesign toward clearer value, and the sector’s underwriting resilience hinges on synchronizing cost controls with technology-enabled efficiency. Overall, the United Kingdom car insurance market continues to evolve from price-led rivalry toward capability-led differentiation.
Key Report Takeaways
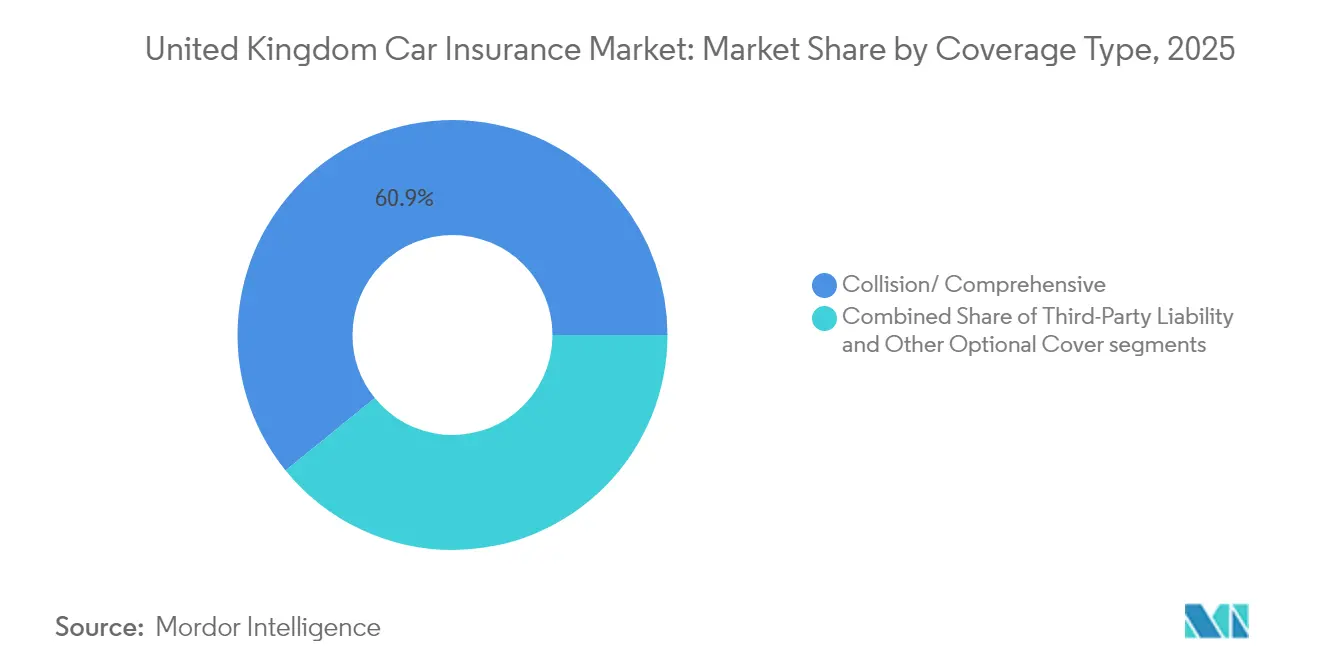
- By coverage type, collision/comprehensive lines commanded 60.85% of the United Kingdom car insurance market share in 2025, while other optional covers are forecast to expand at 5.73% CAGR through 2031.
- By application, personal vehicles accounted for 82.75% of the UK car insurance market size in 2025; commercial vehicles are advancing at a 6.39% CAGR to 2031.
- By distribution channel, intermediated models held 45.10% of the UK car insurance market size in 2025, whereas embedded insurance is the fastest-growing channel at 3.16% CAGR.
- By vehicle powertrain, ICE policies retained a 65.05% share in 2025; electric vehicle cover is expanding at 4.46% CAGR through 2031.
- By company, the proposed Aviva–Direct Line combination is expected to control roughly one-fifth of personal motor premiums, redefining competitive balance.
Note: Market size and forecast figures in this report are generated using Mordor Intelligence’s proprietary estimation framework, updated with the latest available data and insights as of 2026.
United kingdom holds a defined position within a broader international distribution. The car insurance market share data by Mordor Intelligence maps that allocation across all contributing countries and regions, globally.
United Kingdom Car Insurance Market Trends and Insights
Drivers Impact Analysis*
| Driver | (~) % Impact on CAGR Forecast | Geographic Relevance | Impact Timeline |
|---|---|---|---|
| Telematics-based usage-based insurance | +0.8% | National; early gains in London, Manchester, Birmingham | Medium term (2-4 years) |
| Rapid expansion of the UK electric-vehicle parc | +0.6% | London, Southeast England, Scotland | Long term (≥ 4 years) |
| Post-COVID mileage rebound & growing ownership | +0.5% | National; strongest recovery in Northwest England | Short term (≤ 2 years) |
| AI-driven claims automation & fraud analytics | +0.7% | National | Medium term (2-4 years) |
| Stricter enforcement of compulsory motor insurance | +0.3% | National | Medium term (2-4 years) |
| OEM-embedded motor insurance partnerships | +0.4% | National; premium-segment focus | Long term (≥ 4 years) |
| Source: Mordor Intelligence | |||
Telematics-based usage-based insurance adoption
Usage-based pricing is moving from niche to mainstream as 61% of drivers signal willingness to share vehicle data for customized premiums. Growth accelerates because traditional rating factors understate actual risk, particularly as post-pandemic traffic has rebounded to 105% of 2019 levels[1]Department for Transport, “Road Traffic Estimates in Great Britain 2024,” gov.uk . The forthcoming EU-style data-sharing frameworks are likely to increase consumer trust by giving motorists control over telematics consent. Nevertheless, adoption divides along digital affinity lines; technology-savvy motorists embrace data-sharing, while privacy-conscious segments maintain conventional cover. Insurers that orchestrate seamless onboarding and transparent data governance gain a persistent pricing advantage.
Rapid expansion of the UK electric-vehicle parc
Government mandates require 22% of new-car sales to be zero-emission in 2024, and the EV parc’s growth reveals wide underwriting gaps. Average EV premiums of USD 1,344 exceed petrol equivalents by 46% because specialized repairs and battery risks elevate severity. A shortage of certified EV technicians drives more total losses for minor damage, lifting claim costs and disrupting parts availability. Chinese manufacturers’ limited UK repair infrastructure renders certain models challenging to insure, creating pricing tiers between makes. Insurers that invest early in EV repair networks and training realize profitable niches, while laggards risk margin erosion and reputational setbacks.
Post-COVID mileage rebound and growing car ownership
Annual vehicle miles reached 332.9 billion for the 12 months ending June 2024, marking a 1.9% year-on-year increase driven by rising mobility demand. Cars account for 76% of total traffic, and the average resident completes 915 trips annually, reflecting an entrenched preference for private transport over shared or public alternatives. Van traffic has already surpassed pre-2020 levels, spurred by the sustained growth in e-commerce logistics, thereby heightening commercial fleet exposure and claims complexity. The continued upward trend in mileage supports motor insurance premium expansion; however, affordability concerns linger as household budgets remain under pressure from broader cost-of-living challenges. Insurers must navigate the delicate balance between exposure-led revenue growth and increasing regulatory expectations to deliver and demonstrate fair value. This is prompting renewed focus on usage-based pricing, transparent underwriting models, and proactive engagement with price-sensitive segments.
AI-driven claims automation & fraud analytics
Fraudulent motor claims cost insurers more than USD 1.1 billion, with digitally manipulated photos rising threefold between 2021 and 2023. AI-enabled claims platforms cut loss-adjustment expenses and flag anomalies in seconds, shifting human resources to complex cases. Deloitte forecasts sector-wide fraud-detection savings of up to USD 160 billion by 2032. Admiral’s Google Cloud partnership personalises pricing, while RSA’s Guidewire rollout automates triage, shortening settlement cycles[2]Insurance Times Editorial Team, “Admiral Chooses Google Cloud for AI Claims,” insurancetimes.co.uk. Early adopters gain cost efficiency and customer-experience gains that compound competitively over time.
Restraints Impact Analysis*
| Restraint | (~) % Impact on CAGR Forecast | Geographic Relevance | Impact Timeline |
|---|---|---|---|
| Repair-cost and parts-inflation squeezing margins | -1.2% | National; acute in London and Southeast England | Short term (≤ 2 years) |
| Price-comparison websites intensifying price wars | -0.9% | National | Medium term (2-4 years) |
| Data-privacy pushback limiting telematics uptake | −0.4% | National | Long term (≥ 4 years) |
| High EV-battery repair costs increasing risk load | −0.6% | London, Southeast England, Scotland | Long term (≥ 4 years) |
| Source: Mordor Intelligence | |||
Repair-cost and parts-inflation squeezing margins
Average repair bills surged 26% year on year, reaching USD 2 billion in Q3 2024, reflecting sustained cost pressures across the claims value chain. Advanced driver-assistance systems (ADAS) and integrated vehicle electronics increasingly require specialist labour, driving up hourly rates and contributing to prolonged repair cycle times. Simultaneously, lingering global supply-chain disruptions and tariff-related friction have inflated parts prices, compounding claims severity and adding volatility to repair cost forecasts. Players now face difficult trade-offs: either pass rising costs onto consumers through premium hikes or absorb them through tighter margins, both of which invite heightened scrutiny from the FCA under its fair pricing framework. These pressures are pushing insurers to prioritise operational streamlining, invest in digital claims automation, and form strategic procurement alliances with OEMs and repair networks. Insurers are also re-evaluating repair triage models and parts sourcing strategies to reduce leakage and protect customer satisfaction.
Price-comparison websites intensifying price wars
Roughly 90% of shoppers now source quotes through aggregator sites, accelerating the commoditisation of motor insurance and intensifying price-based competition. Direct Line’s 2024 move onto comparison platforms highlights the competitive gravity exerted by these channels[3]Direct Line Group, “2024 Strategy Presentation,” directlinegroup.co.uk . While transparent pricing enhances consumer empowerment and shopping efficiency, it also fuels a race-to-the-bottom dynamic that compresses underwriting margins, particularly for smaller or scale-constrained players. Regulatory demands for demonstrable value further amplify pressure on insurers to justify price differentials through service quality, claims efficiency, and product innovation. Many are responding by refining segmentation strategies and exploring embedded or usage-based models to regain pricing flexibility and customer relevance.
*Our forecasts treat driver/restraint impacts as directional, not additive. The impact forecasts reflect baseline growth, mix effects, and variable interactions.
Segment Analysis
By Coverage: Comprehensive Dominance Faces Optional Innovation
Collision/Comprehensive products led with a 60.85% share in 2025, anchoring the UK car insurance market’s largest revenue pool. Optional covers such as key-loss, EV battery, and cyber protections, though smaller, are projected to expand at 5.73% CAGR by 2031. Margin pressure within compulsory lines drives insurers to craft ancillary protections that resonate with emerging mobility risks. The FCA’s Consumer Duty prompts clearer benefit articulation, steering product design toward measurable value and transparent pricing. Insurers that modularize offerings provide customers with tailored bundles, raising retention and diversified premium streams.
Third-party liability remains a mandated commodity where service responsiveness overrides coverage latitude. Competitive differentiation shifts to claim-time experience, with AI-supported first-notification workflows raising satisfaction scores. As connected-car data feeds broaden risk granularity, the United Kingdom car insurance market sheds one-size-fits-all plans. Companies that quickly convert behavioral insights into responsibly priced optional features will compound growth and enhance customer stickiness.


By Application: Commercial Acceleration Amid Personal Stability
Personal vehicle policies generated 82.75% of premiums in 2025, underscoring the historic backbone of the United Kingdom car insurance market. Yet e-commerce expansion, fleet electrification mandates, and telematics insights propel Commercial Vehicles to a leading 6.39% CAGR through 2031. Higher average premiums per unit and proactive risk-management cultures lift commercial underwriting economics. Logistics operators deploy connected-fleet dashboards, supplying granular data that allows insurers to price on activity instead of historical proxies.
Personal lines face aggregator-led commoditization, prompting players to harvest cost efficiencies, personalize offers, and broaden value-added services. Meanwhile, last-mile delivery demand accelerates van registrations beyond 2019 levels, enlarging commercial risk pools. The United Kingdom car insurance market is therefore rebalancing: stable but margin-compressed personal lines coexist with technology-rich, faster-growing commercial segments offering scale playbooks for data-savvy insurers.
By Distribution Channel: Embedded Emergence Challenges Traditional Models
Intermediated distribution, spanning brokers, banks, and building societies, retained a 45.10% share in 2025 by leveraging extensive customer bases and advice-led selling. Lloyds Banking Group’s exclusive five-year arrangement with AXA underscores bancassurance durability. Yet embedded propositions integrated at the vehicle point-of-sale expand at 3.16% CAGR, promising friction-free cover activation and sustained brand engagement. Deloitte estimates 20% embedded penetration could divert USD 50 billion in global auto premiums away from conventional channels.
Direct channels, once marketed as low-cost alternatives, now rely on aggregators for reach, blurring distinctions with broker pathways. OEM-insurer alliances under the Automated Vehicles Act will likely shift liability structures, making embedded models the default for self-driving features by 2026. Successful players will orchestrate omni-channel ecosystems: sustaining broker partnerships for complex risks, refining digital self-service for price-sensitive shoppers, and co-creating embedded solutions with manufacturers and retailers.

By Vehicle Powertrain: ICE Resilience Meets EV Complexity
ICE policies continued to dominate the UK car insurance market with a 65.05% share in 2025, reflecting the nation’s sizable legacy vehicle parc. Battery-Electric Vehicle cover, though smaller, is growing at 4.46% CAGR, propelled by government sales quotas and corporate fleet commitments. Average EV claims run 35% above petrol equivalents due to specialized repair and battery costs. This cost differential widens technical-pricing uncertainty, encouraging some insurers to refine segment-based deductibles and preferred-repairer networks.
Plug-in hybrid and fuel-cell categories remain in niche laboratories where insurers test risk algorithms and repair-logistics partnerships. Chinese marque penetration exposes gaps in parts supply and accredited repair facilities, raising insurability concerns. The UK car insurance market rewards incumbents that invest in EV-specific capability early, cementing expertise before electrification reaches mass scale. In parallel, ICE underwriting profit pools persist as a funding source for innovation spend.
Geography Analysis
London retains the cost pinnacle, with average premiums at USD 1,501 in 2025, a function of dense traffic, heightened theft risk, and elevated labour rates. The capital’s high EV concentration introduces complex repair pathways, prompting insurers to strike a balance between premium adequacy and affluent-segment retention. South East England mirrors London’s risk complexion, driven by congested commuter corridors and premium vehicle prevalence. Early electrification adoption in this region gives insurers a proving ground for EV-focused products, albeit with persistent cost volatility.
Scotland displays more moderate pricing, helped by lower congestion, yet offset by severe weather exposure and extended parts-supply lead times. Regional players leverage knowledge of rural repair capacity to maintain competitiveness against nationwide brands. North West England, centred on Manchester, records the sharpest post-COVID traffic rebound, aided by manufacturing resurgence and e-commerce fulfilment hubs. Claims frequency here rises in tandem, pushing premiums 44% above the national mean.
The Midlands presents balanced risk, combining major logistics corridors with a diversified economic base. Wales benefits from lower vehicle density yet faces rural repair-access challenges that elongate claim cycles. Northern Ireland’s separate legislative framework shapes distinctive underwriting conditions, with average premiums persistently higher because of limited competition and divergent legal cost structures. Across all regions, the UK car insurance market integrates granular postcode-level data to refine pricing, mitigating adverse selection and encouraging behaviour-based discounting.
Mordor Intelligence delivers a comprehensive view of the car insurance market across all major regions such as Europe and Asia, alongside country-level analysis for Germany, Russia, India, Japan, China, France, and Brazil, each offering a view of the local market realities.
Competitive Landscape
The proposed USD 3.7 billion Aviva acquisition of Direct Line heralds the most significant consolidation move in two decades, potentially handing the combined entity one-fifth of personal motor premiums pending CMA approval. Admiral Group also retains a significant share, capitalizing on multi-brand reach, agile telematics pricing, and disciplined cost control. RSA’s pivot under the Intact banner pivots toward commercial specialties, while AXA leverages the Lloyds bancassurance deal to deepen retail distribution.
Competition bifurcates between scale-driven conglomerates and focused insurgents. Start-ups such as Cuvva and By Miles exploit mobile-first journeys and pay-per-mile models, winning younger demographics. Embedded specialists partner with OEMs to wrap cover into vehicle financing, reducing acquisition cost per policy. Technology partnerships deliver tangible advantage: Admiral’s Google Cloud alliance personalizes offers in real time, and RSA’s Guidewire cloud rollout trims claims cycle time by 20%.
Regulation shapes the strategic agenda. The FCA premium-finance market study compels players to scrutinize instalment pricing, curbing ancillary revenue streams. Consumer Duty disclosure forces transparent commission structures, levelling broker versus direct economics. Amid rising claim inflation, only insurers mastering data-driven underwriting, cost-efficient operations, and customer-centric innovation retain sustainable margins in the United Kingdom car insurance market.
United Kingdom Car Insurance Industry Leaders
Admiral Group
Direct Line Group
Aviva plc
LV= General Insurance
AXA UK
- *Disclaimer: Major Players sorted in no particular order

Recent Industry Developments
- April 2025: RSA announced to be rebranded as Intact Insurance by the end of 2025. The move follows its acquisitions of NIG and FarmWeb, aligning all operations under a single identity.
- December 2024: Aviva has agreed to acquire Direct Line in a deal valued at USD 3.7 billion, aiming to strengthen its position in the UK general insurance market. The transaction is expected to complete by mid-2025
- December 2024: AXA UK signed a five-year exclusive distribution agreement with Lloyds Banking Group, set to begin in May 2025. The partnership will provide insurance solutions to Lloyds’ 27 million customers, significantly expanding AXA’s retail reach in the UK market.
- December 2024: Ageas reached terms to buy Saga’s Acromas Insurance for USD 100 million, establishing a 20-year over-50s distribution alliance.


Research Methodology Framework and Report Scope
Market Definitions and Key Coverage
Our study defines the United Kingdom car-insurance market as all gross written premiums arising from policies that protect privately registered passenger cars and light commercial vehicles against third-party liability, own damage, theft, fire, and allied risks. Policies sold to UK-domiciled customers through direct digital channels, agents, brokers, banks, and embedded partners are in scope, provided cover is underwritten by a regulated UK carrier.
Scope exclusions include motorcycle-only cover, stand-alone breakdown assistance, cross-border fleet programs written for vehicles garaged outside the UK, and pay-as-you-drive products still in pilot phase, which are outside this assessment.
Segmentation Overview
- By Coverage
- Third-Party Liability
- Collision / Comprehensive
- Other Optional Covers
- By Application
- Personal Vehicles
- Commercial Vehicles
- By Distribution Channel
- Direct-to-Consumer (DTC)
- Intermediated (includes agents, brokers, bancassurance, and other traditional third-party channels)
- Embedded (insurance sold as an add-on within another purchase journey)
- By Vehicle Powertrain
- Internal-Combustion Engine (ICE)
- Battery-Electric Vehicles (BEV)
- Plug-in Hybrid Vehicles (PHEV)
- Fuel-Cell Electric Vehicles (FCEV)
- By Region
- London
- South East England
- Scotland
- North West England
Detailed Research Methodology and Data Validation
Primary Research
Structured interviews with underwriting executives, actuarial consultants, price-comparison specialists, body-shop networks, and EV leasing managers across England, Scotland, Wales, and Northern Ireland validated premium growth drivers, loss-ratio assumptions, and telematics penetration that were unclear from secondary material.
Desk Research
Mordor analysts first mapped the premium pool using freely available tier-1 sources such as Financial Conduct Authority solvency filings, Association of British Insurers quarterly premium statistics, DVLA vehicle-in-use data, HMRC import duty records for replacement parts, and Office for National Statistics vehicle miles-traveled series. Company 10-Ks, investor decks, and press releases complemented these public datasets. Paid databases that filled financial or news gaps included D&B Hoovers for carrier splits and Dow Jones Factiva for claims cost trends. The sources cited here illustrate, but do not exhaust, the literature used.
Market-Sizing & Forecasting
A top-down gross-premium build began with FCA-reported net earned premiums, which were then reconciled with ABI channel splits and DVLA vehicle cohorts. Select bottom-up checks, such as sampled average premium multiplied by insured car parc and broker panel roll-ups, tempered over- or under-shoots. Key variables modeled include new-car registrations, repair-cost inflation, EV share of the parc, telematics policy mix, regulatory caps on renewal pricing, and average miles traveled. Forecasts to 2030 use multivariate regression with scenario analysis around claims-inflation shocks; coefficient ranges were agreed with interviewees. Data voids, such as gray-import cover, were bridged by ratio benchmarks from similar EU markets.
Data Validation & Update Cycle
Outputs pass anomaly screens, peer reviews, and a senior analyst sign-off. The dataset refreshes annually, with interim updates triggered by material events such as FCA pricing reforms or sudden claims-cost spikes, ensuring clients always receive an up-to-date baseline.
Why Mordor's United Kingdom Car Insurance Baseline Commands Reliability
Published figures often diverge because studies apply different premium definitions, vehicle cohorts, and refresh cadences. Our disciplined scope, multi-variable model, and annual update rhythm yield a balanced, decision-ready number.
The comparison shows that variance stems chiefly from scope breadth, accounting treatments, and data vintages; by explicitly defining inclusions and cross-checking against both regulatory filings and ground-level interviews, Mordor delivers the most transparent and reproducible baseline for UK car-insurance decision-makers.
Benchmark comparison
| Market Size | Anonymized source | Primary gap driver |
|---|---|---|
| USD 21.11 B (2025) | Mordor Intelligence | - |
| USD 29.30 B (2024) | Global Consultancy A | Includes commercial fleets and uses headline GWP without stripping reinsurance recoveries |
| USD 23.90 B (2024) | Regional Consultancy B | Converts ABI data at fixed FX rates and omits embedded-insurance premiums |
| USD 21.33 B (2024) | Trade Journal C | Relies on price-comparison site survey data that overweights online direct sales |
The comparison shows that variance stems chiefly from scope breadth, accounting treatments, and data vintages; by explicitly defining inclusions and cross-checking against both regulatory filings and ground-level interviews, Mordor delivers the most transparent and reproducible baseline for UK car-insurance decision-makers.


Key Questions Answered in the Report
How large is the UK car insurance market in 2026 and how fast will it grow?
The market is valued at USD 22.02 billion in 2026 and is forecast to expand to USD 27.22 billion by 2031, reflecting a 4.33% CAGR.
Which coverage type commands the greatest share of premiums?
Collision/Comprehensive policies account for 60.85% of premiums, maintaining clear leadership within the market.
Why are electric-vehicle premiums higher than petrol-car premiums?
Average EV claims are 35% costlier due to specialised repair, battery risks, and limited certified repair capacity, pushing average EV premiums to USD 1,344 versus USD 924 for petrol cars.
What distribution channel is growing the fastest?
Embedded insurance integrated at the vehicle point-of-sale is the most rapidly expanding channel, advancing at a 3.16% CAGR through 2031.
Page last updated on:


