Cancer Biological Therapy Market Size and Share
Market Overview
| Study Period | 2019 - 2030 |
|---|---|
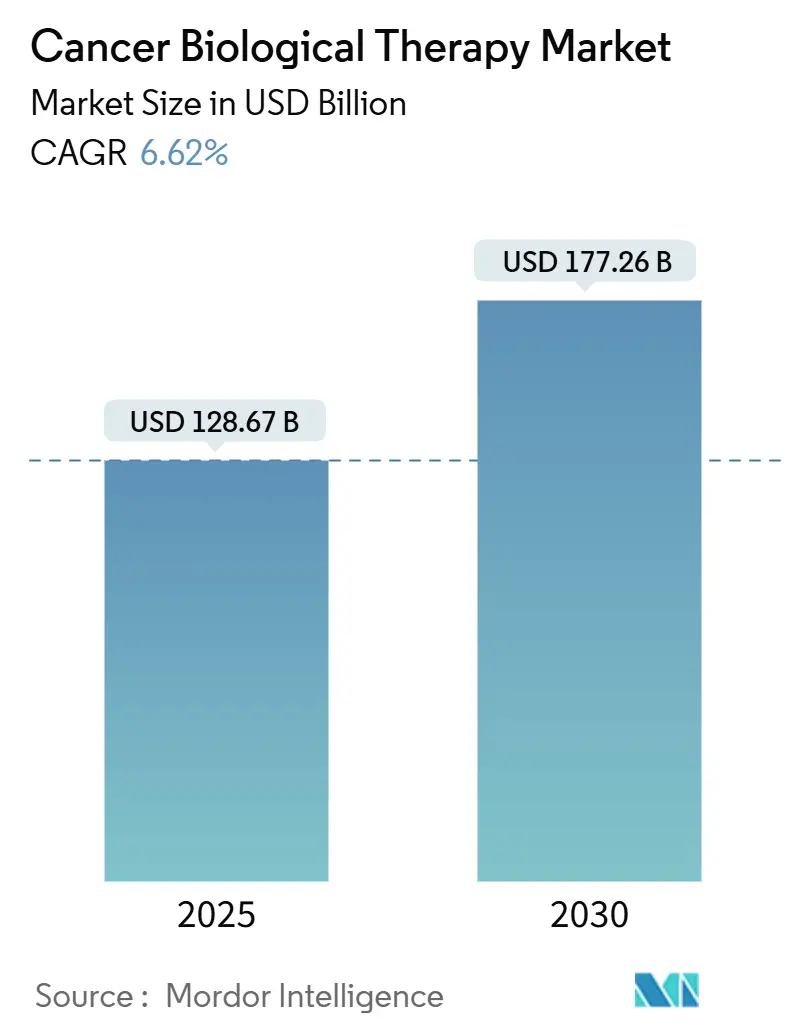
| Market Size (2025) | USD 128.67 Billion |
| Market Size (2030) | USD 177.26 Billion |
| Growth Rate (2025 - 2030) | 6.62% CAGR |
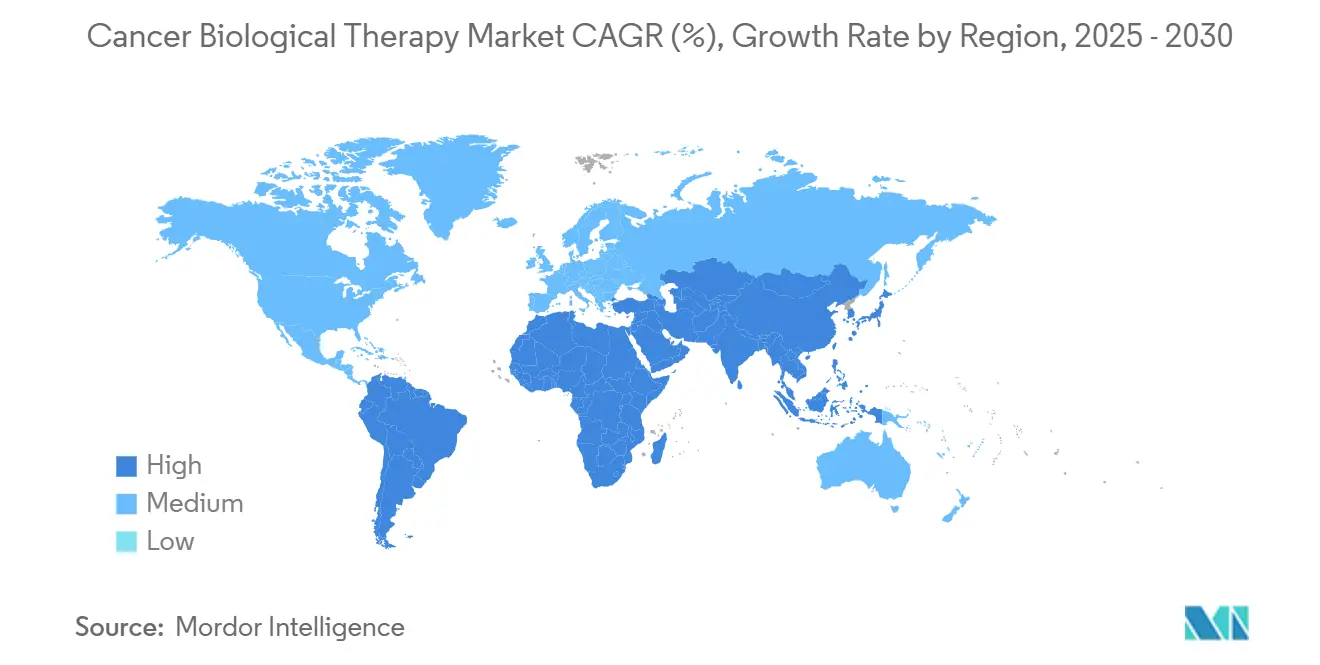
| Fastest Growing Market | Asia Pacific |
| Largest Market | North America |
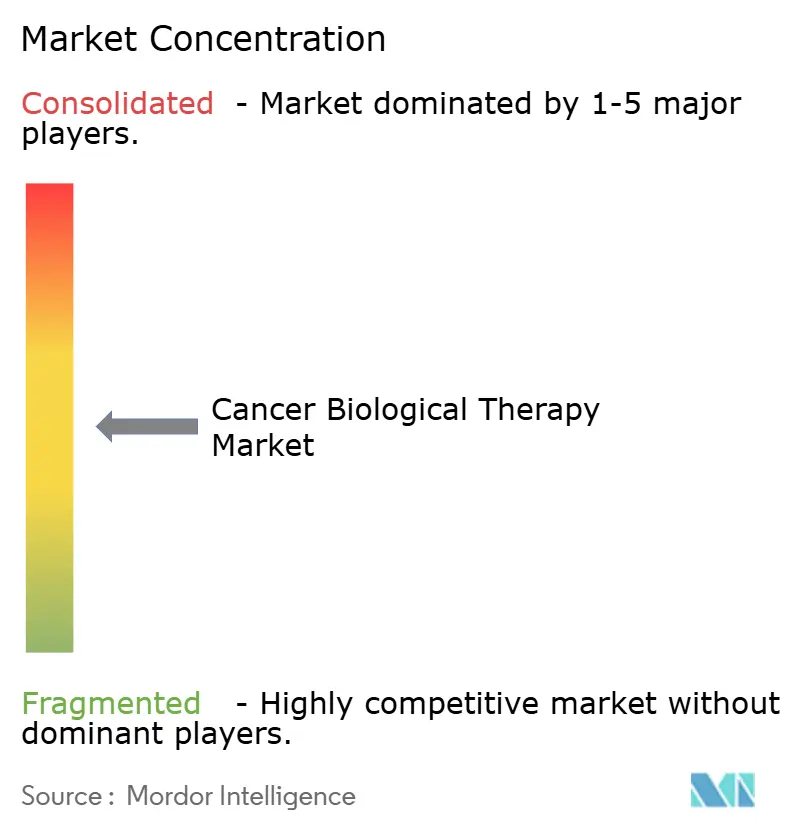
| Market Concentration | Medium |
Major Players *Disclaimer: Major Players sorted in no particular order Image © Mordor Intelligence. Reuse requires attribution under CC BY 4.0. | |
Cancer Biological Therapy Market Analysis by Mordor Intelligence
The cancer biological therapy market size stood at USD 128.67 billion in 2025 and is forecast to reach USD 177.26 billion by 2030, advancing at a 6.62% CAGR. Resilient demand for targeted immunotherapies, rapid regulatory clearance of next-generation cell therapies, and sustained investment in precision medicine underpin this growth. Breakthrough designations for CAR-T candidates such as afamitresgene autoleucel and obecabtagene autoleucel exemplify how streamlined review pathways shorten time-to-market and expand the treated population. Intensifying consolidation—Roche’s Poseida acquisition and Johnson & Johnson’s Ambrx buyout—signals industry focus on differentiated platforms that combine potency with manageable safety profiles. Parallel expansion of manufacturing footprints, notably Gilead’s four-fold CAR-T scale-up, seeks to ease supply constraints. On the demand side, widening screening programs, biomarker-guided therapy selection, and aging demographics enlarge eligible patient pools, while payer scrutiny and cost-containment legislation temper price realization.
Key Report Takeaways
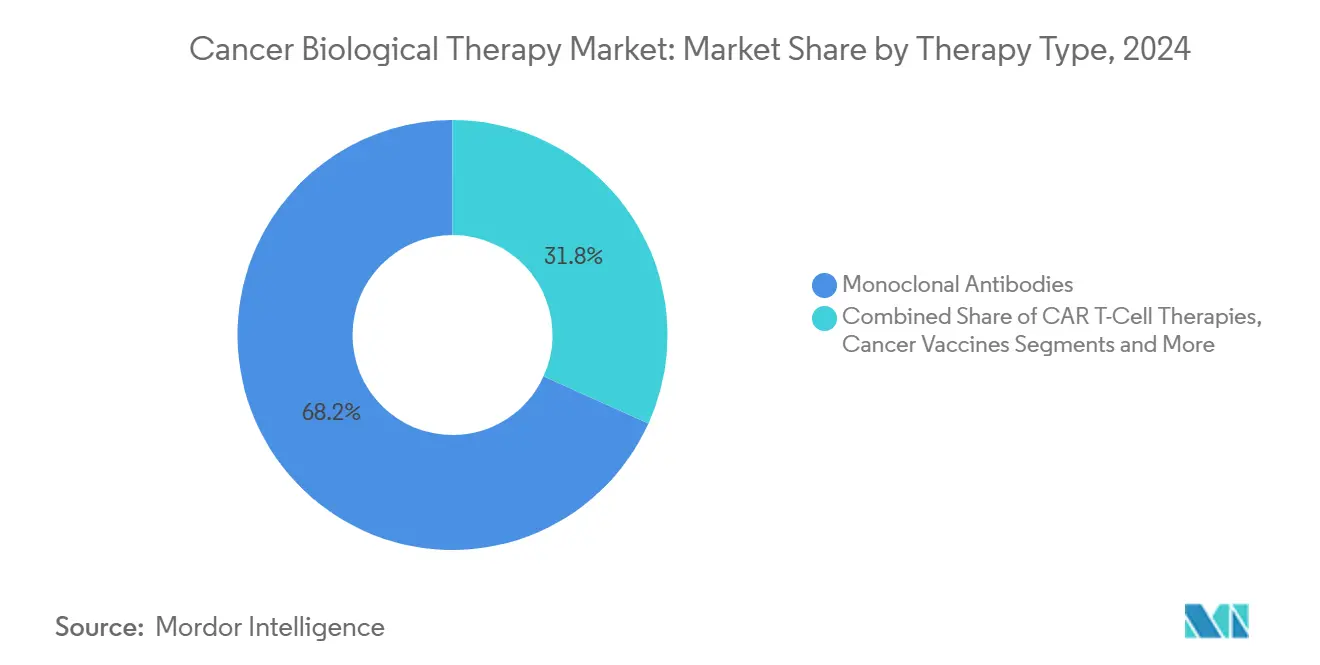
- By therapy type, monoclonal antibodies accounted for 68.24% of the cancer biological therapy market share in 2024, whereas CAR-T cell therapies are poised to post the highest 9.37% CAGR through 2030.
- By cancer type, lung cancer represented 21.35% of 2024 revenue, while hematologic malignancies are projected to expand at the fastest 10.36% CAGR over the forecast period.
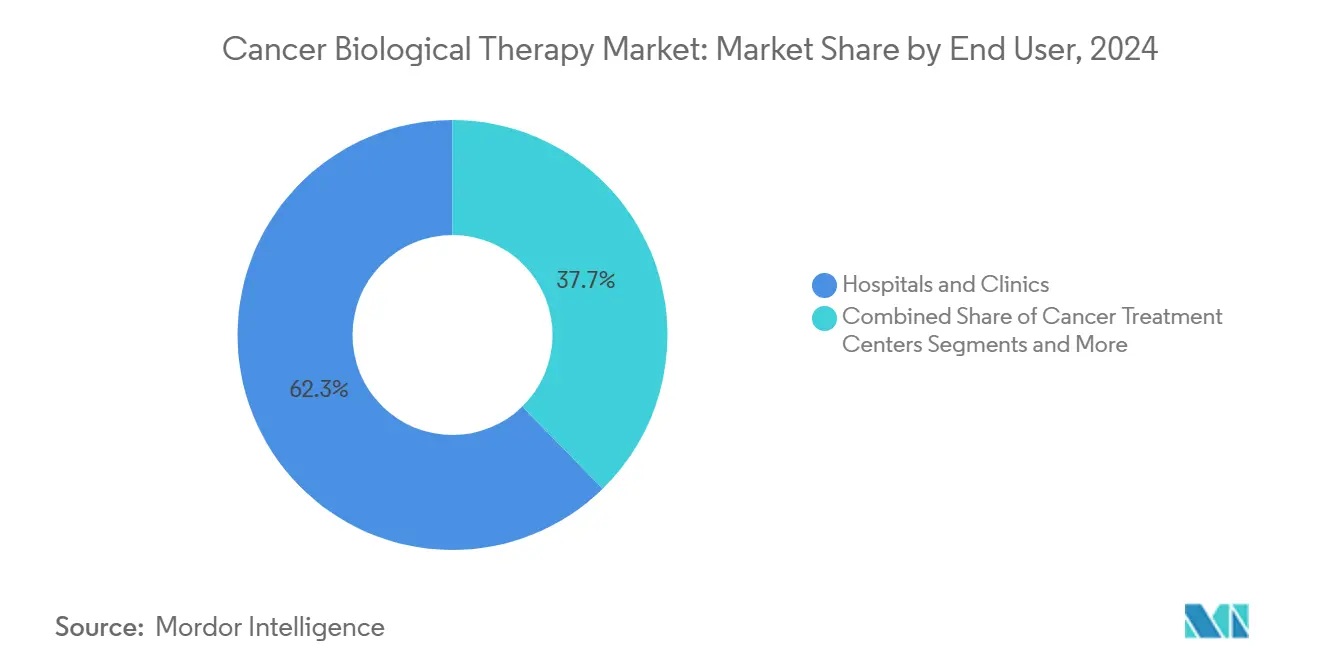
- By end user, hospitals and clinics held 62.31% of spending in 2024; cancer treatment centers are predicted to lead growth with an 8.24% CAGR to 2030.
- By route of administration, intravenous delivery captured 67.36% of 2024 uptake, yet intratumoral administration is expected to advance at a 9.72% CAGR.
- By geography, North America led with 33.57% revenue share in 2024, whereas Asia-Pacific is anticipated to record the quickest 8.41% CAGR through 2030.
Global Cancer Biological Therapy Market Trends and Insights
Drivers Impact Analysis*
| Driver | (~) % Impact on CAGR Forecast | Geographic Relevance | Impact Timeline |
|---|---|---|---|
| Rising cancer incidence and aging demographics | +1.8% | North America, Europe, global emerging markets | Long term (≥ 4 years) |
| Accelerated regulatory approvals and breakthrough designations | +1.2% | Global, led by FDA & EMA | Medium term (2-4 years) |
| Expanding indications for existing immunotherapies | +0.9% | North America & EU core, APAC emerging | Medium term (2-4 years) |
| Growth of precision oncology and biomarker-driven therapies | +1.1% | Developed markets worldwide | Long term (≥ 4 years) |
| AI-powered antibody discovery shortening development cycles | +0.7% | North America & EU, spill-over APAC | Long term (≥ 4 years) |
| Emerging multi-specific & next-gen biologics enabling higher efficacy | +0.8% | U.S., EU, Japan | Medium term (2-4 years) |
| Source: Mordor Intelligence | |||
Rising Cancer Incidence and Aging Demographics
The number of newly diagnosed cancers is climbing alongside higher life expectancy, particularly in North America and Europe, where individuals aged 65+ represent the fastest-growing cohort.[1]Vanessa Bernal, “Phase 1 Clinical Trials: Challenges and Opportunities in Latin America,” Journal of Immunotherapy and Precision Oncology, jipo.innovationsjournals.comEarlier detection programs elevate diagnosis rates and lengthen therapeutic courses, lifting volume demand for biologics. Latin America anticipates a 66% incidence surge by 2040, highlighting untapped treatment needs. In parallel, emerging economies are channeling resources into cost-effective biologics and local manufacturing to narrow access gaps.
Accelerated Regulatory Approvals and Breakthrough Designations for Biologics
Seven CAR-T products had received FDA approval by January 2025, reflecting an unprecedented pace of regulatory action.[2]U.S. Food and Drug Administration, “International Regulatory Harmonization,” U.S. Food and Drug Administration, fda.govThe International Council for Harmonisation’s guidelines have reduced duplicative trials, compressing global launch timelines. Europe’s Health Technology Assessment regulation, effective 2025, harmonizes evidence appraisal across member states, creating a clearer path to reimbursement.
Expanding Indications for Existing Immunotherapies
Checkpoint inhibitors and monoclonal antibodies now address tissue-agnostic, biomarker-defined tumors such as dMMR/MSI-H malignancies.[3]James Kelland, “Target-Driven Tissue-Agnostic Drug Approvals—A New Path of Drug Development,” Cancers (MDPI), mdpi.com Bristol Myers Squibb’s Opdivo revenue climbed 9% year-over-year in Q1 2025 after combination approvals for hepatocellular and colorectal cancer. Label breadth leverages known safety records, lowers development risk, and sustains lifecycle revenue.
Growth of Precision Oncology and Biomarker-Driven Therapies
Tumor-agnostic approvals for NTRK fusion inhibitors larotrectinib and entrectinib illustrate the pivot from histology to genomic signatures. Falling sequencing costs and robust bioinformatics platforms enable real-time biomarker matching, boosting therapy effectiveness and payer acceptance.
Restraints Impact Analysis*
| Restraint | (~) % Impact on CAGR Forecast | Geographic Relevance | Impact Timeline |
|---|---|---|---|
| High treatment costs and reimbursement barriers | −1.4% | Global, acute in emerging markets | Short term (≤ 2 years) |
| Immune-related adverse events & safety concerns | −0.8% | Worldwide, affecting CAR-T & checkpoint uptake | Medium term (2-4 years) |
| Limited manufacturing capacity for viral vectors & cell therapies | −1.0% | U.S., EU, select APAC hubs | Short term (≤ 2 years) |
| Regulatory ambiguity around novel modular biologics | −0.6% | Region-dependent | Medium term (2-4 years) |
| Source: Mordor Intelligence | |||
High Treatment Costs and Reimbursement Barriers
Twenty-two of thirty-nine novel oncology drugs lacked reimbursement in Morocco during 2024, illustrating affordability gaps. The U.S. Inflation Reduction Act pressures post-launch pricing, while Medicare payment adjustments strain oncology practices. Conversely, Brazil achieved 55.9% cost savings through biosimilar substitution, signaling an emerging template for budget-limited markets.
Immune-Related Adverse Events and Safety Concerns
Cytokine release syndrome (CRS) and immune effector cell-associated neurotoxicity syndrome (ICANS) necessitate intensive monitoring and specialized centers. FDA black-box warnings on secondary malignancies issued in 2024 elevate clinician vigilance. Tocilizumab and corticosteroid protocols have reduced grade-3/4 event rates, yet concerns still influence prescribing behavior.
*Our forecasts treat driver/restraint impacts as directional, not additive. The impact forecasts reflect baseline growth, mix effects, and variable interactions.
Segment Analysis
By Therapy Type: Monoclonal Antibodies Lead Despite CAR-T Acceleration
The cancer biological therapy market size for monoclonal antibodies reached USD 87.8 billion in 2024, equivalent to a 68.24% share. Familiar safety profiles, scalable manufacturing, and multi-tumor labels underpin dominance. Immune checkpoint inhibitors maintain revenue resilience through expanded combinations. In parallel, CAR-T therapies are projected to log a 9.37% CAGR and capture increasing hematologic indications through 2030. Antibody-drug conjugates gain momentum as Johnson & Johnson integrates Ambrx’s site-specific linker technology, broadening solid tumor applicability.
Investment gravitas now shifts toward adaptable constructs—bispecifics and trispecifics—that promise potent cytotoxicity with manageable toxicity. Gene therapy ambitions persist, yet manufacturing bottlenecks delay commercial scale. Cancer vaccines and oncolytic viruses remain in nascent rollout phases, often paired with checkpoint inhibitors to heighten immune response. Next-generation interleukins, such as ImmunityBio’s N-803, drive durable responses in niche indications, leveraging permanent reimbursement coding to accelerate uptake.


By Cancer Type: Hematologic Malignancies Surge Past Solid Tumors
Lung cancer maintained the largest revenue slice at 21.35% of the cancer biological therapy market share in 2024, supported by EGFR and ALK-targeted antibodies. Hematologic malignancies, however, are positioned to register a 10.36% CAGR to 2030 as CAR-T approvals proliferate across B-cell lymphoma, chronic lymphocytic leukemia, and multiple myeloma. Breast cancer’s steady trajectory hinges on HER2-directed ADCs, while melanoma benefits from dual checkpoint regimens. Prostate and colorectal segments face biosimilar pressure, yet novel PSMA-targeted constructs and CTLA-4 combinations sustain research pipelines.
Pipeline depth is most pronounced in blood cancers, where bispecific antibodies and allogeneic CAR-NK platforms aim to shorten manufacturing lead times and broaden eligibility. Solid tumor CAR-T programs tackle antigen heterogeneity and tumor microenvironment barriers, with University of Colorado’s ALA-CART early data demonstrating feasibility in refractory acute lymphocytic leukemia.
By End User: Specialized Treatment Centers Gain Ground
Hospitals and clinics absorbed 62.31% of 2024 revenue, benefiting from integrated care pathways and payer contracts. Dedicated cancer treatment centers are projected to expand at an 8.24% CAGR through 2030 as they refine CAR-T workflows and leverage point-of-care manufacturing. Academic institutes remain instrumental, running early-phase trials and translational research that feed commercialization pipelines.
Heightened safety oversight favors facilities with round-the-clock critical care teams experienced in CRS and ICANS mitigation. These centers shorten referral times and improve outcomes, prompting payers to recognize their value proposition. Tele-oncology extensions support follow-up care, enhancing patient retention.
By Route of Administration: Intratumoral Innovation Accelerates
Intravenous delivery retained 67.36% share in 2024, anchored by well-established infusion protocols. Intratumoral modalities are forecast to post a 9.72% CAGR as localized injections of oncolytic viruses and nanoparticle-conjugated antibodies reduce systemic exposure.
Subcutaneous formulations broaden out-patient administration, improving convenience and lowering infusion center congestion. Oral routes remain confined to small-molecule adjuncts, but sustained-release implants are in early trials aiming to decrease hospital visits.
Geography Analysis
North America controlled 33.57% of global revenue in 2024, buoyed by high per-capita spending, early adoption of novel biologics, and supportive reimbursement. The U.S. saw multiple accelerated approvals in 2025, reinforcing leadership. Canada’s pan-Canadian Pharmaceutical Alliance negotiates collective agreements, tempering launch prices yet sustaining access.
Europe follows with robust biosimilar penetration that moderates invoice prices without impeding uptake. The European Commission’s unified HTA framework, effective 2025, streamlines evidence reviews, cutting duplication among member states. Germany and France remain volume drivers, while Central and Eastern Europe narrow the gap through cross-border tendering.
Asia-Pacific is anticipated to chart an 8.41% CAGR to 2030, catalyzed by Japan’s regenerative medicine incentives and China’s expedited priority review channel. Chinese sites now represent 24% of global oncology trial locations, providing rich data and accelerating domestic approvals. South Korea and Singapore invest in viral vector capacity, aspiring to regional CDMO leadership.
Latin America faces dual headwinds of currency volatility and limited reimbursement. Nonetheless, Argentina and Brazil strengthen technology-transfer programs to localize biosimilar manufacture, enhancing affordability. The Middle East and Africa register nascent demand, yet Saudi Arabia’s embrace of ImmunityBio’s Cancer BioShield platform exemplifies growing interest in advanced immunotherapies.

Competitive Landscape
Industry structure balances scale advantages of large pharmas with innovation agility of biotechs. Market leaders diversify across modalities, reducing revenue risk from any single platform. Roche’s USD 1 billion Poseida deal adds gene editing CAR-T assets, while Johnson & Johnson’s USD 2 billion Ambrx purchase deepens ADC capabilities. Merck’s USD 1.3 billion CN201 acquisition underscores appetite for bispecific antibodies.
Collaborations proliferate as firms exploit complementary strengths: Bristol Myers Squibb and BioNTech co-develop a PD-1/VEGF bispecific, pairing clinical expertise with mRNA know-how. CDMOs race to expand vector capacity, competing on quality and regulatory track-record. Effective supply chains confer pricing power and shorten order lead times.
Biosimilar entrants intensify pressure in the mature monoclonal antibody segment, yet innovators protect margins via next-generation constructs and lifecycle extensions. Companies with differentiated safety management algorithms for CAR-T administration gain referral share from community oncologists seeking specialized centers.
Cancer Biological Therapy Industry Leaders
F. Hoffmann-La Roche Ltd.
Merck & Co., Inc.
Bristol-Myers Squibb Company
Novartis AG
Pfizer Inc.
- *Disclaimer: Major Players sorted in no particular order

Recent Industry Developments
- July 2025: FDA granted accelerated approval to sunvozertinib for EGFR exon 20 insertion metastatic NSCLC.
- July 2025: FDA granted accelerated approval to linvoseltamab-gcpt, a BCMA-directed bispecific, for heavily pretreated multiple myeloma.
- June 2025: FDA granted accelerated approval to datopotamab deruxtecan-dlnk for EGFR-mutated metastatic NSCLC after prior EGFR therapy and platinum chemotherapy.


Global Cancer Biological Therapy Market Report Scope
| Monoclonal Antibodies |
| Immune Checkpoint Inhibitors |
| Cytokines & Interleukins |
| CAR T-Cell Therapies |
| Cancer Vaccines |
| Oncolytic Virus Therapies |
| Gene Therapies |
| Antibody-Drug Conjugates |
| Adoptive Cell Transfer |
| Lung Cancer |
| Breast Cancer |
| Hematologic Malignancies |
| Melanoma |
| Prostate Cancer |
| Colorectal Cancer |
| Other Cancers |
| Hospitals & Clinics |
| Cancer Treatment Centers |
| Academic & Research Institutes |
| Intravenous |
| Subcutaneous |
| Oral |
| Intratumoral / Local |
| North America | United States |
| Canada | |
| Mexico | |
| Europe | Germany |
| United Kingdom | |
| France | |
| Italy | |
| Spain | |
| Rest of Europe | |
| Asia-Pacific | China |
| Japan | |
| India | |
| Australia | |
| South Korea | |
| Rest of Asia-Pacific | |
| Middle East and Africa | GCC |
| South Africa | |
| Rest of Middle East and Africa | |
| South America | Brazil |
| Argentina | |
| Rest of South America |
| By Therapy Type | Monoclonal Antibodies | |
| Immune Checkpoint Inhibitors | ||
| Cytokines & Interleukins | ||
| CAR T-Cell Therapies | ||
| Cancer Vaccines | ||
| Oncolytic Virus Therapies | ||
| Gene Therapies | ||
| Antibody-Drug Conjugates | ||
| Adoptive Cell Transfer | ||
| By Cancer Type | Lung Cancer | |
| Breast Cancer | ||
| Hematologic Malignancies | ||
| Melanoma | ||
| Prostate Cancer | ||
| Colorectal Cancer | ||
| Other Cancers | ||
| By End User | Hospitals & Clinics | |
| Cancer Treatment Centers | ||
| Academic & Research Institutes | ||
| By Route of Administration | Intravenous | |
| Subcutaneous | ||
| Oral | ||
| Intratumoral / Local | ||
| By Geography | North America | United States |
| Canada | ||
| Mexico | ||
| Europe | Germany | |
| United Kingdom | ||
| France | ||
| Italy | ||
| Spain | ||
| Rest of Europe | ||
| Asia-Pacific | China | |
| Japan | ||
| India | ||
| Australia | ||
| South Korea | ||
| Rest of Asia-Pacific | ||
| Middle East and Africa | GCC | |
| South Africa | ||
| Rest of Middle East and Africa | ||
| South America | Brazil | |
| Argentina | ||
| Rest of South America | ||


Key Questions Answered in the Report
How large is the cancer biological therapy market in 2025?
It reached USD 128.67 billion and is projected to climb to USD 177.26 billion by 2030, reflecting a 6.62% CAGR.
Which therapy type holds the highest revenue share?
Monoclonal antibodies led with 68.24% of 2024 global revenue.
What segment is expanding the fastest?
CAR-T therapies are forecast to post a 9.37% CAGR through 2030, especially in hematologic cancers.
Which region is growing the quickest?
Asia-Pacific is expected to register an 8.41% CAGR, propelled by regulatory modernization and manufacturing investment.
What is a key barrier to broader adoption?
High treatment costs and inconsistent reimbursement hinder patient access, particularly in emerging markets.
Page last updated on:


