Breast Cancer Therapeutics Market Size and Share
Market Overview
| Study Period | 2020 - 2031 |
|---|---|
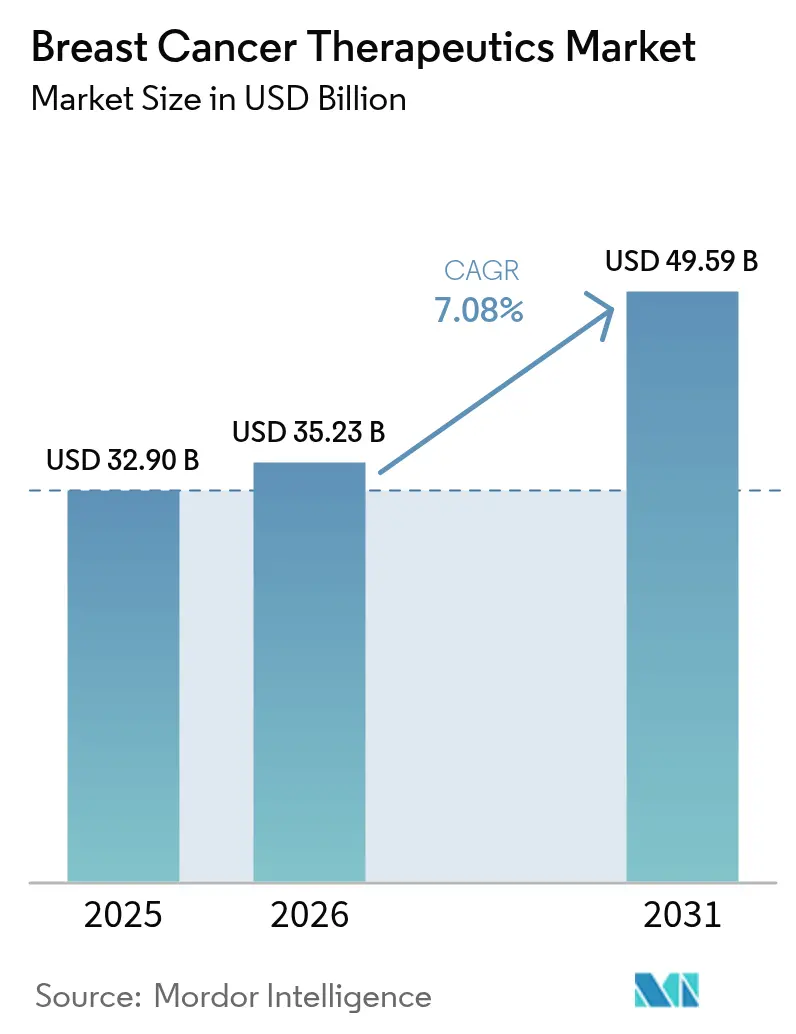
| Market Size (2026) | USD 35.23 Billion |
| Market Size (2031) | USD 49.59 Billion |
| Growth Rate (2026 - 2031) | 7.08% CAGR |
| Fastest Growing Market | Asia-Pacific |
| Largest Market | North America |
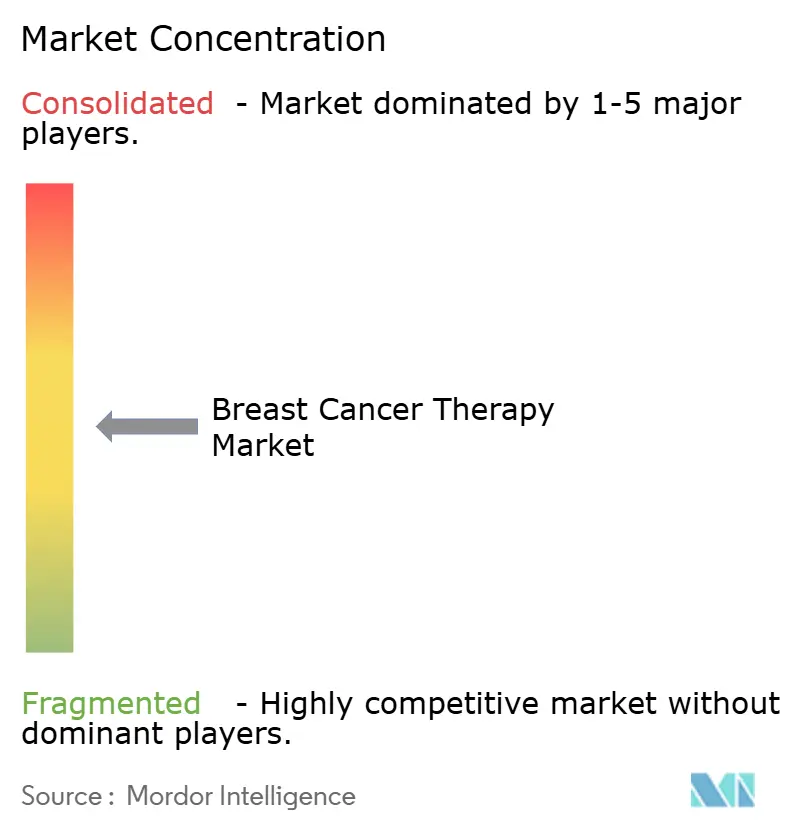
| Market Concentration | Medium |
Major Players*Disclaimer: Major Players sorted in no particular order Image © Mordor Intelligence. Reuse requires attribution under CC BY 4.0. | |
Breast Cancer Therapeutics Market Analysis by Mordor Intelligence
Breast cancer therapeutics market size in 2026 is estimated at USD 35.23 billion, growing from 2025 value of USD 32.90 billion with 2031 projections showing USD 49.59 billion, growing at 7.08% CAGR over 2026-2031. Consistent incidence growth, accelerated regulatory approvals, and the rapid uptake of antibody–drug conjugates (ADCs) are underpinning sustained demand. The rising use of biomarker-guided treatment, earlier adoption of CDK4/6 inhibitors, and payer acceptance of premium-priced targeted agents are widening the revenue base. Immunotherapy combinations are broadening treatment algorithms, while subcutaneous formulations and e-commerce channels are reshaping care delivery. Despite capacity limits for high-potency payloads and complex multi-regional approvals, substantial R&D investment and AI-enabled discovery pipelines continue to reinforce the long-term outlook of the breast cancer therapeutics market.
Key Report Takeaways
- By therapy, targeted agents held 62.45% of the breast cancer therapeutics market share in 2025, whereas immunotherapy is projected to grow at a 13.95% CAGR through 2031.
- By molecular subtype, HR+/HER2- disease accounted for 64.78% revenue in 2025; triple-negative breast cancer is set to expand at a 12.08% CAGR to 2031.
- By disease stage, metastatic/advanced settings generated 54.15% of 2025 revenue, while early/adjuvant therapy is rising at a 10.44% CAGR.
- By route of administration, subcutaneous delivery is projected to advance at an 11.35% CAGR between 2026 and 2031.
- By geography, North America led with a 38.05% market share in 2025; the Asia-Pacific region is forecast to post a 11.85% CAGR through 2031.
Note: Market size and forecast figures in this report are generated using Mordor Intelligence’s proprietary estimation framework, updated with the latest available data and insights as of 2026.
Global Breast Cancer Therapeutics Market Trends and Insights
Drivers Impact Analysis*
| Driver | (~) % Impact on CAGR Forecast | Geographic Relevance | Impact Timeline |
|---|---|---|---|
| High Incidence & Prevalence Of Breast Cancer | +1.8% | Global, with highest impact in Asia-Pacific and Latin America | Long term (≥ 4 years) |
| Rising R&D Spending And Oncology Deal-Making | +1.5% | North America & EU, spill-over to APAC | Medium term (2-4 years) |
| Rapid Uptake Of HER2 / CDK4-6 Targeted Agents | +2.1% | Global, led by developed markets | Short term (≤ 2 years) |
| Growing Access To Screening In Emerging Economies | +1.2% | APAC core, spill-over to MEA and Latin America | Long term (≥ 4 years) |
| AI-Enabled Biomarker Discovery Fast-Tracking Pipelines | +0.9% | North America & EU, early adoption in select APAC markets | Medium term (2-4 years) |
| Source: Mordor Intelligence | |||
High Incidence & Prevalence of Breast Cancer
Breast cancer ranks as the most frequently diagnosed malignancy worldwide, driving enduring demand for therapeutics. Population ageing and lifestyle shifts are accelerating incidence, particularly in Asia-Pacific markets where urbanisation trends are evident. The MENA region expects a 50% rise in cancer cases by 2040, with breast cancer leading the increase. Earlier detection and improved survival elevate the prevalent patient pool, ensuring persistent growth for the breast cancer therapeutics market as healthcare systems move from reactive to proactive models.
Rising R&D Spending and Oncology Deal-Making
Record oncology investment is fuelling accelerated trials and premium valuations for differentiated mechanisms. Examples include Sanofi’s acquisition of Orano Med and Eli Lilly’s purchase of Radionetics, both aimed at securing next-generation radioligand capabilities. These deals shorten timelines for smaller biotechs and create a cycle where successful launches finance further pipeline expansion, boosting the breast cancer therapeutics market.
Rapid Uptake of HER2/CDK4-6 Targeted Agents
Trastuzumab deruxtecan’s success in HER2-low disease effectively doubles the addressable population [1]Ian Tannock, “Trastuzumab Deruxtecan after Endocrine Therapy in Metastatic Breast Cancer,” New England Journal of Medicine, nejm.org. Ribociclib’s adjuvant approval following the NATALEE study increases early-stage utilisation. Substantial survival gains justify premium prices, accelerating adoption across various care settings and driving growth in the breast cancer therapeutics market.
Growing Access to Screening in Emerging Economies
Government programmes in India and China are scaling mammography availability, shifting diagnosis toward earlier stages, and stimulating demand for adjuvant therapies. AI-driven tools such as CLAIRITY BREAST make risk prediction feasible in routine practice. Earlier detection lengthens treatment duration, strengthening revenue streams for the breast cancer therapeutics market.
Restraints Impact Analysis*
| Restraint | (~) % Impact on CAGR Forecast | Geographic Relevance | Impact Timeline |
|---|---|---|---|
| Adverse Effects & Toxicity Management Costs | -1.4% | Global, with higher impact in cost-sensitive markets | Short term (≤ 2 years) |
| Stringent Multi-Regional Regulatory Timelines | -0.8% | Global, particularly affecting emerging market access | Medium term (2-4 years) |
| Scarcity Of High-Potency ADC Payload Manufacturing | -1.1% | Global, with supply constraints affecting all regions | Short term (≤ 2 years) |
| Source: Mordor Intelligence | |||
Adverse Effects & Toxicity Management Costs
Complex regimens, such as ADCs, require intensive monitoring and supportive care, which can sometimes double the total treatment expense. FDA’s Project Optimus underscores the need for dose optimisation. Limited supportive infrastructure in lower-income settings dampens uptake, constraining the breast cancer therapeutics market.
Stringent Multi-Regional Regulatory Timelines
Approval lags of 3-4 years persist between first-in-class authorisation and emerging-market access, as observed in Morocco. Distinct country standards increase cost and delay revenue recognition, capping the growth potential of the breast cancer therapeutics market.
*Our forecasts treat driver/restraint impacts as directional, not additive. The impact forecasts reflect baseline growth, mix effects, and variable interactions.
Segment Analysis
By Therapy: Targeted Agents Cement Leadership
Targeted therapies generated 62.45% of 2025 revenue, underscoring their central role in the breast cancer therapeutics market. Trastuzumab deruxtecan’s expansion into HER2-low disease and inavolisib’s activity in PIK3CA-mutated tumours enlarge eligible cohorts. Immunotherapy, the fastest-growing segment with a 13.95% CAGR, is driven by checkpoint inhibitor-ADC combinations in triple-negative disease. Hormonal approaches remain relevant in HR-positive populations, whereas chemotherapy volumes decrease as tolerability improves with newer treatment modalities. Radiation therapy adoption persists in adjuvant settings, bolstered by advancements such as stereotactic body radiation techniques that minimize exposure and reduce the number of visits. Combination regimens blending modalities are reshaping practice patterns and encouraging the development of companion diagnostics.
Targeted agents are increasingly moving into earlier lines of care, and their superior risk–benefit profile supports continued reimbursement in price-sensitive systems. Developers are leveraging AI to refine patient selection, further improving efficacy signals. The breast cancer therapeutics market size for targeted modalities is projected to rise steadily, reflecting robust pipelines and sustained investment.


By Molecular Subtype: TNBC Accelerates
HR+/HER2- disease accounted for 64.78% of 2025 spending in the breast cancer therapeutics market. Nonetheless, TNBC is expanding at a 12.08% CAGR, lifted by sacituzumab govitecan and follow-on TROP2 ADCs. HER2-positive disease retains momentum as trastuzumab deruxtecan extends to ultralow expression cohorts. The delineation of quadruple-negative subsets through molecular profiling signals further stratifies the disease.
Clinical data have shifted the perception of TNBC from an orphan subset to a high-value opportunity. Success breeds additional investment in antibody engineering, bispecific constructs, and novel payloads. As biomarker testing becomes routine, developers will tune trial designs, supporting persistent share gains for TNBC therapies within the breast cancer therapeutics market.
By Disease Stage: Early Intervention Surges
Metastatic disease represented 54.15% of 2025 revenue. Early/adjuvant therapy, however, is climbing at a 10.44% CAGR as ribociclib and other agents prove efficacy before recurrence. Biomarker-guided neoadjuvant regimens push pathologic complete response rates higher, influencing regulatory endpoints.
The stage migration trend expands the breast cancer therapeutics market size at earlier points in the patient journey. Up-front therapy can avert later high-cost lines, shifting value from palliation to cure. Manufacturers that demonstrate long-term survival in adjuvant trials stand to capture significant, durable revenue streams.
By Route of Administration: Convenience Gains Ground
Intravenous products accounted for 49.05% of 2025 turnover. Subcutaneous delivery is projected to expand at an 11.35% CAGR as reformulations reduce chair time and facilitate home administration. Oral targeted therapies also progress, reflecting favourable pharmacokinetics and patient acceptance.
COVID-19 normalised remote care models, reinforcing demand for convenient routes. Payors view at-home options as cost-saving, while patients prefer fewer visits. The breast cancer therapeutics market will reward companies capable of transforming IV biologics into subcutaneous or oral formats without sacrificing efficacy.

By Distribution Channel: Digital Access Expands
Hospital pharmacies retained 64.60% of sales in 2025. Yet e-commerce is growing 12.05% annually, catalysed by specialty platforms that couple dispensing with digital adherence support. Retail and specialty pharmacies bridge education gaps for oral regimens, while direct-to-patient delivery strengthens manufacturer–patient links.
The channel shift accelerates data capture, generating real-world evidence critical for value-based contracting. Participants in the breast cancer therapeutics market that integrate digital health services into distribution will gain competitive advantage.
Geography Analysis
North America contributed 38.05% of 2025 revenue to the breast cancer therapeutics market, reflecting rapid uptake of novel agents and broad insurance coverage. FDA initiatives such as Project Optimus influence global dosing standards. Biosimilar penetration, notably trastuzumab follow-ons, is curbing spend growth but widening access.
Asia-Pacific is forecast to grow at 11.85% CAGR, making it the prime expansion engine for the breast cancer therapeutics market. Health-system investment, broader screening, and rising disposable incomes propel volumes in China and India. Japan demonstrates effective biosimilar incentives that drive adoption, while South Korea and Australia act as innovation test beds.
Europe’s multi-payer environment tempers pricing but remains sizeable. Health technology assessment requirements elevate the importance of long-term outcomes data. Eastern European modernisation offers incremental upside. The Middle East and Africa lag in access, yet national cancer plans in Saudi Arabia signal improving availability. South America exhibits a mixed performance; Brazil leads the uptake, whereas smaller economies struggle with affordability issues.


Competitive Landscape
The breast cancer therapeutics market is moderately consolidated. Novartis leverages ribociclib’s adjuvant approval to defend its share in HR-positive disease. AstraZeneca and Daiichi Sankyo continue to expand the indications for trastuzumab deruxtecan, setting a high clinical bar.
ADC development dominates strategic roadmaps, prompting alliances such as Sanofi–Orano Med and Eli Lilly–Radionetics. AI-enabled platforms like CLAIRITY BREAST illustrate how diagnostic technology augments therapy portfolios. Biosimilar incumbents, including Samsung Bioepis and Celltrion, pursue price-volume plays that free payer budgets for next-generation drugs.
Manufacturing scalability for cytotoxic payloads is emerging as a competitive differentiator. Companies that invest in dedicated facilities mitigate supply risk and ensure launch readiness. Meanwhile, digital health partnerships help firms extend beyond the pill, improving adherence and generating actionable data for reimbursement negotiations.
Breast Cancer Therapeutics Industry Leaders
Novartis AG
Merck Co & Inc.
Fresenius Kabi
Pfizer Inc.
Eli Lilly & Co.
- *Disclaimer: Major Players sorted in no particular order

Recent Industry Developments
- May 2025: Merck reported that KEYTRUDA plus Trodelvy cut progression risk by 35% versus KEYTRUDA plus chemotherapy in first-line PD-L1+ metastatic TNBC.
- January 2025: FDA approved trastuzumab deruxtecan for HER2-low and ultralow disease, broadening the treatment base.


Research Methodology Framework and Report Scope
Market Definitions and Key Coverage
Our study defines the breast cancer therapeutics market as all prescription medicines, antibody-drug conjugates, cell-based immunotherapies, and supportive hormonal agents that are administered for curative or palliative management of malignant breast tumors across adjuvant, neoadjuvant, and metastatic settings. Radiation equipment and surgical procedures are not counted within revenue. Coverage spans branded and approved biosimilar products that generate manufacturer sales in 17 countries.
Scope Exclusions: Over-the-counter symptom relievers, diagnostic imaging, gene-testing kits, and non-oncology off-label drug sales are excluded.
Segmentation Overview
- By Therapy
- Radiation Therapy
- Hormonal Therapy
- Chemotherapy
- Targeted Therapy
- Immunotherapy
- By Molecular Subtype
- HR+ / HER2-
- HER2+
- Triple-Negative (TNBC)
- Quadruple-Negative (QNBC)
- By Disease Stage
- Early / Adjuvant
- Metastatic / Advanced
- By Route of Administration
- Intravenous
- Sub-cutaneous
- Oral
- By Distribution Channel
- Hospital Pharmacies
- Retail & Specialty Pharmacies
- E-commerce
- Geography
- North America
- United States
- Canada
- Mexico
- Europe
- Germany
- United Kingdom
- France
- Italy
- Spain
- Rest of Europe
- Asia-Pacific
- China
- Japan
- India
- South Korea
- Australia
- Rest of Asia-Pacific
- Middle East and Africa
- GCC
- South Africa
- Rest of Middle East and Africa
- South America
- Brazil
- Argentina
- Rest of South America
- North America
Detailed Research Methodology and Data Validation
Primary Research
Mordor analysts interview medical oncologists, hospital pharmacists, and payor advisors across North America, Europe, Asia-Pacific, and key emerging economies. These conversations validate dosage mix assumptions, therapy-cycle lengths, patient adherence, and upcoming formulary shifts that are not visible in published data.
Desk Research
We begin with a structured scan of public domain data from bodies such as the World Health Organization, GLOBOCAN, the U.S. SEER program, Eurostat, and national health ministries, which quantify incidence, prevalence, and mortality. Regulatory action logs from the US FDA and the European Medicines Agency signal launch timing and label expansions that shift treated patient pools. Company 10-Ks, investor decks, and selected articles in journals like The Lancet Oncology shed light on product pricing, patent cliffs, and clinical adoption. Subscription databases, including D&B Hoovers for corporate revenue splits and Dow Jones Factiva for supply chain news, enrich market share estimates. The sources named are illustrative; numerous additional materials were consulted to cross-check figures and narrative flows.
Market-Sizing & Forecasting
A top-down model starts by reconstructing the treated patient universe from incidence, stage distribution, treatment eligibility, and line-of-therapy penetration. Average selling price benchmarks are then applied to estimate revenues. Results are corroborated through selective bottom-up checks such as supplier roll-ups for leading biologics and sampled hospital invoice data to fine-tune unit volumes. Variables monitored include HER2-positive incidence share, uptake rates of CDK4/6 inhibitors, antibody-drug conjugate launch cadence, average therapy-cycle cost inflation, reimbursement policy changes, and survival-driven duration of treatment. Multivariate regression with scenario analysis projects each driver through the forecast period, while gaps in bottom-up evidence are bridged by weighted regional analogs reviewed with domain experts.
Data Validation & Update Cycle
Outputs pass variance testing against historical sales, peer benchmarks, and epidemiology. Senior reviewers re-run anomaly flags before sign-off, and we refresh the dataset annually, issuing interim updates when a material approval or safety signal alters forecast logic. A final pre-publication sweep ensures clients receive the most current view.
Why Mordor's Breast Cancer Therapy Baseline Earns Trust
Published estimates frequently diverge because firms slice the market by different drug classes, convert currencies on varied dates, or bake unvetted uptake curves into forecasts.
Our disciplined scope selection, patient-flow logic, annual refresh, and controlled ASP mapping make Mordor's number the dependable starting point for decision makers.
Benchmark comparison
| Market Size | Anonymized source | Primary gap driver |
|---|---|---|
| USD 32.90 B (2025) | Mordor Intelligence | - |
| USD 31.50 B (2024) | Global Consultancy A | excludes biosimilars; uses static ASP assumption |
| USD 37.75 B (2024) | Industry Portal B | counts surgery and radiation revenues inside drug market |
| USD 31.16 B (2024) | Regional Consultancy C | models only ten countries, then applies blanket uplift |
Differences stem mainly from scope creep, geographic shortcuts, or price curves applied without fresh expert validation.
By anchoring estimates in transparent patient mathematics and timely primary insights, Mordor Intelligence delivers a balanced, reproducible baseline that clients can trace and stress-test with confidence.


Key Questions Answered in the Report
What is the current value of the breast cancer therapeutics market?
The market generated USD 35.23 billion in 2026 and is forecast to reach USD 49.59 billion by 2031.
Which therapy type holds the largest share?
Targeted agents dominate, accounting for 62.45% of 2025 revenue.
Why is Asia-Pacific the fastest-growing region?
Healthcare infrastructure investment, wider screening and rising incomes are driving a 11.85% CAGR through 2031 in Asia-Pacific.
What is driving growth in triple-negative breast cancer treatments?
Breakthrough TROP2-targeted ADCs such as sacituzumab govitecan are improving outcomes, supporting a 12.08% CAGR for TNBC therapies.
How are subcutaneous formulations influencing the market?
Patient preference for convenience and payer interest in reduced infusion costs are propelling subcutaneous products at an 11.35% CAGR.
Page last updated on:


