Europe Cancer Therapy Market Size and Share
Market Overview
| Study Period | 2020 - 2031 |
|---|---|
| Forecast Data Period | 2026 - 2031 |
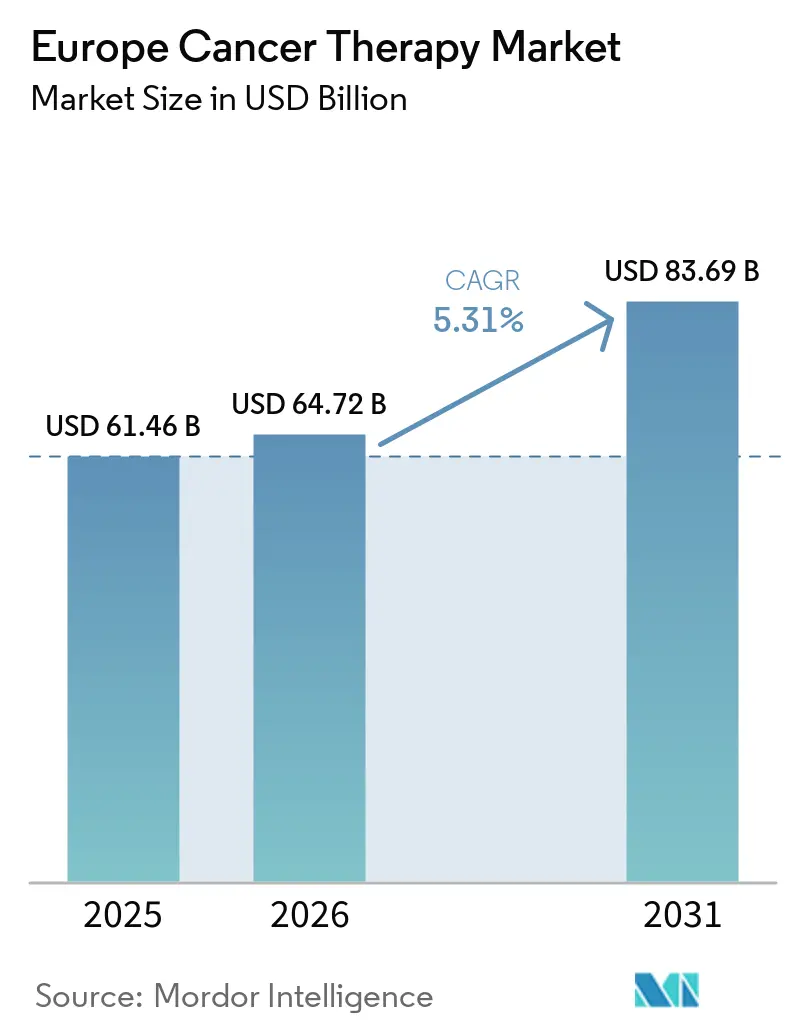
| Base Year Market Size (2025) | USD 61.46 Billion |
| Market Size (2026) | USD 64.72 Billion |
| Market Size (2031) | USD 83.69 Billion |
| Growth Rate (2026 - 2031) | 5.31% CAGR |
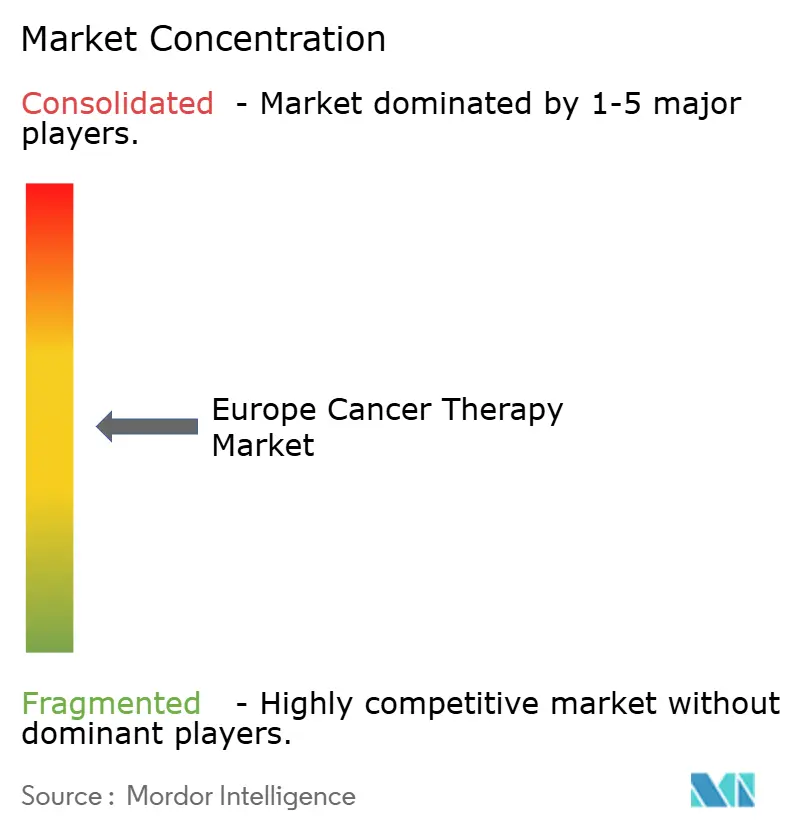
| Market Concentration | Medium |
Major Players *Disclaimer: Major Players sorted in no particular order Image © Mordor Intelligence. Reuse requires attribution under CC BY 4.0. | |
Europe Cancer Therapy Market Analysis by Mordor Intelligence
The Europe Cancer Therapy Market size is projected to expand from USD 61.46 billion in 2025 and USD 64.72 billion in 2026 to USD 83.69 billion by 2031, registering a CAGR of 5.31% between 2026 to 2031.
This steady trajectory reflects regulatory harmonization by the European Medicines Agency (EMA), the expansion of precision medicine under the EU Beating Cancer Plan, and sustained R&D investment in leading economies, such as Germany and France. Intensifying competition centers on antibody-drug conjugates and radioligand therapies, while the uptake of biosimilars accelerates cost containment efforts across public health systems.[1]European Federation of Pharmaceutical Industries and Associations, “Cancer-care indicators,” efpia.eu Pipeline momentum favors biomarker-selected treatments and immuno-oncology regimens, while legacy chemotherapy regimens are losing share to precision approaches. Uptake of biosimilar monoclonal antibodies is freeing budget headroom for novel agents, and fast-track regulatory pathways are compressing the time between EMA approval and market entry. Cross-border cell-therapy manufacturing hubs in Benelux have shortened vein-to-infusion logistics, accelerating access to CAR-T options. Venture capital is flocking to radioligand startups, and the rollout of AI-enabled trial-matching platforms is reducing recruitment timelines, collectively reinforcing steady growth in the Europe cancer therapy market.
Key Report Takeaways
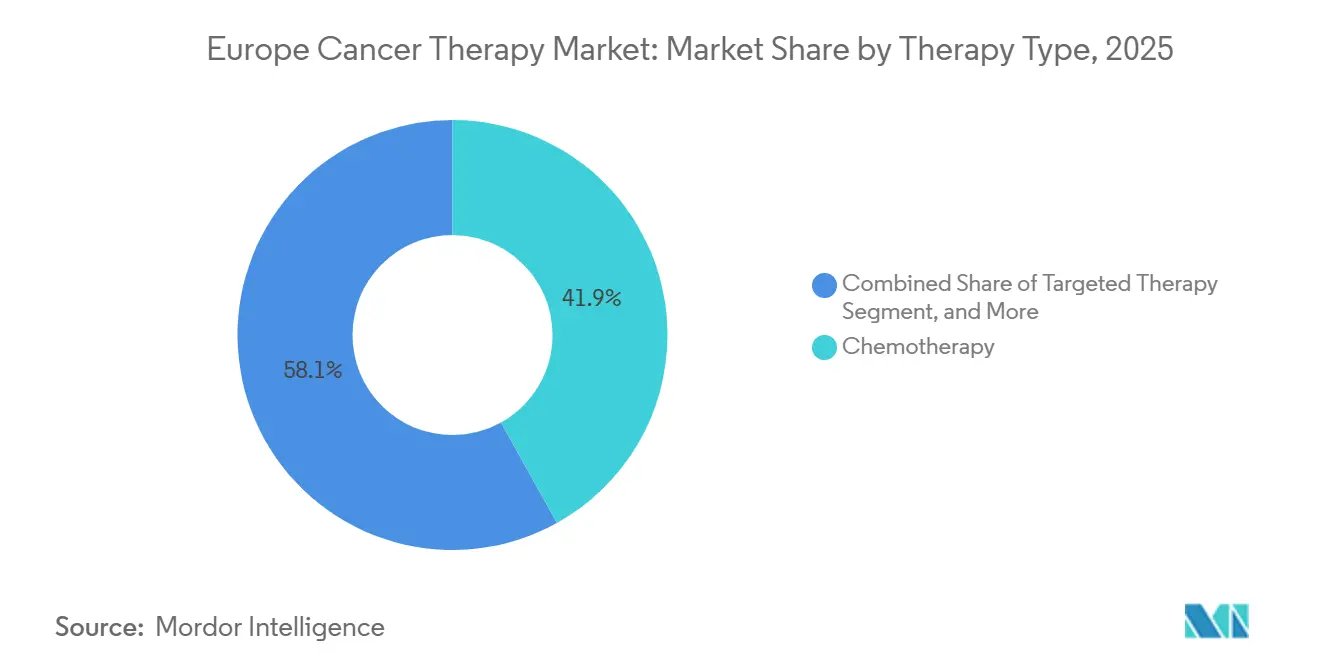
- By therapy type, chemotherapy led with 41.92% Europe cancer therapy market share in 2025, and targeted therapy is projected to register the fastest 6.14% CAGR through 2031.
- By cancer type, breast cancer accounted for 25.12% of the Europe cancer therapy market size in 2025, and lung cancer therapies are forecast to post the highest 6.77% CAGR to 2031.
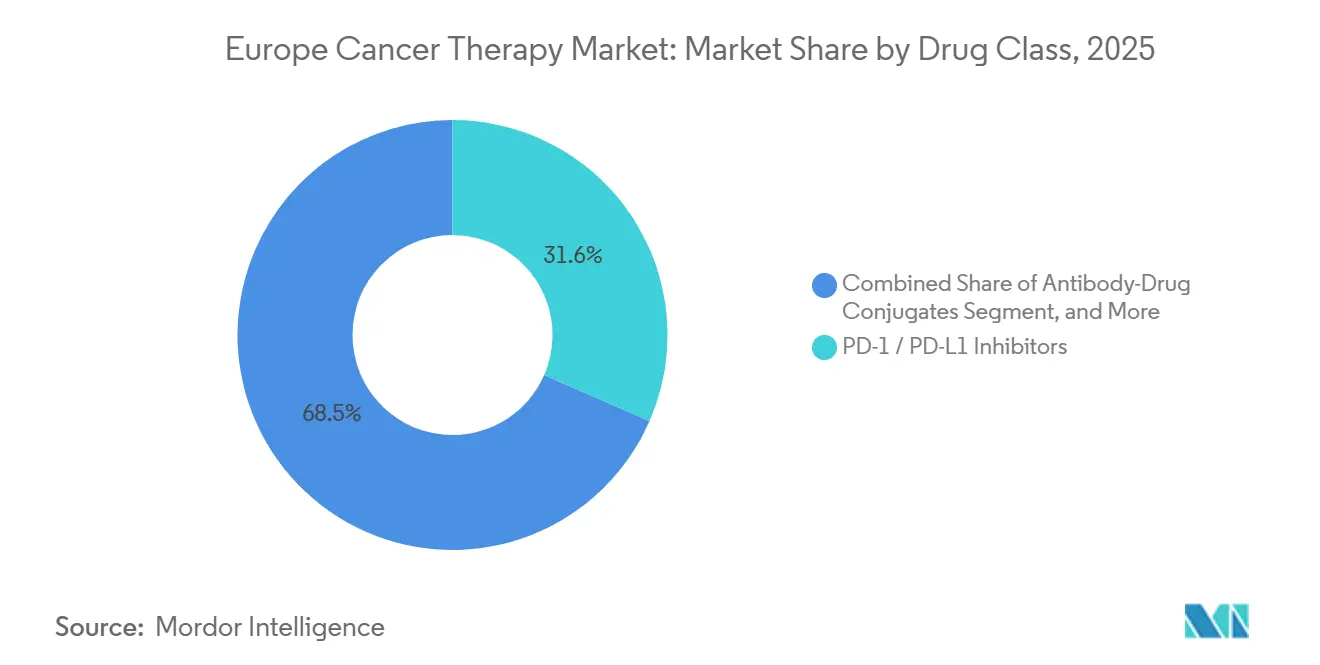
- By drug class, PD-1/PD-L1 inhibitors held 31.55% Europe cancer therapy market share in 2025, and antibody-drug conjugates are advancing at a 7.05% CAGR over 2026-2031.
- By mode of administration, intravenous delivery captured 68.20% of the Europe cancer therapy market share in 2025, and Subcutaneous formulations are the fastest-growing route, expanding at a 6.99% CAGR through 2031.
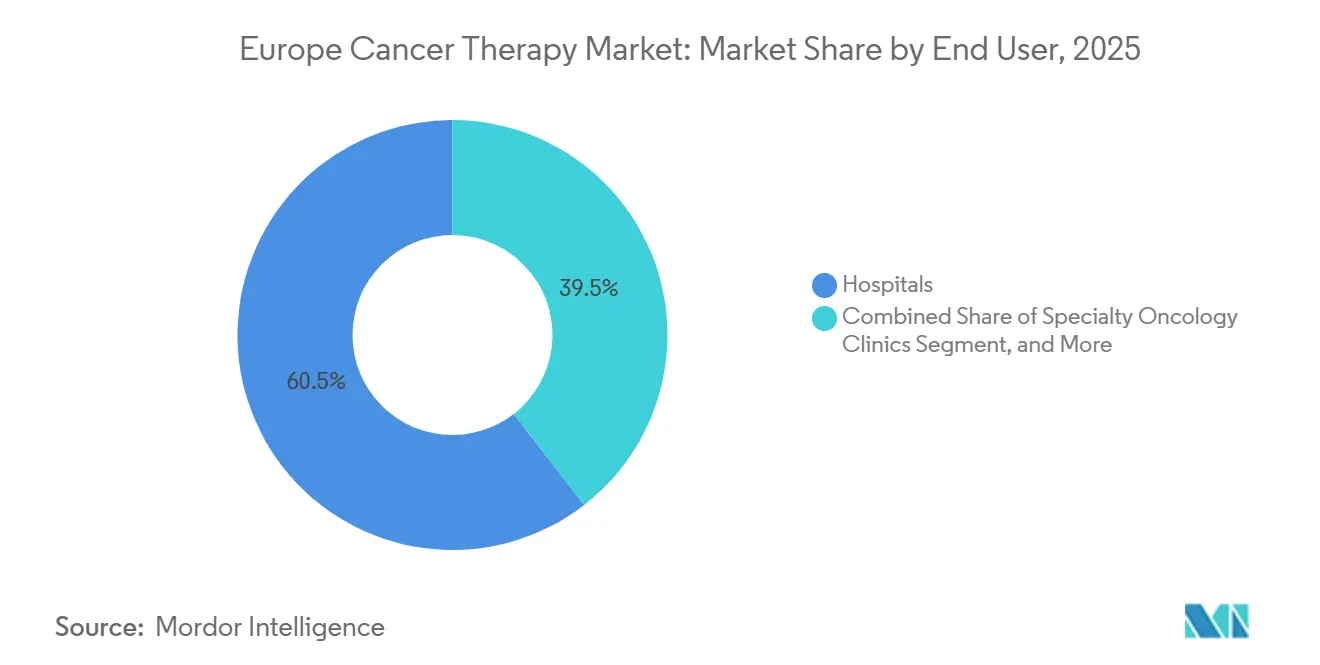
- By end user, hospitals accounted for 60.50% of the Europe cancer therapy market in 2025. Specialty oncology clinics are growing at a 6.87% CAGR from 2026 to 2031.
- By country, Germany captured 28.05% of the Europe cancer therapy market share in 2025, and France is projected to deliver the fastest 8.45% CAGR through 2031.
Note: Market size and forecast figures in this report are generated using Mordor Intelligence’s proprietary estimation framework, updated with the latest available data and insights as of 2026.
Europe Cancer Therapy Market Trends and Insights
Drivers Impact Analysis*
| DRIVER | (~) % IMPACT ON CAGR FORECAST | GEOGRAPHIC RELEVANCE | IMPACT TIMELINE |
|---|---|---|---|
| Precision-oncology drug approvals surge post-EMA reforms | 1.2% | Global, with early uptake in Germany, France, Netherlands | Medium term (2–4 years) |
| Biosimilar oncology uptake lowering therapy costs | 0.9% | EU-5 core, accelerating in Spain and Italy | Short term (≤2 years) |
| Genomic screening roll-outs in EU27 national cancer plans | 0.7% | France, Germany, Nordic countries; pilot programs in Poland, Czech Republic | Long term (≥4 years) |
| Venture-capital boom for radioligand start-ups | 0.6% | Germany, Belgium, Switzerland; spill-over to UK post-Brexit regulatory alignment | Medium term (2–4 years) |
| AI-driven trial-matching platforms shorten recruitment | 0.5% | UK, France, Germany; emerging in Southern Europe | Medium term (2–4 years) |
| Cross-border CAR-T manufacturing hubs in benelux | 0.4% | Benelux core, serving broader EU-27 | Short term (≤2 years) |
| Source: Mordor Intelligence | |||
Precision-Oncology Drug Approvals Surge Post-EMA Reforms
Streamlined adaptive-licensing pathways now close EMA review cycles in roughly 12 months, enabling 28 oncology approvals in 2024 and sustaining double-digit growth in 1H 2025. First-in-class agents for KRAS G12C, FGFR, and HER2-low indications cleared evaluation within 10 months, and linked companion diagnostics were reimbursed under conditional-coverage rules in Germany and France, fostering rapid clinical adoption. Joint HTA assessments published by EUnetHTA are supporting smaller markets without oncology units, thereby helping to reduce access disparities. As real-world evidence matures, pricing tiers are increasingly tied to post-launch outcomes, anchoring durable growth in the European cancer therapy market.
Biosimilar Oncology Uptake Lowering Therapy Costs
Volume penetration for trastuzumab, bevacizumab, and rituximab biosimilars reached 41% across Germany, the UK, and the Netherlands by December 2024, generating cumulative system savings of EUR 56 billion. France’s January 2025 substitution mandate compels pharmacists to dispense the least-cost biologic, an initiative forecast to save EUR 1.2 billion annually by 2027. Spain’s gain-sharing model splits procurement savings with providers to fund CAR-T and radioligand access. The European Commission aims for 60% biosimilar penetration by 2030, adding further downward pressure on mature segments while liberating budgets for innovative classes.
Genomic Screening Roll-Outs in EU27 Cancer Plans
National genomic-medicine strategies in France and Germany mandate broad tumor profiling, scaling to 235,000 annual assays by 2027. Nordic registries integrate genomic data into national quality databases, providing real-world endpoints to support adaptive reimbursement. Early pilot programs in Poland and the Czech Republic are training pathologists and bioinformaticians, extending the benefits of precision oncology to Central Europe. As testing volumes rise, companion diagnostic throughput will improve treatment matching and accelerate uptake of targeted regimens across the Europe cancer therapy market.
Venture-Capital Boom for Radioligand Start-Ups
Investors injected EUR 622 million into 11 European radioligand companies over 2024-2025. ITM’s EUR 188 million Series C is scaling actinium-225 and lead-212 supply, while PanTera’s EUR 134 million Series B advances thorium-227 programs. Sanofi and Orano Med earmarked EUR 300 million to build a lead-212 facility, and EMA draft guidance on alpha-emitter dosing signals regulatory tailwinds. These funds are accelerating pipeline readouts and facility build-outs, positioning radioligands as a high-growth pillar of the Europe cancer therapy industry.
Restraints Impact Analysis*
| RESTRAINT | (~) % IMPACT ON CAGR FORECAST | GEOGRAPHIC RELEVANCE | IMPACT TIMELINE |
|---|---|---|---|
| Divergent HTA reimbursement timelines across EU-5 | -0.8% | Germany, France, UK, Italy, Spain; spillover to smaller markets | Medium term (2–4 years) |
| Hospital capacity gap for nuclear-medicine therapies | -0.5% | Southern Europe, CEE; isolated constraints in UK | Long term (≥4 years) |
| Oncology workforce shortages in CEE nations | -0.6% | Poland, Czech Republic, Hungary, Romania; emerging in Baltic states | Long term (≥4 years) |
| Supply-chain risk for critical API imports | -0.4% | EU-27 global, acute in generic cytotoxics | Short term (≤2 years) |
| Source: Mordor Intelligence | |||
Divergent HTA Reimbursement Timelines Across EU-5
The W.A.I.T. (Waiting to Access Innovative Therapies) indicator survey shows an average 531-day lag between EMA approval and patient availability across the five largest markets, reflecting heterogeneous evidence and pricing requirements. While the 2025 Joint Clinical Assessment regulation aims to align methodologies, transitional frictions may widen gaps as national agencies recalibrate their value frameworks. Germany’s AMNOG process releases provisional payments 90 days after EMA approval, whereas Italy typically takes 18-24 months before formulary listing. France offers early Autorisation Temporaire d’Utilisation use, yet budget constraints hold full reimbursement until HTA completion. The UK Cancer Drugs Fund now conditions access on 12-month outcomes, extending timelines to 11 months. Spain’s autonomous regions create additional intra-country variation, adding approximately EUR 12 million in administrative costs per launch and fragmenting strategies for companies in the Europe cancer therapy market.
Hospital Capacity Gap for Nuclear-Medicine Therapies
Southern and Central-Eastern Europe face shortages of shielded suites and trained radiopharmacists required for alpha-emitter treatments. Workforce deficits in radiation oncology, particularly in Hungary and Romania, extend wait times to twice the EU median. Although the European Commission’s Cancer Mission earmarked EUR 47 million for workforce programs, incremental staffing will take years to materialize, capping radioligand uptake in underserved regions.
*Our forecasts treat driver/restraint impacts as directional, not additive. The impact forecasts reflect baseline growth, mix effects, and variable interactions.
Segment Analysis
By Therapy Type: Targeted Agents Erode Chemotherapy Dominance
Chemotherapy retained a 41.92% share of the Europe cancer therapy market size in 2025, reflecting its entrenched role in combination regimens. Yet targeted therapy is forecast to post a 6.14% CAGR, propelled by HER2-low breast cancer approvals and next-generation EGFR inhibitors that extend progression-free intervals. A maturing immunotherapy backbone is increasingly paired with precision inhibitors, enabling deeper responses across various tumor types and elevating biomarker testing rates.
Increasing clinical trial density underscores a strategic emphasis on tumor-agnostic indications, with basket study designs compressing development cycles. Biosimilar erosion in traditional cytotoxics accelerates revenue migration toward precision platforms, prompting legacy manufacturers to replenish pipelines via licensing or bolt-on acquisitions. The shift also reorients hospital formularies toward outpatient administration, reinforcing payer preference for cost-effective, biomarker-guided protocols.


By Cancer Type: Lung Cancer Therapies Outpace Breast Cancer Growth
Breast cancer dominated the Europe cancer therapy market, accounting for a 25.12% share in 2025, driven by established screening programs and well-established treatment algorithms. However, lung cancer is slated for the fastest 6.77% CAGR through 2031 as first-line immunotherapy combinations and exon-20 insertion inhibitors unlock previously refractory segments.
Tighter environmental policies on smoking and air-quality metrics may gradually reduce incidence. Yet the rapid adoption of molecular diagnostics broadens the eligible patient pool for targeted regimens in the near term. Pharmaceutical companies thus prioritize portfolio depth across genomic subsets, balancing blockbuster volume in hormone-positive breast cancer with high-growth revenue in niche lung-cancer mutations.
By Drug Class: Antibody-Drug Conjugates Lead Innovation Wave
PD-1/PD-L1 inhibitors captured 31.55% of 2025 revenue, cementing immune-checkpoint blockade as a multimodal backbone. Antibody-drug conjugates now lead the growth league with a 7.05% CAGR, reflecting advances in linker-payload technology that widen therapeutic windows. Enhanced potency has spurred label expansion into earlier lines, while competitive differentiation revolves around site-specific conjugation and bystander-kill payloads.
Meanwhile, tyrosine kinase inhibitors are transitioning to fourth-generation agents that overcome solvent-front mutations, and CDK4/6 inhibitors are moving into adjuvant settings. Pipeline clustering amplifies deal-making for proprietary conjugation platforms, with out-licensing models offering capital-efficient entry for mid-cap firms seeking to gain exposure to the rapidly scaling ADC arena.
By Mode of Administration: Subcutaneous Formulations Gain Traction
Intravenous infusion maintained a 68.20% share in 2025; however, subcutaneous formulations are projected to expand at a 6.99% CAGR through 2031 as health systems champion home-based care. On-body injectors for monoclonal antibodies reduce chair time and free oncology-day-unit capacity, dovetailing with workforce-optimization targets.
Oral oncology pipelines also flourish, supported by adherence-monitoring apps and digital pill dispensers that mitigate compliance risks. Manufacturers investing in formulation science and device partnerships gain first-mover advantage, while payer scrutiny intensifies on intravenous price premiums absent clear clinical benefit over patient-centric routes.
By End User: Specialty Clinics Capture Ambulatory Shift
Hospitals accounted for 60.50% of the European cancer therapy market in 2025, anchored by CAR-T and multi-day chemo protocols that require intensive monitoring. Specialty oncology clinics are advancing at 6.87% CAGR as payers incentivize lower-cost ambulatory settings that cut per-treatment expenses by up to 25%. Germany’s office-based network now delivers 62% of systemic cancer care, and France added 47 infusion chairs across regional centers during 2024-2025. Home-care programs, though accounting for only 4.7% share, are the fastest-growing end-user segment at a 7.2% CAGR, enabled by digital monitoring and subcutaneous formulations.
Geography Analysis
Germany generated 28.05% of Europe cancer therapy market revenue in 2025, underpinned by growing annual pharmaceutical R&D outlays and dense Phase III trial networks in oncology centers of excellence. Early-benefit assessments facilitate rapid reimbursement for breakthrough therapies, encouraging manufacturers to prioritize German launches.
France, projected to log an 8.45% CAGR through 2031, accelerates through national genomic-screening rollouts and expedited HTA pathways, which have cut average review times by 15% since 2023. Coupled with centralized hospital purchasing, the reforms streamline market entry for targeted agents, enlarging addressable patient pools in both urban and regional cancer institutes.
The United Kingdom maintains a sizable demand despite post-Brexit realignment, as the Medicines and Healthcare products Regulatory Agency (MHRA) mutual-recognition initiative preserves access to EMA dossiers. Italy and Spain advance through biosimilar uptake and increased oncology spending allocation, while Nordic countries leverage digital registries to optimize precision medicine deployment. Central and Eastern European markets, though smaller, record double-digit nominal growth supported by EU Cohesion Fund investments in radiotherapy infrastructure.
Competitive Landscape
Europe’s cancer therapeutics market exhibits moderate concentration, with a few key players holding significant market share in 2025. Roche, Novartis, and AstraZeneca defend their leadership through life-cycle management and broad tumor-type coverage, exemplified by Roche’s three immunotherapy combinations, which achieved survival gains of over 20% in pivotal studies.
Strategic M&A activity intensified in 2024, with Novartis acquiring MorphoSys for EUR 2.7 billion and Merck KGaA acquiring SpringWorks for USD 3.9 billion to secure next-generation targeted assets. Antitrust vigilance remains high; the European Commission has levied fines of EUR 780 million (USD 902.3 million) for anti-competitive conduct between 2018 and 2022.[2]European Commission, “Competition Enforcement in Pharmaceuticals 2018-2022,” ec.europa.eu Joint ventures between big pharma and AI specialists, such as AstraZeneca’s USD 200 million oncology-AI pact, accelerate molecule-discovery velocity and refine trial-design efficiencies.
Mid-cap firms bridge innovation gaps through risk-sharing collaborations; Genmab’s antibody engineering expertise and Regeneron’s bispecific platform alignment exemplify symbiotic models that de-risk capital-intensive indications. Radiopharmaceutical newcomers attract escalating valuations as isotope supply chains stabilize, while biosimilar pure-plays, such as Sandoz, parley manufacturing scale into competitive price bids that constrain originator margins. Emerging disruptors include ITM Isotope Technologies, scaling actinium-225 production, and Owkin’s federated-learning network that trains AI models across 25 hospitals without moving patient data, an approach aligned with GDPR.
Europe Cancer Therapy Industry Leaders
Amgen Inc.
AstraZeneca PLC
Bayer AG
Bristol-Meyrs Squibb Company
F. Hoffmann-La Roche Ltd
- *Disclaimer: Major Players sorted in no particular order

Recent Industry Developments
- February 2026: The European Commission opened its 2026 Horizon Europe call for cancer-mission project proposals, funding collaborative R&D across member states.
- February 2026: ImmunityBio partnered with Accord Healthcare to supply ANKTIVA plus BCG for BCG-unresponsive bladder cancer and set up a Dublin subsidiary to manage distribution across Europe.
- February 2026: Helsinn received EC marketing authorization for an oral suspension of AKYNZEO for cancer therapy side effects, adding a flexible option for patients who have difficulty swallowing existing formulations.
- February 2026: Lyell Immunopharma dosed the first patient in a Phase 3 trial of ronde-cel against approved CAR-T comparators in large B-cell lymphoma, enrolling 400 participants


Europe Cancer Therapy Market Report Scope
According to the report's scope, European cancer therapies are drugs that block the growth and proliferation of cancer by interfering with specific molecules, such as DNA or proteins, involved in the development or expansion of cancerous cells.
The Europe Cancer Therapy Market is segmented by therapy type, cancer type, drug class, mode of administration, and country. By therapy type, the market is segmented into chemotherapy, target therapy, immunotherapy, hormonal therapy, and other therapy types. By cancer type, the market is segmented into breast cancer, prostate cancer, lung cancer, colorectal cancer, hematologic cancer, and other cancer types. By drug class, the market is segmented into PD-1/PD-L1 inhibitors, tyrosine kinase inhibitors, CDK4/6 inhibitors, hormone antagonists, antibody-drug conjugates, and other drug classes. By mode of administration, the market is segmented into intravenous, subcutaneous, oral, and other modes of administration. By country, the market is segmented into Germany, the United Kingdom, France, Italy, Spain, and the Rest of Europe. The report offers market size and forecasts in value (USD) for the above segments.
| Chemotherapy |
| Targeted Therapy |
| Immunotherapy |
| Hormonal Therapy |
| Other Therapy Types |
| Breast Cancer |
| Lung Cancer |
| Colorectal Cancer |
| Prostate Cancer |
| Hematologic Cancers |
| Other Cancer Types |
| PD-1 / PD-L1 Inhibitors |
| Tyrosine-Kinase Inhibitors |
| CDK4/6 Inhibitors |
| Hormone Antagonists |
| Antibody-Drug Conjugates |
| Other Drug Classes |
| Intravenous |
| Subcutaneous |
| Oral |
| Other Modes |
| Hospitals |
| Specialty Oncology Clinics |
| Ambulatory Surgical Centers |
| Home-care & Tele-oncology Programs |
| Germany |
| United Kingdom |
| France |
| Italy |
| Spain |
| Rest of Europe |
| By Therapy Type | Chemotherapy |
| Targeted Therapy | |
| Immunotherapy | |
| Hormonal Therapy | |
| Other Therapy Types | |
| By Cancer Type | Breast Cancer |
| Lung Cancer | |
| Colorectal Cancer | |
| Prostate Cancer | |
| Hematologic Cancers | |
| Other Cancer Types | |
| By Drug Class | PD-1 / PD-L1 Inhibitors |
| Tyrosine-Kinase Inhibitors | |
| CDK4/6 Inhibitors | |
| Hormone Antagonists | |
| Antibody-Drug Conjugates | |
| Other Drug Classes | |
| By Mode of Administration | Intravenous |
| Subcutaneous | |
| Oral | |
| Other Modes | |
| By End User | Hospitals |
| Specialty Oncology Clinics | |
| Ambulatory Surgical Centers | |
| Home-care & Tele-oncology Programs | |
| By Country | Germany |
| United Kingdom | |
| France | |
| Italy | |
| Spain | |
| Rest of Europe |


Key Questions Answered in the Report
Which countries generate the largest and fastest growth in European oncology sales?
Germany contributed 28.05% of 2025 revenue, while France is forecast for the quickest 8.45% CAGR to 2031.
What therapy classes are expanding quickest in European cancer care?
Antibody-drug conjugates are projected to post the highest 7.05% CAGR through 2031 and are reshaping targeted-delivery strategies.
How will EMA reforms influence drug-launch timelines?
Conditional approvals and joint clinical assessments are cutting filing-to-launch intervals, allowing biomarker-driven agents to reach patients within one year of pivotal data.
Why is subcutaneous delivery gaining ground?
Patient preference for home treatment and hospital cost-containment targets drive a 6.99% CAGR for subcutaneous oncology formats through 2031.
What obstacles most hinder new therapy uptake?
Divergent national HTA reviews and limited nuclear-medicine facilities slow radiopharmaceutical adoption despite regulatory clearance.
How Large the Europe Cancer Therapy Market by 2031?
It is projected to reach USD 83.69 billion by 2031, advancing at a 5.31% CAGR from 2026.
Page last updated on:


