Chemotherapy Market Size and Share
Market Overview
| Study Period | 2020 - 2031 |
|---|---|
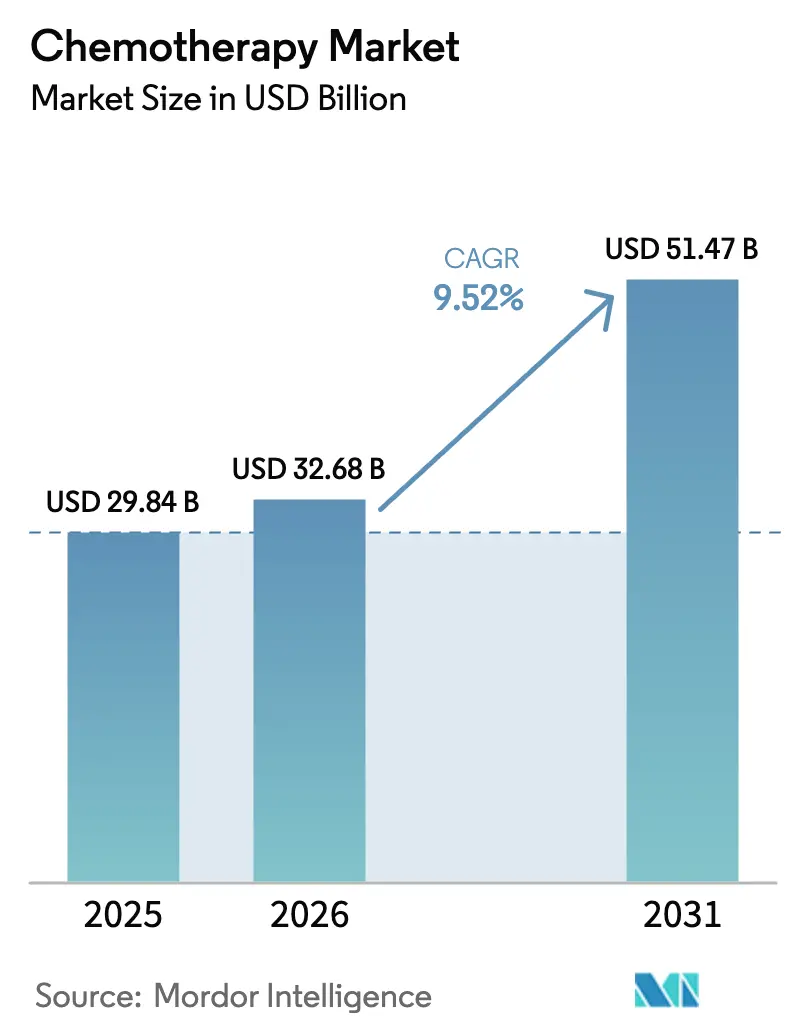
| Market Size (2026) | USD 32.68 Billion |
| Market Size (2031) | USD 51.47 Billion |
| Growth Rate (2026 - 2031) | 9.52% CAGR |
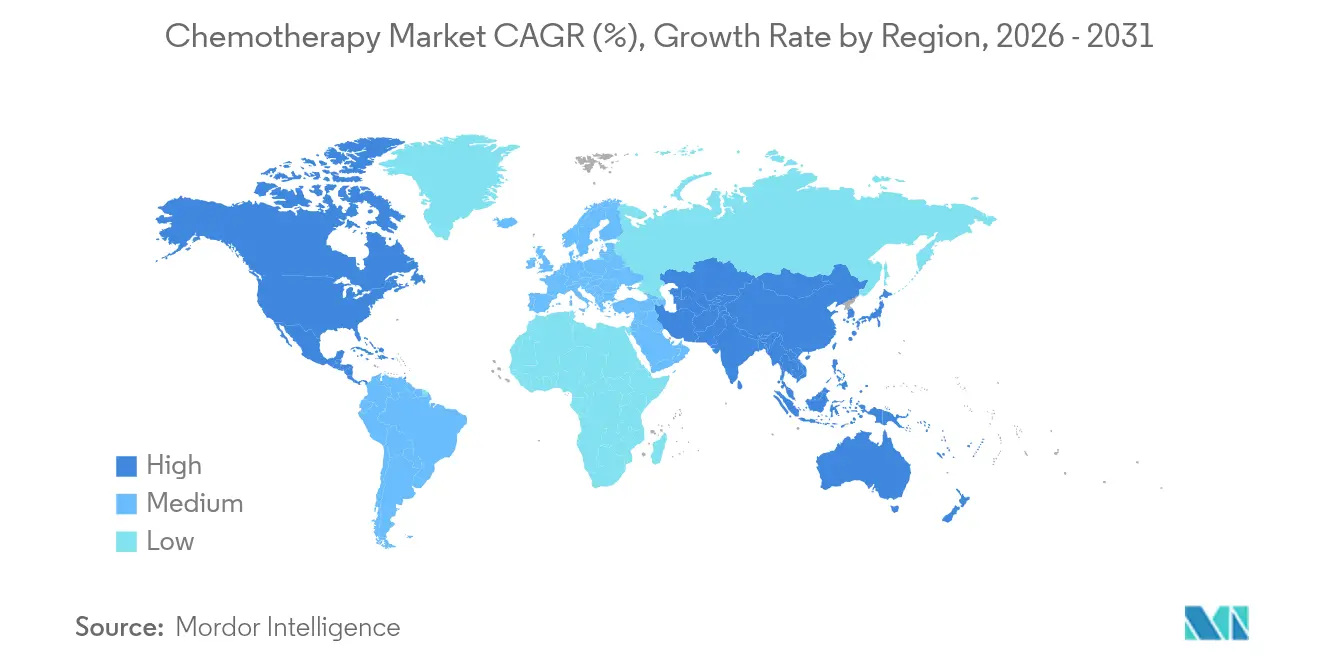
| Fastest Growing Market | Asia Pacific |
| Largest Market | North America |
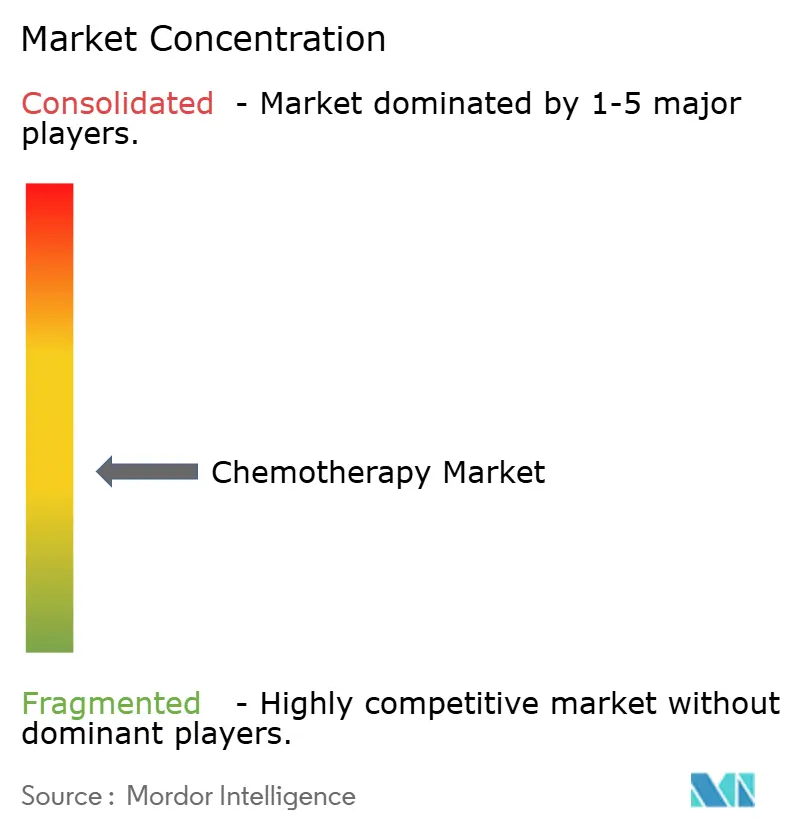
| Market Concentration | Medium |
Major Players *Disclaimer: Major Players sorted in no particular order Image © Mordor Intelligence. Reuse requires attribution under CC BY 4.0. | |
Chemotherapy Market Analysis by Mordor Intelligence
The chemotherapy market size was valued at USD 29.84 billion in 2025 and estimated to grow from USD 32.68 billion in 2026 to reach USD 51.47 billion by 2031, at a CAGR of 9.52% during the forecast period (2026-2031). The expansion reflects a persistent worldwide cancer burden, steady inclusion of cytotoxic drugs in multi-agent protocols, and ongoing approvals of novel fixed-dose combinations that lengthen patent life. Oncology centers continue to rely on chemotherapy as the clinical backbone when targeted options fail or must be partnered to prevent resistance. Oral formulations broaden access, while supply-chain scale-up in Asia has lowered active-pharmaceutical-ingredient (API) costs and widened therapy availability. At the same time, the market contends with drug shortages for legacy agents, stricter hazardous-waste rules, and competitive diversion of research budgets toward immuno-oncology.
Key Report Takeaways
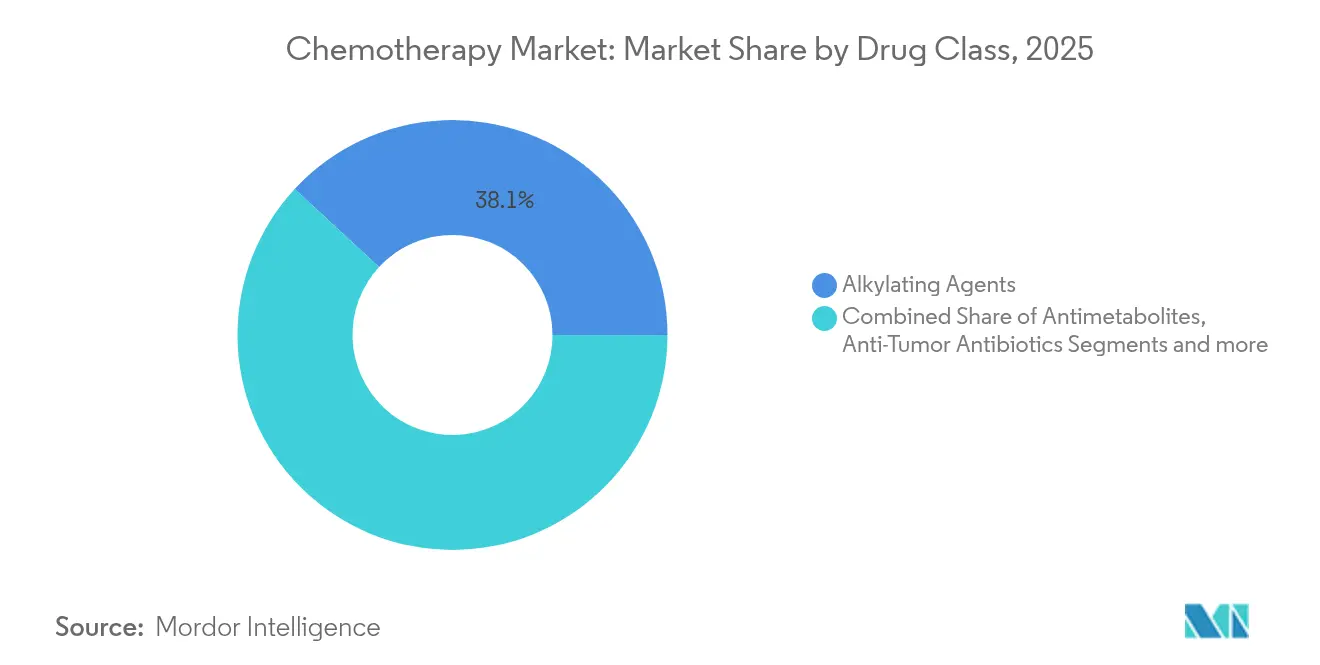
- By drug class, alkylating agents led with 38.12% chemotherapy market share in 2025; antimetabolites are set to post a 10.05% CAGR to 2031
- By route of administration, oral therapies accounted for 50.74% of the chemotherapy market size in 2025, whereas intravenous agents are projected to expand at 10.12% CAGR through 2031
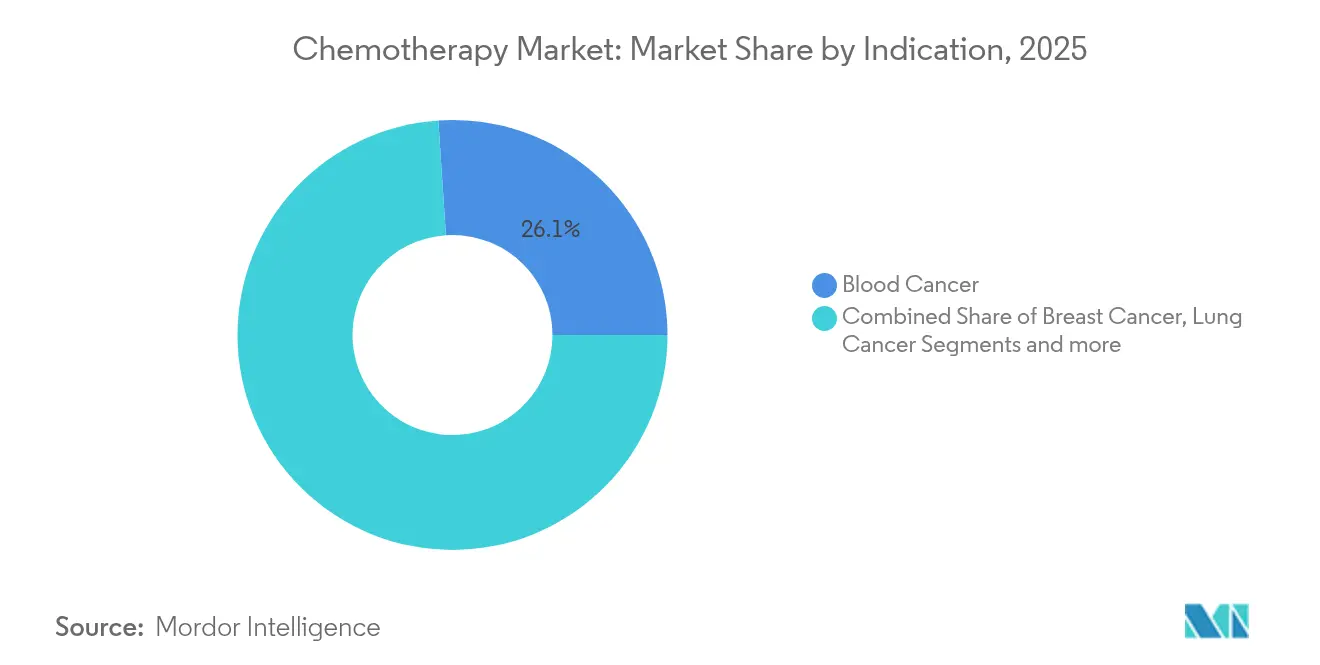
- By indication, blood cancers captured 26.05% of the chemotherapy market size in 2025; breast cancer treatments are forecast to rise at 10.23% CAGR to 2031
- By age group, adults held 56.05% share of the chemotherapy market size in 2025, while the geriatric segment is poised for 10.28% CAGR through 2031
- By geography, North America dominated with 38.44% revenue share in 2025; Asia-Pacific is anticipated to grow at 10.36% CAGR over the same period
Note: Market size and forecast figures in this report are generated using Mordor Intelligence’s proprietary estimation framework, updated with the latest available data and insights as of 2026.
Global Chemotherapy Market Trends and Insights
Drivers Impact Analysis*
| Driver | (~) % Impact on CAGR Forecast | Geographic Relevance | Impact Timeline |
|---|---|---|---|
| Increasing cancer prevalence | +2.1% | Global | Long term (≥ 4 years) |
| Approval of novel fixed-dose combination cytotoxic regimens | +1.8% | North America & EU, spill-over to APAC | Medium term (2-4 years) |
| Expansion of oral and at-home chemotherapy delivery models | +1.5% | Global, with early gains in North America, Europe | Short term (≤ 2 years) |
| Rapid scale-up of manufacturing in emerging markets lowering API cost | +1.3% | APAC core, spill-over to MEA | Medium term (2-4 years) |
| AI-enabled target discovery accelerating cytotoxic drug repurposing | +0.9% | North America & EU | Long term (≥ 4 years) |
| Biosimilar wave in high-volume cytotoxic agents enlarging patient pool | +1.2% | Global | Medium term (2-4 years) |
| Source: Mordor Intelligence | |||
Increasing Cancer Prevalence
Global cancer incidence is projected to reach 35 million new cases by 2050, a 77% rise compared with 2022, which sustains long-term demand for cost-effective cytotoxic drugs [1]International Agency for Research on Cancer, “Global Cancer Burden Projected to 2050,” iarc.who.int . Emerging economies carry a disproportionate share because lifestyle-related risk factors spread faster than screening programs. In many of these regions, targeted biologics remain unaffordable, so first-line therapy still defaults to chemotherapy combinations. This unbalanced access profile ensures that volume growth continues even where precision medicine is expanding.
Approval of Novel Fixed-Dose Combination Cytotoxic Regimens
Regulators now clear fixed-dose blends that streamline multi-agent delivery, reduce dosing errors, and offer patentable convenience. The February 2024 FDA clearance of irinotecan liposome partnered with oxaliplatin, fluorouracil, and leucovorin in metastatic pancreatic cancer delivered superior overall survival versus gemcitabine regimens [2]U.S. Food and Drug Administration, “Oncology Approvals 2024,” fda.gov . Such approvals validate value-added reformulations that keep mature cytotoxic molecules commercially relevant.
Expansion of Oral and At-Home Chemotherapy Delivery Models
More than 51% of new chemotherapy prescriptions in major markets are oral. Payers support at-home models because they lower infusion-center costs, and patients embrace fewer hospital visits. The continuation of pandemic-era tele-oncology programs, supported by wearable toxicity monitoring, anchors this uptake [3]Bristol Myers Squibb, “Advancing Home-Based Cancer Care,” bms.com . Nevertheless, success depends on robust counseling to mitigate adherence lapses.
Rapid Scale-Up of Manufacturing in Emerging Markets Lowering API Cost
Contracts in India and China have cut API prices for several high-volume cytotoxics by 15-30%, lowering average therapy costs. China’s pharmaceutical output, valued at USD 160 billion in 2023, now prioritizes oncology lines, and Indian contract development and manufacturing organizations capture global generic demand. The supply chain diversification, however, was tested during 2024 shortages of carboplatin and cisplatin, prompting calls for multi-region redundancy.
Restraints Impact Analysis*
| Restraint | (~) % Impact on CAGR Forecast | Geographic Relevance | Impact Timeline |
|---|---|---|---|
| High research and development costs | -1.4% | Global | Long term (≥ 4 years) |
| Escalating multi-drug resistance and tumor heterogeneity | -0.8% | Global | Medium term (2-4 years) |
| Shift toward targeted & immuno-oncology reducing cytotoxic share | -1.1% | North America & EU, expanding to APAC | Medium term (2-4 years) |
| Stringent hazardous-waste & worker-safety regulations raising COGS | -0.6% | Global, with stricter enforcement in developed markets | Short term (≤ 2 years) |
| Source: Mordor Intelligence | |||
High Research and Development Costs
Phase III oncology studies now exceed USD 250 million on average, while accelerated approval programs divert venture capital toward immunotherapy where pricing power is higher. Cytotoxic projects must still complete large randomized trials, lengthening time to market and compressing exclusivity. Generic erosion follows swiftly once patents lapse, reducing lifetime revenue and deterring fresh entrants.
Escalating Multi-Drug Resistance and Tumor Heterogeneity
Drug-efflux pumps, enhanced DNA repair, and adaptive clonal evolution shrink chemotherapy response rates across lines of therapy. Liquid-biopsy data expose resistance mutations in real time, but actionable switches are often lacking. Consequently, oncologists increasingly pair chemotherapy with checkpoint inhibitors or kinase blockers, limiting single-agent usage.
*Our forecasts treat driver/restraint impacts as directional, not additive. The impact forecasts reflect baseline growth, mix effects, and variable interactions.
Segment Analysis
By Drug Class: Broad Alkylating Control and Antimetabolite Acceleration
Alkylating agents delivered 38.12% of 2025 revenue, underscoring the chemotherapy market backbone status of cyclophosphamide, cisplatin, and carboplatin. Their DNA cross-linking effect applies across tumor types, keeping guideline inclusion high despite generic pricing. Hospitals view them as dependable workhorses, and supply contracts frequently bundle them with supportive-care drugs. Market resilience was, however, challenged when global shortages disrupted 28% of planned regimens in 2024, revealing vulnerabilities in single-source APIs.
Antimetabolites post the quickest climb at 10.05% CAGR to 2031 as biomarker-guided dosing gains acceptance. Fluorouracil and methotrexate find renewed life in precision protocols that modulate schedules according to dihydropyrimidine dehydrogenase status. New formulations also lift convenience; a high-concentration fluorouracil pump abbreviated chair-time by 30% in U.S. community oncology. Together, these forces cement segment expansion and contribute measurably to overall chemotherapy market growth.


By Route of Administration: Two-Track Evolution Around Patient Preference and Formulation Science
Oral drugs captured 50.74% share in 2025, driven by patient demand for home-based care, fewer clinic trips, and payer support for lower overhead. Tablets and capsules now integrate taste-masking polymers and modified-release coatings, improving adherence. Digital blister packs register dosing in real time, providing oncologists with adherence data at each visit. Healthcare systems in Germany and Canada have already set bundled per-member-per-month payments that favor ambulatory delivery.
Intravenous (IV) therapies may trail in current share yet race ahead at 10.12% CAGR. Liposomal carriers, polymer conjugates, and antibody-drug conjugates deliver higher intratumoral payload with lower systemic exposure. The February 2024 irinotecan liposome approval led to a 21% quarter-on-quarter uptick in metastatic pancreatic protocols. IV innovation therefore supports a dual-track model in which convenience drives oral growth while breakthrough formulations power the hospital-infusion rebound.
By Indication: Hematology Tradition Meets Breast-Cancer Upswing
Blood cancers generated 26.05% of sales in 2025 because multi-agent chemotherapy remains first-line in acute leukemias and many lymphomas. Regimens like cytarabine–daunorubicin anchor remission induction, and the absence of validated molecular targets in certain subtypes prolongs reliance on cytotoxics. CAR-T therapies are entering practice, but capacity limits and cost barriers keep chemotherapy dominant for now.
Breast-cancer demand is growing fastest at 10.23% CAGR through 2031. Triple-negative disease often lacks receptor targets, so anthracyclines and taxanes retain pivotal positions. The 2024 approval of pembrolizumab plus chemotherapy in high-risk early-stage disease widened eligible populations, giving cytotoxics a fresh boost. Enhanced neoadjuvant use also lifts vial volumes, especially in Asia-Pacific where screening expands.
By Age Group: Mid-Life Bulk but Silver-Age Momentum
Adults accounted for 56.05% revenue in 2025 because cancer incidence peaks between ages 45 and 64, and these patients generally tolerate high-dose intensity. Standard regimens such as FOLFOX and CHOP remain cornerstones, and payers approve dose-dense schedules when curative intent is plausible.
Geriatric demand rises fastest at 10.28% CAGR. Improved supportive care, such as liposomal doxorubicin to lower cardiotoxicity, has widened eligibility among patients aged 75 years and older. FDA guidance issued in 2024 encourages inclusion of individuals over 70 in trials, which should refine geriatric dosing standards and further fuel growth.
Geography Analysis
North America retained 38.44% revenue in 2025 as U.S. oncology benefits from premium pricing and widespread insurance coverage that funds multi-cycle combination regimens. Major centers deploy artificial-intelligence-based dose calculators that tailor schedules, improving outcomes and keeping branded cytotoxics in demand. Canada’s single-payer system favors generics, yet volumes remain high, while Mexico’s improving coverage drives dual-tier uptake across private and public facilities.
Asia-Pacific, expanding at 10.36% CAGR, gains from rising incidence, broader reimbursement, and aggressive domestic manufacturing. China’s oncology imports reached USD 12.8 billion in 2024, yet parallel local production ensures competitive pricing and resilient supply. Japan’s super-aged society drives continuous demand for low-toxicity regimens, and regulators there have shortened approval times for foreign combination products. India leverages cost leadership in generics and exports APIs globally, reinforcing the supply backbone that underpins the chemotherapy market.
Europe is a mature but stable contributor. Health-technology-assessment agencies demand cost-effectiveness evidence; thus, uptake concentrates in regimens with clear survival benefits and manageable toxicity. Germany, France, and the United Kingdom anchor regional spend through comprehensive cancer networks. Meanwhile, the Middle East & Africa and South America register early-stage expansion as cancer awareness campaigns and infrastructure investments widen patient access, but pricing sensitivity caps premium uptake.

Competitive Landscape
Competition is moderately fragmented. Global majors like Roche, Novartis, and Pfizer wield diversified portfolios that span small molecules and biologics, collectively claiming 28% of revenue in 2024. These incumbents spread risk across indications and use lifecycle-management tactics such as liposomal upgrades to defend share. Mid-sized innovators, for example Daiichi Sankyo, focus on antibody-drug conjugates that pair cytotoxic payloads with targeted delivery, thereby expanding the chemotherapy market rather than replacing it.
Biosimilar manufacturers intensify price pressure in staple agents. Indian and South Korean firms launched doxorubicin and paclitaxel biosimilars at 25% discount during 2024 tender rounds, boosting access in cost-constrained systems. Strategic collaborations are proliferating; Pfizer partnered with a Chinese manufacturer to secure redundant carboplatin API, insulating against shortages. Technology investments center on machine-learning platforms that predict optimal dose density and genomic-guided scheduling, giving early adopters a marketing narrative around precision chemotherapy.
White-space opportunities include geriatric-specific formulations, ready-to-use IV bags that cut compounding time, and combination kits co-bundling antiemetics. Supply-chain resilience is emerging as a competitive differentiator after 2024 shortages disrupted care in 37% of U.S. centers. Manufacturers that demonstrate dual-continent production and track-and-trace transparency may win long-term procurement contracts as payers elevate security of supply in tender criteria.
Chemotherapy Industry Leaders
Bristol-Myers Squibb Company
Pfizer Inc
Genentech, Inc
Novartis AG
Johnson & Johnson
- *Disclaimer: Major Players sorted in no particular order

Recent Industry Developments
- July 2025: The FDA granted accelerated approval to sunvozertinib for EGFR-exon 20-inserted NSCLC after platinum chemotherapy
- July 2025: The FDA granted accelerated approval to linvoseltamab-gcpt for heavily pre-treated multiple myeloma
- June 2025: The FDA granted accelerated approval to datopotamab deruxtecan-dlnk for EGFR-mutated NSCLC after targeted therapy and platinum chemotherapy
- January 2025: The FDA issued draft guidance on prevention and treatment of chemotherapy-induced peripheral neuropathy


Global Chemotherapy Market Report Scope
As per the scope of the report, chemotherapy is a type of cancer treatment that uses drugs to kill or inhibit the growth of cancer cells. It targets rapidly dividing cells, which are characteristic of cancer cells. Chemotherapy can be administered in various ways, including intravenously or orally, and it may be used alone or in combination with other treatments such as surgery, radiation therapy, or immunotherapy.
The chemotherapy market is segmented into drug class, route of administration, indication, end user, and geography. By drug class, the market is segmented into alkylating agents, antimetabolites, anti-tumor antibiotics, topoisomerase inhibitors, mitotic inhibitors, and others. The others include liposomal drugs, corticosteroids, and many more. By route of administration, the market is segmented into oral, intravenous, and others. The others include topical, intravesicular, and many more. By indication, the market is segmented into breast cancer, blood cancer, lung cancer, colorectal cancer, prostate cancer, and others. The others include stomach cancer, liver cancer, and many more. By end user, the market is segmented into hospitals, specialty clinics, and others. By geography, the market is segmented into North America, Europe, Asia-Pacific, South America, and Middle East and Africa. For each segment, the market sizing and forecasts have been done on the basis of value (USD).
| Alkylating Agents |
| Antimetabolites |
| Anti-Tumor Antibiotics |
| Topoisomerase Inhibitors |
| Mitotic Inhibitors |
| Others |
| Oral |
| Intravenous |
| Others |
| Breast Cancer |
| Blood Cancer |
| Lung Cancer |
| Colorectal Cancer |
| Prostate Cancer |
| Others |
| Adults |
| Geriatric |
| Pediatric |
| North America | United States |
| Canada | |
| Mexico | |
| Europe | Germany |
| United Kingdom | |
| France | |
| Italy | |
| Spain | |
| Rest of Europe | |
| Asia-Pacific | China |
| Japan | |
| India | |
| Australia | |
| South Korea | |
| Rest of Asia-Pacific | |
| Middle East and Africa | GCC |
| South Africa | |
| Rest of Middle East and Africa | |
| South America | Brazil |
| Argentina | |
| Rest of South America |
| By Drug Class | Alkylating Agents | |
| Antimetabolites | ||
| Anti-Tumor Antibiotics | ||
| Topoisomerase Inhibitors | ||
| Mitotic Inhibitors | ||
| Others | ||
| By Route of Administration | Oral | |
| Intravenous | ||
| Others | ||
| By Indication | Breast Cancer | |
| Blood Cancer | ||
| Lung Cancer | ||
| Colorectal Cancer | ||
| Prostate Cancer | ||
| Others | ||
| By Age Group | Adults | |
| Geriatric | ||
| Pediatric | ||
| By Geography | North America | United States |
| Canada | ||
| Mexico | ||
| Europe | Germany | |
| United Kingdom | ||
| France | ||
| Italy | ||
| Spain | ||
| Rest of Europe | ||
| Asia-Pacific | China | |
| Japan | ||
| India | ||
| Australia | ||
| South Korea | ||
| Rest of Asia-Pacific | ||
| Middle East and Africa | GCC | |
| South Africa | ||
| Rest of Middle East and Africa | ||
| South America | Brazil | |
| Argentina | ||
| Rest of South America | ||


Key Questions Answered in the Report
What is the current value of the chemotherapy market?
The chemotherapy market size is USD 32.68 billion in 2026.
How fast is the chemotherapy market expected to grow?
From 2026 to 2031, the market is forecast to register a 9.52% CAGR.
Which drug class holds the largest share of the chemotherapy market?
Alkylating agents lead with 38.12% share.
Which region is expanding fastest in the chemotherapy market?
Asia-Pacific is projected to grow at 10.36% CAGR through 2031.
Why are oral chemotherapy formulations gaining momentum?
They reduce hospital visits, fit cost-containment goals, and now represent over 51% of new prescriptions in developed regions.
What challenges threaten chemotherapy market growth?
High research costs, drug shortages, and competition from targeted and immuno-oncology therapies can temper expansion.
Page last updated on:


