Market Overview
| Study Period | 2020 - 2031 |
|---|---|
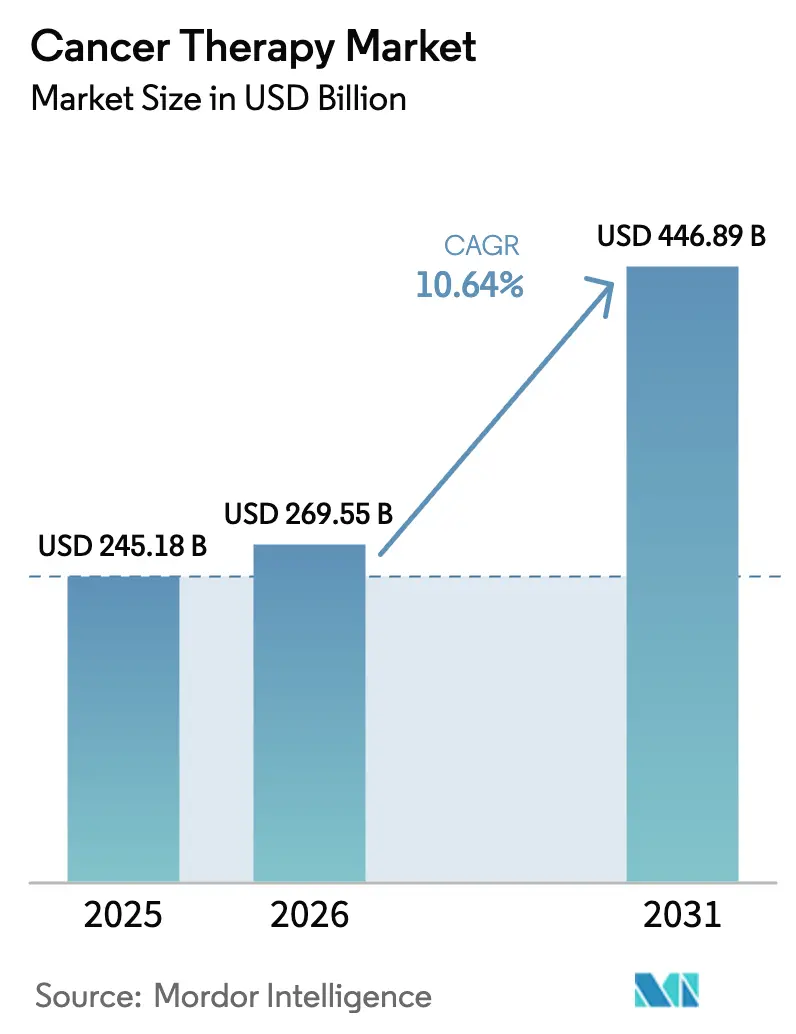
| Market Size (2026) | USD 269.55 Billion |
| Market Size (2031) | USD 446.89 Billion |
| Growth Rate (2026 - 2031) | 10.64% CAGR |
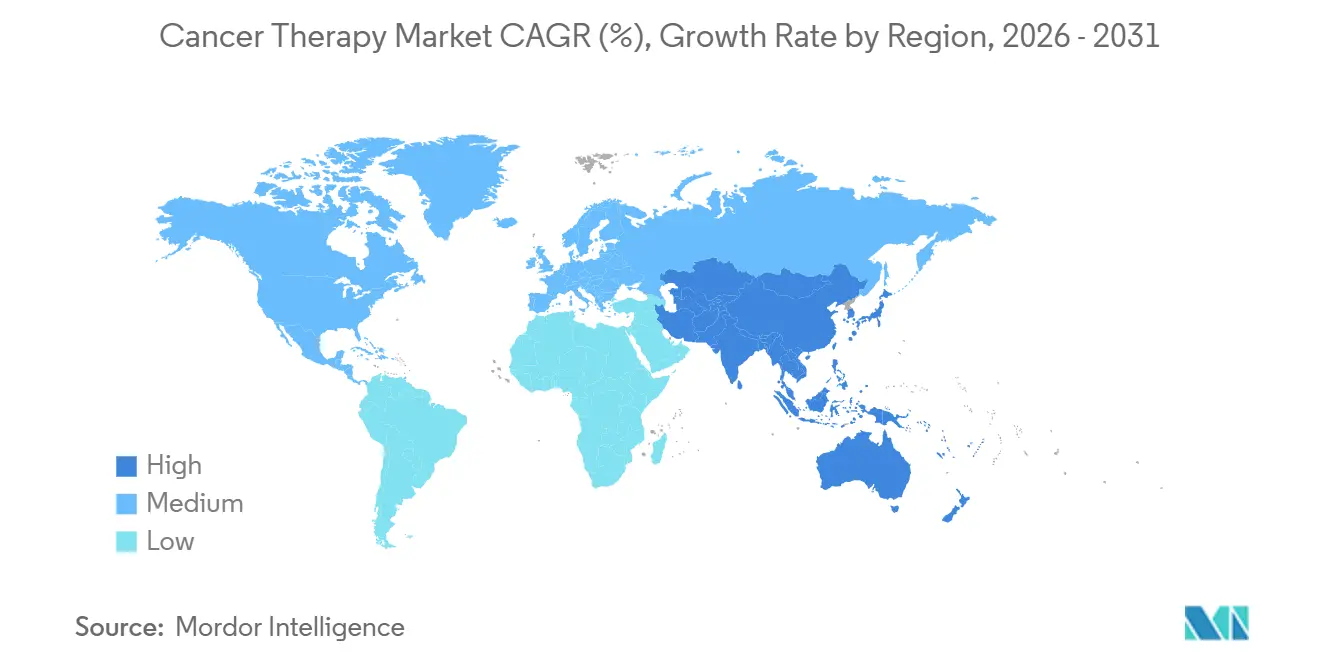
| Fastest Growing Market | Asia Pacific |
| Largest Market | North America |
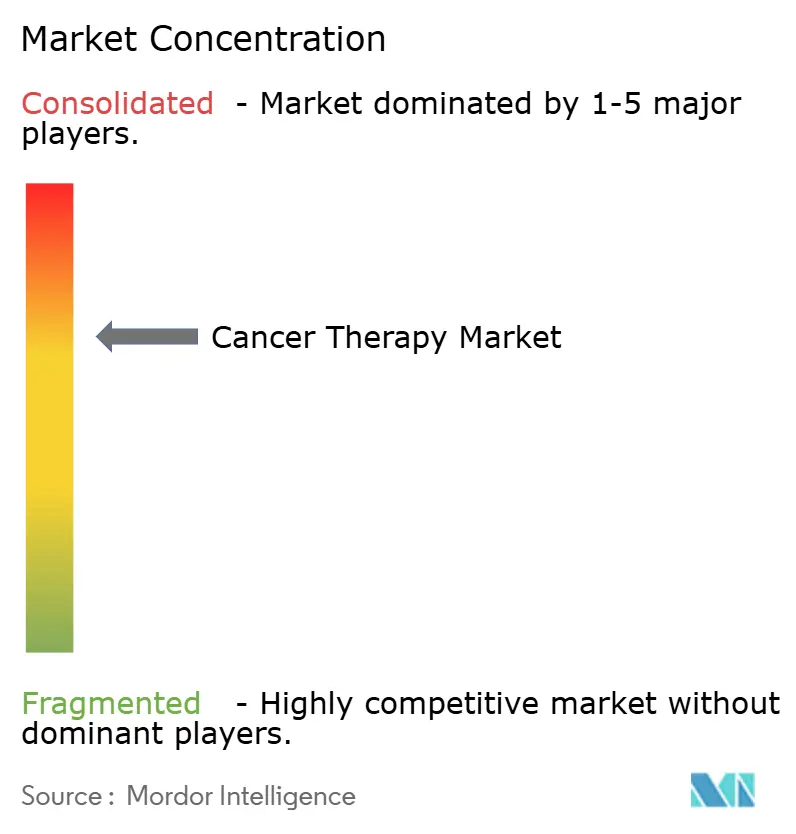
| Market Concentration | Medium |
Major Players *Disclaimer: Major Players sorted in no particular order Image © Mordor Intelligence. Reuse requires attribution under CC BY 4.0. | |
Cancer Therapy Market Analysis by Mordor Intelligence
The Cancer Therapy Market size was valued at USD 245.18 billion in 2025 and is estimated to grow from USD 269.55 billion in 2026 to reach USD 446.89 billion by 2031, at a CAGR of 10.64% during the forecast period (2026-2031).
The broader adoption of immune-oncology agents, steady gains in biomarker-guided prescribing, and the expansion of manufacturing capacity for cell and gene therapies are driving demand in both mature and emerging healthcare systems. Large pharmaceutical companies are accelerating portfolio renewal through targeted acquisitions, while specialty biotechs employ artificial intelligence to shorten discovery timelines and secure niche indications. Hospitals remain the dominant spending channel; however, payers are steering patients toward suitable regimens in outpatient and home settings to curb the total cost of care. Regional growth differentials are pronounced as Asia-Pacific countries streamline approval pathways and subsidize locally produced biologics.
Key Report Takeaways
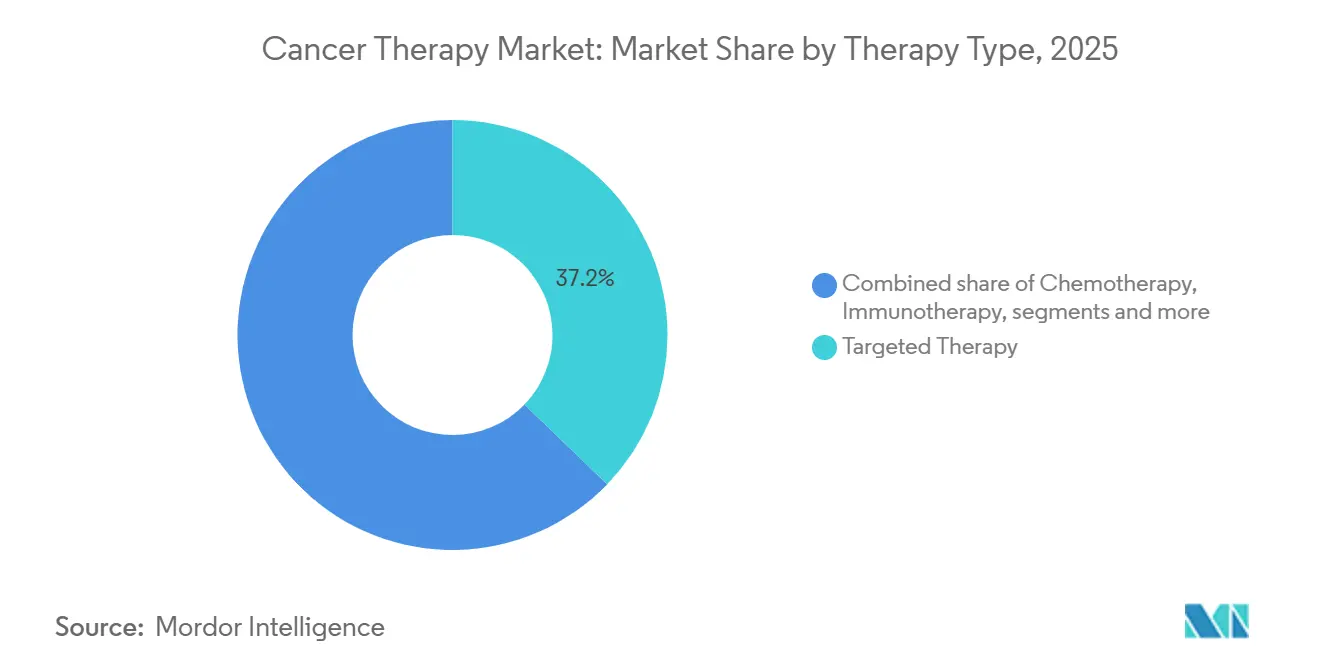
- By therapy type, targeted therapy captured 37.21% revenue share in 2025; cell and gene therapy is forecast to expand at a 12.5% CAGR through 2031.
- By cancer type, breast cancer held 18.23% of 2025 demand, while lung cancer therapeutics are projected to advance at an 11.1% CAGR to 2031.
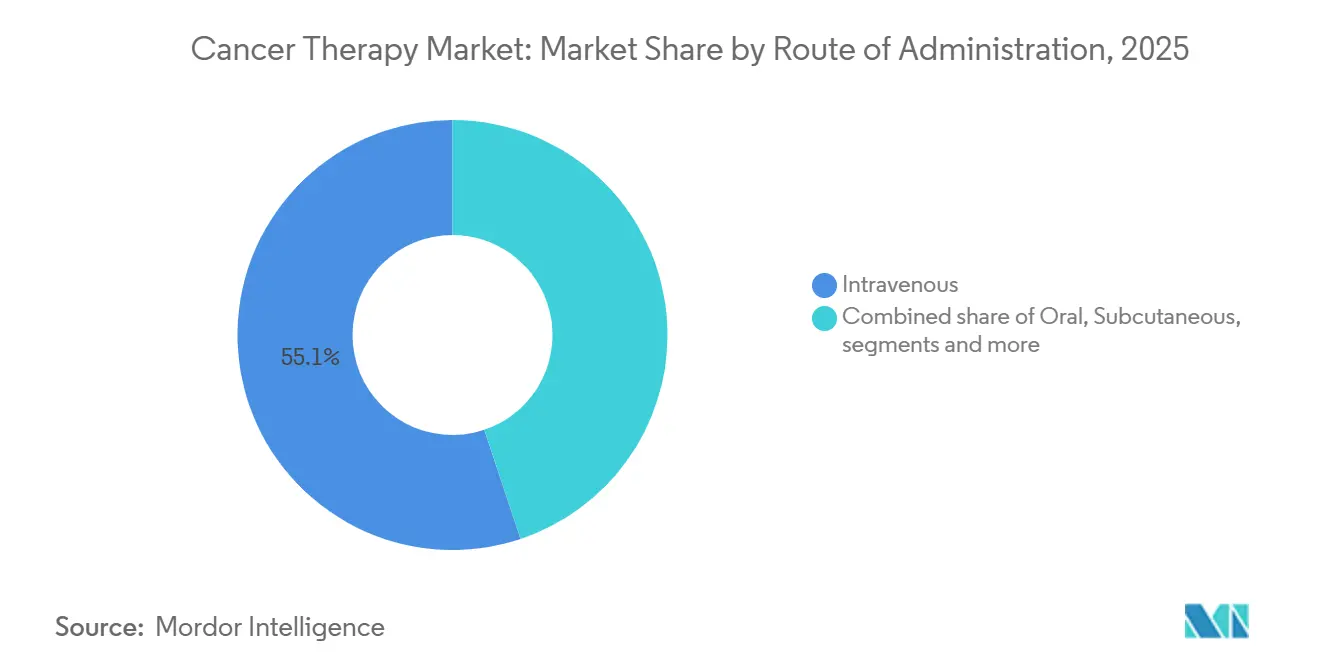
- By route of administration, intravenous drugs accounted for 55.14% of the cancer therapy market share in 2025, whereas intratumoral delivery is set to grow at a 12.73% CAGR through 2031.
- By end user, hospitals accounted for 62.40% of 2025 spending; meanwhile, home-care settings are projected to expand at an 11.72% CAGR through 2031.
- By geography, North America led with 43.23% of the 2025 revenue, while the Asia-Pacific region is advancing at an 11.20% CAGR through 2031.
Note: Market size and forecast figures in this report are generated using Mordor Intelligence’s proprietary estimation framework, updated with the latest available data and insights as of January 2026.
Global Cancer Therapy Market Trends and Insights
Drivers Impact Analysis*
| Driver | (~) % Impact on CAGR Forecast | Geographic Relevance | Impact Timeline |
|---|---|---|---|
| Rising Global Cancer Incidence & Aging Population | +2.3% | North America, Europe, East Asia | Long term (≥ 4 years) |
| Advances in Immunotherapy and Targeted Therapies | +2.8% | North America and Europe | Medium term (2-4 years) |
| Growing Adoption of Precision Oncology & Biomarker Testing | +1.9% | North America, Western Europe, urban China and India | Medium term (2-4 years) |
| Increasing Healthcare Expenditure & Access in Emerging Markets | +1.7% | Asia-Pacific core, Middle East, Latin America | Long term (≥ 4 years) |
| Accelerating Digital Therapeutics & AI-Driven Discovery | +1.2% | United States, European Union, Israel, Singapore | Short term (≤ 2 years) |
| Expansion of Value-Based Pricing & Outcome Contracts | +0.9% | United States, United Kingdom, Germany, Australia | Medium term (2-4 years) |
| Source: Mordor Intelligence | |||
Rising Global Cancer Incidence & Aging Population
Worldwide, people aged 65 and older account for most new cancer diagnoses, and health agencies now register oncology as a top cause of urban mortality in multiple regions[1]European Society for Medical Oncology, “Cancer Burden 2026,” esmo.org. Longer lifespans coupled with cumulative exposures to tobacco, ultraviolet radiation, and industrial pollutants ensure persistently high therapy volumes across numerous lines of treatment. National cancer centers in East Asia forecast marked growth in incident cases through 2035, prompting investments in regional oncology hubs. Direct care costs already consume a rising share of health budgets, displacing preventive programs and straining insurance solvency. Hospital systems are scaling their infusion capacity and recruiting oncology specialists to accommodate the influx of patients.
Advances in Immunotherapy and Targeted Therapies
Checkpoint inhibitors, bispecific T-cell engagers, and antibody-drug conjugates have redefined survival benchmarks across tumor types, earning multiple accelerated approvals in the last five years[2]U.S. Food and Drug Administration, “Oncology Approvals 2025-2026,” fda.gov. Bispecific antibodies for multiple myeloma and relapsed lymphoma show durable progression-free survival in heavily pretreated populations. HER2-low breast cancer approvals broaden eligibility to patients previously deemed HER2-negative, reshaping treatment algorithms. KRAS G12C inhibitors, combined with checkpoint blockade, are outperforming chemotherapy in pivotal trials, creating new sequencing challenges for clinicians. The complexity of regimen selection is driving the adoption of clinical decision-support tools that integrate real-world evidence.
Growing Adoption of Precision Oncology and Biomarker Testing
Coverage expansions for broad genomic profiling under Medicare have enabled access to testing for millions of U.S. beneficiaries[3]Centers for Medicare & Medicaid Services, “National Coverage Determination for Genomic Sequencing,” cms.gov. Liquid biopsy volumes are rising swiftly as oncologists leverage circulating tumor DNA to guide therapy choice and monitor resistance mutations. China has added multiple companion diagnostics to its reimbursement list, cutting out-of-pocket costs and boosting uptake in secondary and tertiary markets. Tumor-agnostic approvals for NTRK fusions and microsatellite instability have accelerated biomarker testing, yet community practices still cite authorization delays and turnaround times as impediments. Diagnostic firms, therefore, focus on automation to shorten reporting cycles.
Increasing Healthcare Expenditure and Access in Emerging Markets
Governments in India, Brazil, and Saudi Arabia are directing substantial funds to oncology centers, reimbursement schemes, and workforce training. India’s national program now subsidizes several high-cost biologics, lifting utilization in lower-income districts. Brazil is establishing radiotherapy centers to reduce wait times, while Gulf nations are forming alliances with top cancer institutes to operate comprehensive facilities. Local biologic manufacturing across Asia-Pacific is lowering ex-factory prices, stimulating demand without external currency exposure. As a result, market penetration curves in emerging economies are steepening.
Restraints Impact Analysis*
| Restraint | (~) % Impact on CAGR Forecast | Geographic Relevance | Impact Timeline |
|---|---|---|---|
| High Treatment Costs And Financial Toxicity | -1.3% | Global | Long term (≥ 4 years) |
| Stringent Regulatory Approval Processes And Clinical Trial Complexity | -0.9% | Global | Medium term (2-4 years) |
| Supply Chain Vulnerabilities In Viral Vector And Raw Material Manufacturing | -0.7% | Global | Short term (≤ 2 years) |
| Growing Immunotherapy Resistance And Tumor Heterogeneity Challenges | -1.1% | Global | Long term (≥ 4 years) |
| Source: Mordor Intelligence | |||
High Treatment Costs and Financial Toxicity
Studies show patients facing elevated out-of-pocket expenses are more likely to discontinue oral targeted therapies prematurely, directly reducing overall survival. U.S. CAR-T infusion courses incur total charges exceeding USD 400,000, even for insured patients, encompassing hospital stays, ancillary care, and lost wages. Major assistance foundations report record application volumes yet must cap enrollments as funding lags demand. Payers respond with step-therapy prerequisites, delaying access to novel regimens and compounding disease burden. Policymakers debate co-payment caps to prevent household asset depletion.
Stringent Regulatory Approval Processes and Clinical Trial Complexity
Despite accelerated pathways, confirmatory trials lag, prompting label restrictions for several oncology agents pending survival verification. European regulators require adaptive designs to mature evidence, but sponsors struggle to meet milestones amid global enrollment hurdles. Phase III protocols now include more exclusion criteria and additional procedure visits than they did five years ago, resulting in a quarter-lengthened recruitment period. Basket trials targeting low-frequency biomarkers face operational difficulties due to the scarcity of eligible patients and competing industry studies. Rising trial overhead lifts development cost and deters smaller sponsors.
*Our forecasts treat driver/restraint impacts as directional, not additive. The impact forecasts reflect baseline growth, mix effects, and variable interactions.
Segment Analysis
By Therapy Type: Cell & Gene Therapy Outpaces Legacy Modalities
Cell and gene therapy growth at a 12.50% CAGR through 2031 underscores a structural shift away from cytotoxic drugs. Allogeneic CAR-T platforms offer off-the-shelf convenience, trimming manufacturing timelines from weeks to days. Targeted therapy accounted for 37.21% of 2025 revenue, but upcoming biosimilars are expected to erode price points as exclusivities lapse. Checkpoint inhibitors penetrate adjuvant settings, tripling eligible patient pools. Chemotherapy remains pivotal in hematologic malignancies and as a combination backbone, though first-line use in solid tumors is declining. Hormonal therapy sustains favorable toxicity profiles for receptor-positive cancers, enhanced by CDK4/6 inhibitors that extend progression-free survival past 30 months. Bispecific T-cell engagers demonstrate robust response rates in late-line myeloma, while antibody-drug conjugates with novel payloads enlarge responder subsets. The cancer therapy market size for cell and gene therapy is forecast to narrow the gap with targeted agents by 2031 materially. Biosimilars incentivize manufacturers to adopt innovative payload conjugation strategies, thereby preserving premium pricing despite intensifying competition.
Second-generation gene-edited platforms integrate hypoimmune features to evade host rejection, potentially reducing post-infusion cytokine release. Manufacturing scale-out in Singapore and China expands vector supply, tempering historical bottlenecks. Portfolio rationalization among large caps accelerates licensing deals for mid-stage assets in KRAS-mutant malignancies, often surpassing USD 1 billion upfront. Venture investment in oncology AI start-ups supports computational protein design, generating clinically viable candidates more quickly than traditional methods. As new entrants proliferate, the cancer therapy market witnesses a more democratized innovation landscape that challenges historical monopoly dynamics. Investors, therefore, track comparative durability of responses to gauge eventual adoption curves.


By Cancer Type: Lung-Cancer Therapies Surge on Mutation-Targeted Breakthroughs
Breast cancer retained 18.23% of 2025 revenue as HER2-directed regimens and CDK4/6 inhibitors entrench in earlier-line protocols.
Label expansions for checkpoint inhibitors into neoadjuvant lung settings extend treatment duration, compounding revenue streams. Combination regimens pairing KRAS inhibitors with immunotherapy offer additive benefit, pending final survival analyses. Radioligand therapy trials in earlier prostate cancer lines hint at future label growth. Basket trial successes in NTRK and RET alterations illustrate the potential of tumor-agnostic pathways to unlock cross-histology revenue with limited patient numbers. Market watchers observe whether pancreatic tumor microenvironment modulation strategies translate preclinical promise into survival gains.
By Route of Administration: Intratumoral Delivery Gains Traction
Intravenous therapies accounted for 55.14% of 2025 revenue, reflecting the dominance of monoclonal antibody infusions. However, subcutaneous formulations that cut chair time from hours to minutes show rapid uptake among infusion centers seeking throughput gains. Oral small molecules, especially kinase inhibitors, continue to gain market share due to their convenience value, although adherence monitoring remains critical. Intratumoral delivery is projected to grow at a 12.73% CAGR, driven by oncolytic virus platforms and localized immunomodulators that maximize tumor exposure while sparing systemic tissue. The cancer therapy market size attributable to intratumoral products is projected to nearly double by 2031. Regulatory guidance released in 2025 clarifies expectations for manufacturing and biodistribution, thereby lowering development risk.
Subcutaneous hyaluronidase-enabled co-formulations enable larger volumes, and many originator brands are repositioning intravenous blockbusters as pre-filled syringes. On-body injectors enable chemotherapy supportive drugs to be administered at home, reducing emergency department visits. Oral therapy benefit designs often shift full cost into deductibles early each year, heightening financial toxicity risk. Sensor-enabled adherence packaging now records dosing events to support outcome-based pricing agreements. Together, these trends foster diversification of administration modes, expanding patient choice, and relieving hospital resource constraints across the cancer therapy market.
By End User: Home-Care Settings Expand Amid Cost Pressure
Hospitals accounted for 62.40% of 2025 oncology spending, as complex CAR-T infusions and surgical resections require intensive resources. Nonetheless, payers cap facility fees, prompting centers to improve efficiency or risk losing their margins. Specialty clinics backed by private equity consolidate community practices and negotiate volume rebates with national insurers. Hypofractionated radiotherapy protocols reduce treatment courses, thereby increasing linear accelerator utilization rates. Homecare settings are growing at an 11.72% CAGR, as portable pumps and remote monitoring devices enable chemotherapy delivery in the comfort of living rooms. Payers report lower total cost of care and reduced inpatient admissions.
Wearable sensors transmit real-time vital signs to command centers, enabling early intervention and reducing the need for emergency visits. Regulatory approvals for five-day infusion pumps simplify logistics and expand eligibility beyond urban clusters. Tele-oncology check-ins replace routine follow-up appointments, alleviating travel burdens. Oncology home infusion programs in ten U.S. states cut average episode costs by double digits within the cancer therapy market. Even stem-cell transplant after-care protocols now integrate remote oximetry and nurse hotlines, validating community-based convalescence models.
Geography Analysis
North America retained 43.23% share in 2025, supported by the world’s highest per-capita oncology spend and a critical mass of research institutions. U.S. legislation capped annual out-of-pocket drug costs for Medicare beneficiaries, promising improved adherence for millions on oral regimens. Canada’s national alliance negotiated confidential rebates on novel biologics, narrowing reimbursement delays. Digital infrastructure supports the collection of extensive real-world evidence, informing value-based contracts.
Europe advances at a high single-digit CAGR through 2031 as outcome-based agreements spread. Germany and the UK tie payment for CAR-T therapies to progression-free survival, shifting risk to manufacturers. The European Medicines Agency pursues rolling reviews to shorten approval cycles for pandemic-delayed dossiers. Biosimilar penetration erodes antibody price points, funding coverage for newer modalities. Central re-evaluation committees periodically reassess comparative therapeutic benefit, modifying prices under health technology assessment frameworks.
The Asia-Pacific region grows fastest, at an 11.20% CAGR, because China adds dozens of therapies to the national reimbursement list at negotiated discounts below Western prices.
Latin America experiences double-digit growth as Brazil embraces biosimilars and Argentina streamlines expedited review pathways. Cross-border clinical trial participation gives patients earlier access while building local site capabilities. Middle Eastern Gulf states invest in integrated cancer campuses staffed by international experts. Africa experiences modest expansion, with donor agencies funding the installation of radiotherapy facilities in urban hubs. Collectively, divergent growth curves underscore the heterogeneous evolution of the cancer therapy market across continents.

Competitive Landscape
The cancer therapy market exhibits moderate concentration, with the top pharmaceutical companies controlling roughly 38% of the revenue in 2025. However, biosimilar entrants and focused biotechs continue to fragment the market share. Patent cliffs on blockbuster antibodies compel incumbents to acquire or license late-stage assets, with deal values surpassing USD 10 billion in select cases. Bispecific antibodies, antibody-drug conjugates, and allogeneic cell platforms dominate pipeline investment. Technology partnerships marry multi-omic datasets with machine learning to accelerate biomarker-driven trial recruitment.
White-space opportunities in tumor-agnostic therapies lure specialist players, who secure FDA approvals for low-prevalence biomarkers through basket trials with limited patient numbers. Hypoimmune engineering of donor CAR-T cells promises to reduce the incidence of cytokine release syndrome and lower the cost of goods. Patent filings are increasingly covering delivery innovations—such as nanoparticle encapsulation, implantable depots, and microneedle arrays—that extend exclusivity beyond molecular composition claims.
Large-cap companies are restructuring their research portfolios, dropping small molecule programs with marginal differentiation and reallocating budgets to radioligand and cell therapy franchises. Smaller firms exploit regulatory arbitrage, launching products in Asia months ahead of Western approvals and using revenue to finance global expansion. Portfolio cloning through biosimilar development remains attractive, even at discounted price points, due to its volume scalability. Competitive intensity, therefore, rises as capital flows toward differentiated modalities and patient-centric delivery formats.
Cancer Therapy Industry Leaders
F. Hoffmann-La Roche AG
Bristol Myers Squibb
Johnson & Johnson (Janssen)
Merck & Co., Inc.
AstraZeneca PLC
- *Disclaimer: Major Players sorted in no particular order

Recent Industry Developments
- December 2025: Johnson & Johnson has completed its USD 3.05 billion cash acquisition of Halda Therapeutics OpCo, Inc. Halda is a clinical-stage biotech company with a proprietary RIPTAC platform targeting solid tumors, such as prostate cancer. This move expands J&J's oncology portfolio with innovative, targeted oral therapies.
- November 2025: The FDA has approved sevabertinib, the first cancer drug developed from discoveries made at the Broad Institute. Developed by Bayer in collaboration with the Broad Institute, it targets a specific type of non-small cell lung cancer with HER2 mutations. This oral medication offers a new treatment option for adult patients who have previously undergone chemotherapy or immunotherapy.
- June 2025: BioNTech announced a strategic plan to acquire CureVac through a public exchange offer. The deal aims to enhance BioNTech’s capabilities in mRNA-based cancer immunotherapy and related technologies. CureVac shareholders will receive approximately USD 5.46 in BioNTech ADSs per share, reflecting a 55% premium.


Research Methodology Framework and Report Scope
Market Definitions and Key Coverage
Our study defines the cancer therapy market as all branded and generic pharmacological agents that aim to halt or reverse malignant cell growth through chemotherapy, targeted small molecules, monoclonal antibodies, immuno-oncology agents, cell- and gene-based products, hormonal modulators, and adjunct radiopharmaceuticals. Routes of administration (intravenous, oral, sub-cutaneous, intratumoral) and end-user channels (hospitals, specialty clinics, homecare) are captured across every geography and tumor type.
Scope exclusions, such as diagnostics, screening tools, surgical instruments, and supportive care consumables, are kept outside the revenue base to avoid double counting.
Segmentation Overview
- By Therapy Type
- Chemotherapy
- Targeted Therapy
- Immunotherapy
- Hormonal Therapy
- Other Treatment Types
- By Cancer Type
- Blood Cancer
- Breast Cancer
- Prostate Cancer
- Gastrointestinal Cancer
- Gynecologic Cancer
- Respiratory/Lung Cancer
- Other Cancer Types
- By Route of Administration
- Intravenous
- Oral
- Subcutaneous
- Intratumoral
- By End User
- Hospitals
- Specialty Clinics
- Cancer And Radiation Therapy Centers
- Homecare Settings
- Geography
- North America
- United States
- Canada
- Mexico
- Europe
- Germany
- United Kingdom
- France
- Italy
- Spain
- Rest Of Europe
- Asia-Pacific
- China
- Japan
- India
- South Korea
- Australia
- Rest Of Asia-Pacific
- Middle-East And Africa
- GCC
- South Africa
- Rest Of Middle East And Africa
- South America
- Brazil
- Argentina
- Rest Of South America
- North America
Detailed Research Methodology and Data Validation
Primary Research
Mordor analysts interviewed practicing oncologists, hospital pharmacists, payor advisors, and regulatory reviewers across North America, Europe, Asia-Pacific, Latin America, and the Middle East. Conversations clarified real-world treatment mix shifts, average course pricing, biosimilar pick-up rates, and looming label expansions, letting us refine variables that rarely surface in public datasets.
Desk Research
We began with global cancer incidence and mortality files from WHO-IARC, SEER, and Eurostat, then layered in therapy approval logs from the US FDA, EMA, PMDA, and NMPA. Trade and pricing views were drawn from sources such as the Pharmaceutical Research and Manufacturers of America, IQVIA open-access dashboards, and national tender bulletins. Financial filings, investor decks, and press releases from over forty oncology-focused manufacturers sharpened our understanding of launch timelines and net sales trends. Finally, select paid intelligence feeds, such as D&B Hoovers for company revenues, Dow Jones Factiva for deal flow, and Questel for patent pulses, supplied additional validation points. These examples are illustrative; many other credible outlets informed our desk work.
Market-Sizing & Forecasting
We first constructed a top-down model that scales treated-patient pools from national cancer registries using therapy-line penetration, duration, and weighted average treatment cost. Results are corroborated with selective bottom-up checks, including sampled manufacturer sales, channel audits, and import records, before adjustments for parallel trade or compassionate use. Key model inputs include: 1) new-case incidence by tumor, 2) share of patients eligible for systemic therapy, 3) average selling price erosion from biosimilars, 4) uptake curves following major approvals, and 5) currency-adjusted healthcare spending per capita. Forecasts run through a multivariate regression that links these drivers to historic revenue, with scenario analysis assessing pipeline attrition and macroeconomic shocks. Data gaps in bottom-up rolls are bridged by regional analogs and expert consensus.
Data Validation & Update Cycle
Every draft output is stress-tested through variance checks versus national expenditure data and quarterly company disclosures. An internal peer review committee signs off only after anomalies are resolved, and reports refresh yearly, with interim updates triggered by landmark approvals, policy shifts, or material recall events.
Why Mordor's Cancer Therapy Baseline Inspires Confidence
Published values often diverge because firms pick different therapy baskets, apply varied price-erosion assumptions, or refresh their models on uneven cadences. By anchoring estimates on transparent treated-patient math and cross-checking with selective revenue rolls, we provide a dependable midpoint that decision-makers can trace back to verifiable statistics.
Key gap drivers include: some publishers mixing diagnostics and surgery revenue, others applying aggressive discount curves or conservative pipeline success odds, and still others converting currencies at static rates. Mordor Intelligence updates inputs every twelve months and folds in rolling regulatory wins, which keeps our baseline contemporary.
Benchmark comparison
| Market Size | Anonymized source | Primary gap driver |
|---|---|---|
| USD 243.62 B (2025) | Mordor Intelligence | - |
| USD 194.67 B (2024) | Global Consultancy A | excludes cell- and gene-based therapies; uses static USD exchange rates |
| USD 230.96 B (2025) | Industry Association B | blends chemotherapy devices with drugs; limited refresh cadence |
In short, while headline numbers differ, our step-wise approach, including patient incidence anchoring, timely variable refresh, and dual-path validation, yields a balanced, reproducible market view that clients can rely on for strategic planning.


Key Questions Answered in the Report
How large is the cancer therapy market at present?
The cancer therapy market size was USD 269.55 billion in 2026 and is forecast to reach USD 446.89 billion by 2031, growing at a 10.64% CAGR.
Which therapy type is expanding the quickest?
Cell and gene therapy is projected to grow at a 12.5% CAGR through 2031 as manufacturing scale and allogeneic platforms lower costs.
Which geographic region is advancing fastest?
Asia-Pacific leads growth with an 11.20% CAGR, driven by China's reimbursement expansions and India's biosimilar approvals.
What share do hospitals hold in delivery of oncology care?
Hospitals accounted for 62.40% of spending in 2025, though home-care channels are rising at 11.72% CAGR as payers push for lower-cost settings.
How significant are biosimilars to future pricing?
Biosimilars captured 29% of Avastin's U.S. volume within 18 months, and similar erosion across monoclonal antibody franchises is expected to intensify price competition.
Which companies dominate current sales?
Roche, Bristol Myers Squibb, Merck, AstraZeneca, and Novartis together held 38% of global revenue in 2025, reflecting moderate market concentration.
Page last updated on:


