
Market Overview
| Study Period | 2021 - 2031 |
|---|---|
| Forecast Data Period | 2026 - 2031 |
| Base Year Market Size (2025) | USD 42.01 Billion |
| Market Size (2026) | USD 44.05 Billion |
| Market Size (2031) | USD 55.82 Billion |
| Growth Rate (2026 - 2031) | 4.85 % |
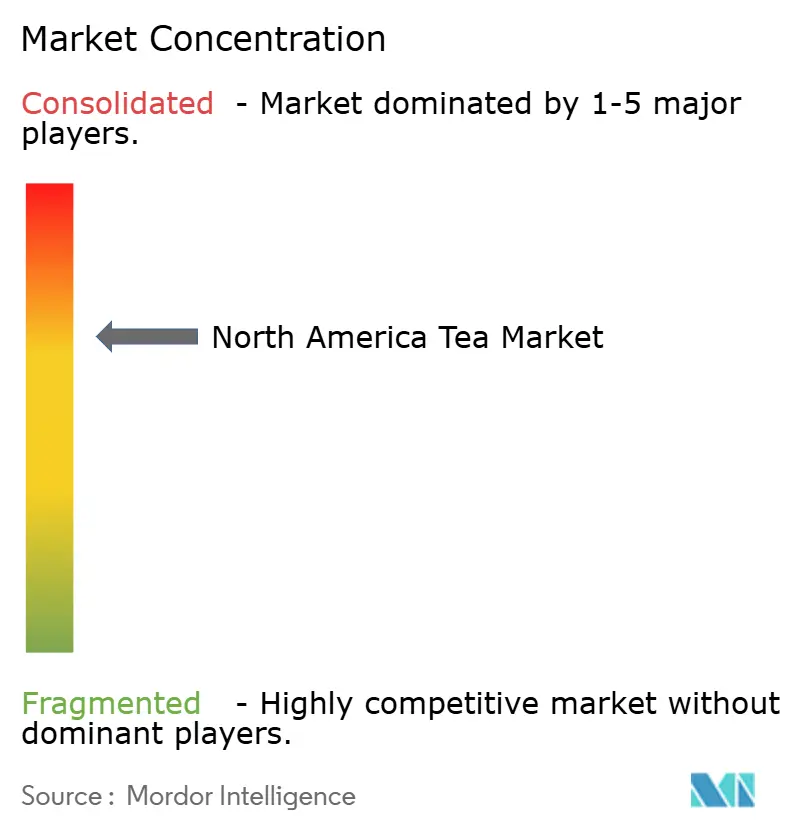
| Market Concentration | Medium |
Major Players
*Disclaimer: Major Players sorted in no particular order Image © Mordor Intelligence. Reuse requires attribution under CC BY 4.0. |
|
North America Tea Market Analysis by Mordor Intelligence
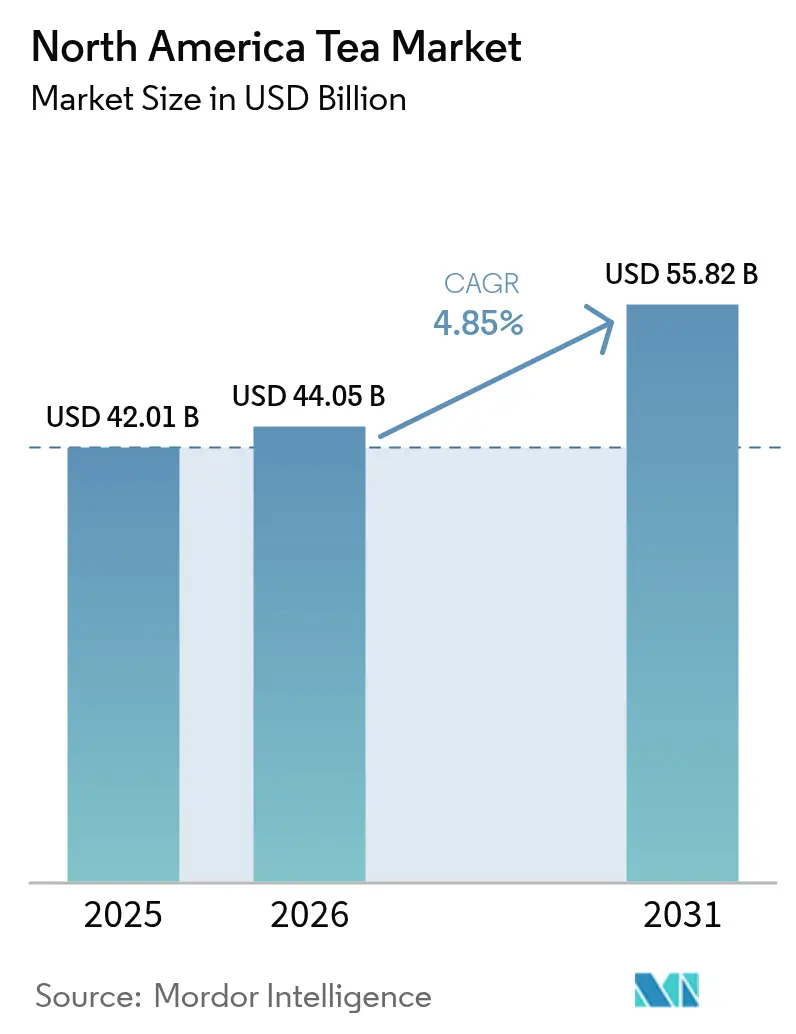
The North America tea market size was valued at USD 42.01 billion in 2025 and estimated to grow from USD 44.05 billion in 2026 to reach USD 55.82 billion by 2031, at a CAGR of 4.85% during the forecast period (2026-2031). The market continues to benefit from a structural shift toward health-conscious consumption, as consumers move away from sugary beverages to functional teas rich in bioactive compounds such as epigallocatechin gallate (EGCG) and L-theanine without artificial additives. Strong interest in green, herbal, and specialty teas, combined with flavor innovation, premiumization, and flexible packaging, underpins overall market growth. Market expansion is underpinned by premiumization trends, direct-to-consumer engagement, and evolving consumer lifestyles. Competitive intensity is moderate, with multinational conglomerates and specialty brands coexisting, leaving room for innovative entrants. Key market considerations include regulatory compliance, raw material price volatility, and competition from alternative beverages, all of which influence strategic positioning and growth opportunities.
Key Report Takeaways
- By form, ready-to-drink tea held 47.82% of the North America tea market share in 2025, whereas leaf tea is projected to grow at a 5.85% CAGR through 2031.
- By product type, black tea dominated with 70.05% revenue share in 2025; green tea is set to expand at a 6.27% CAGR between 2026 and 2031.
- By flavor, flavored offerings captured 55.25% of the North America tea market size in 2025 and are advancing at a 6.38% CAGR to 2031.
- By packaging type, flexible formats, tea bags, and pouches, captured 64.75% of regional revenue in 2025, whereas rigid containers, such as cans, bottles, and pods, are on track to post a 5.78% CAGR through 2031.
- By distribution channel, off-trade commanded 77.95% share of sales in 2025, while on-trade is the fastest-growing route at 6.08% CAGR over the same horizon.
- By country, the United States accounted for 81.25% of regional sales in 2025; Mexico leads growth at a 6.40% CAGR to 2031.
Note: Market size and forecast figures in this report are generated using Mordor Intelligence’s proprietary estimation framework, updated with the latest available data and insights as of 2026.
Market Trends and Insights
Drivers Impact Analysis of North America Tea Market*
| Driver | (~) % Impact on CAGR Forecast | Geographic Relevance | Impact Timeline |
|---|---|---|---|
| Expanding Consumer Emphasis on Health and Wellness | +1.2% | United States, Canada, with spillover to urban Mexico | Medium term (2-4 years) |
| Accelerating Adoption of Organic and Natural Product Offerings | +0.9% | United States, Canada | Medium term (2-4 years) |
| Escalating Demand for Premium and Specialty Tea Segments | +0.8% | United States (coastal metros), Canada (Toronto, Vancouver) | Long term (≥ 4 years) |
| Continuous Product Innovation and Portfolio Diversification | +0.7% | North America-wide, strongest in United States | Short term (≤ 2 years) |
| Growing Engagement in Experiential and Lifestyle-Oriented Tea Consumption | +0.5% | United States (urban centers), Canada | Medium term (2-4 years) |
| Strengthening Focus on Supply Chain Transparency and Sustainability Practices | +0.4% | United States, Canada | Long term (≥ 4 years) |
| Source: Mordor Intelligence | |||
Expanding Consumer Emphasis on Health and Wellness
Functional tea consumption is increasingly displacing sugar-sweetened beverages as consumers prioritize bioactive compounds over empty calories. This recommendation pertains to teas made from the Camellia sinensis plant, including varieties like green, black, white, and oolong, each containing under 5 calories per 12-ounce serving, establishing tea as a legitimate choice for supporting health. According to Census Bureau statistics, 159 million Americans drink tea every day, and research suggests that consuming just two cups daily can notably lower the likelihood of heart disease and diabetes[1]Source: United States Census Bureau, "National Hot Tea Month: January 2024", census.gov. Organic tea adoption continues to grow, as consumers associate certification with reduced pesticide residues and enhanced polyphenol content, reinforcing tea’s wellness positioning. The launch of herbal and adaptogenic blends featuring ingredients such as ashwagandha and rhodiola rosea targets stress management and immune support, particularly among millennials and Gen Z who increasingly view tea as a functional beverage rather than a traditional hot drink. Innovation in cold-brew, sparkling tea, and tea-infused energy formats is expanding convenience-focused consumption without compromising health credentials. Overall, the combination of regulatory guidance, clinical evidence, and consumer demand for functional wellness strengthens tea’s competitive position in the North American beverage market.
Accelerating Adoption of Organic and Natural Product Offerings
Major players in the tea industry are expanding organic and natural teas from niche offerings to mainstream products, driven by consumer preference for clean-label, pesticide-free beverages. USDA-certified organic teas, which adhere to National Organic Program standards prohibiting GMOs, synthetic chemicals, and irradiation, are commanding premium prices at retail while signaling credibility and wellness benefits. Brands are increasingly using natural flavoring systems, such as fruit extracts, essential oils, and botanical infusions, replacing artificial additives in response to clean-label mandates and FDA scrutiny. Certifications such as Rainforest Alliance and Fair Trade are often bundled with organic claims, reinforcing ethical sourcing, traceability, and sustainability to appeal to values-driven consumers[2]Source: Rainforest Alliance, “Sustainable Agriculture Standard,” rainforest-alliance.org. Specialty retail and e-commerce channels play a pivotal role in communicating these attributes, where storytelling and transparency enhance consumer trust and purchase intent. Overall, the convergence of organic, natural, and sustainable certifications is redefining premium tea positioning in North America, aligning wellness, ethical sourcing, and environmental responsibility with market growth.
Escalating Demand for Premium and Specialty Tea Segments
Rising interest in single-origin, small-batch, and artisanal teas is reshaping the North American market, as affluent consumers seek provenance, craft narratives, and sensory complexity reminiscent of specialty coffee. Leaf teas, valued for whole-leaf integrity and multiple infusions, are gaining traction among enthusiasts who prioritize brewing quality over mass-market convenience. Specialty retailers such as Harney & Sons and Republic of Tea are expanding subscription offerings that include curated seasonal selections, detailed tasting notes, and brewing guidance, fostering customer loyalty and repeat engagement. Imports of Japanese matcha and Chinese oolong have surged as consumers deepen their understanding of processing methods, cultivar characteristics, and ceremonial traditions, positioning tea as a cultural experience rather than a commodity. Innovations in cold-brew concentrates and nitro-infused tea at cafés and bars are broadening tea consumption occasions, reaching moments traditionally dominated by coffee or alcoholic beverages. This premiumization movement is particularly strong in urban coastal regions, where higher disposable incomes, culinary awareness, and wellness-oriented lifestyles support elevated pricing and immersive retail formats. Collectively, these developments reinforce premium and specialty teas as a high-growth segment in North America, driven by education, craft, and experiential consumption.
Continuous Product Innovation and Portfolio Diversification
Tea brands are increasingly introducing functional blends that incorporate probiotics, collagen peptides, and nootropics to target specific wellness benefits beyond traditional antioxidant effects. In 2024, Nestlé launched Nescafé Dolce Gusto Chai Tea Latte pods, leveraging its single-serve machine network to extend tea consumption into households traditionally dominated by coffee. Stash Tea also introduced latte concentrate pouches, enabling consumers to prepare café-style beverages at home without specialized equipment, capturing demand previously served by out-of-home channels. Ready-to-drink innovation is expanding rapidly, with sparkling teas, low-sugar formulations, and botanical blends competing directly with kombucha and other functional beverages in refrigerated sections. Packaging developments, such as compostable tea bags made from plant-based fibers, address growing concerns over microplastic leaching from conventional sachets. Flavor exploration is also broadening, with adventurous profiles like turmeric-ginger, mushroom-reishi, and hibiscus-chili complementing classic notes to appeal to consumers seeking novel experiences. These ongoing product introductions and experiential innovations are critical for attracting younger, experimentation-driven tea drinkers, sustaining trial, and enhancing visibility in a competitive marketplace.
Restraints Impact Analysis of North America Tea Market*
| Restraint | (~) % Impact on CAGR Forecast | Geographic Relevance | Impact Timeline |
|---|---|---|---|
| Volatility in Raw Material Pricing and Supply Chain Disruptions | -0.8% | North America, with particular impact on premium segments | Short term (≤ 2 years) |
| Intensifying Competitive Pressure from Alternative Beverage Categories | -0.6% | North America, strongest in the United States market | Medium term (2-4 years) |
| Stringent Regulatory Compliance and Labeling Requirements | -0.3% | United States and Canada, FDA and Health Canada compliance | Medium term (2-4 years) |
| Environmental and Sustainability Risks in Tea Cultivation | -0.4% | Global impact affecting North American supply chains | Long term (≥ 4 years) |
| Source: Mordor Intelligence | |||
Volatility in Raw Material Pricing and Supply Chain Disruptions
The North American tea industry continues to face notable challenges from fluctuating commodity prices and a highly sensitive supply chain. Environmental disruptions, including droughts in Kenya, floods in Assam, and frost in China’s high-altitude tea regions, are creating instability in global supply and complicating procurement planning. Fertilizer shortages and geopolitical disruptions in key producing countries are further constraining production and elevating input costs for tea estates that rely on synthetic nutrients. Shipping delays and rerouted maritime logistics have added time and cost pressures, affecting landed prices and operational efficiency for importers[3]Source: FAO, “Current Market Situation and Medium-Term Outlook for Tea,” fao.org. Currency volatility also introduces financial risk, as production expenses are incurred in local currencies while imports are invoiced in U.S. dollars, impacting profitability for brands with limited hedging strategies. These supply-side pressures disproportionately affect value-oriented segments, where consumer sensitivity limits price adjustments, while reinforcing the strategic importance of diversified sourcing, sustainable production, and premium positioning in the North American tea market.
Intensifying Competitive Pressure from Alternative Beverage Categories
Tea faces stiff competition for consumer attention from cold-brew coffee, kombucha, functional waters, energy drinks, and plant-based protein beverages, all of which occupy a significant portion of the North American retail beverage market. Coffee’s entrenched role in morning routines and workplace habits continues to limit tea’s adoption, as FAO data indicate a gradual decline in tea consumption in recent years due to shifting preferences toward bottled water and carbonated drinks. Energy drinks appeal to consumers seeking rapid alertness, while kombucha and functional waters offer targeted wellness benefits such as probiotics, electrolytes, and vitamins, giving them a perceived edge in health positioning. Shelf space limitations in supermarkets and convenience stores further restrict tea’s visibility and trial opportunities, intensifying the competitive pressures faced by brands. Younger consumers show lower engagement with traditional tea formats, favoring carbonation, sweetness, and bold flavors that are less typical in conventional offerings. As a result, tea brands must innovate across taste, format, and functional claims to maintain relevance and defend market share against alternative beverages that capture incremental consumption occasions and consumer spending
*Our forecasts treat driver/restraint impacts as directional, not additive. The impact forecasts reflect baseline growth, mix effects, and variable interactions.
North America Tea Market Segment Analysis
By Form:
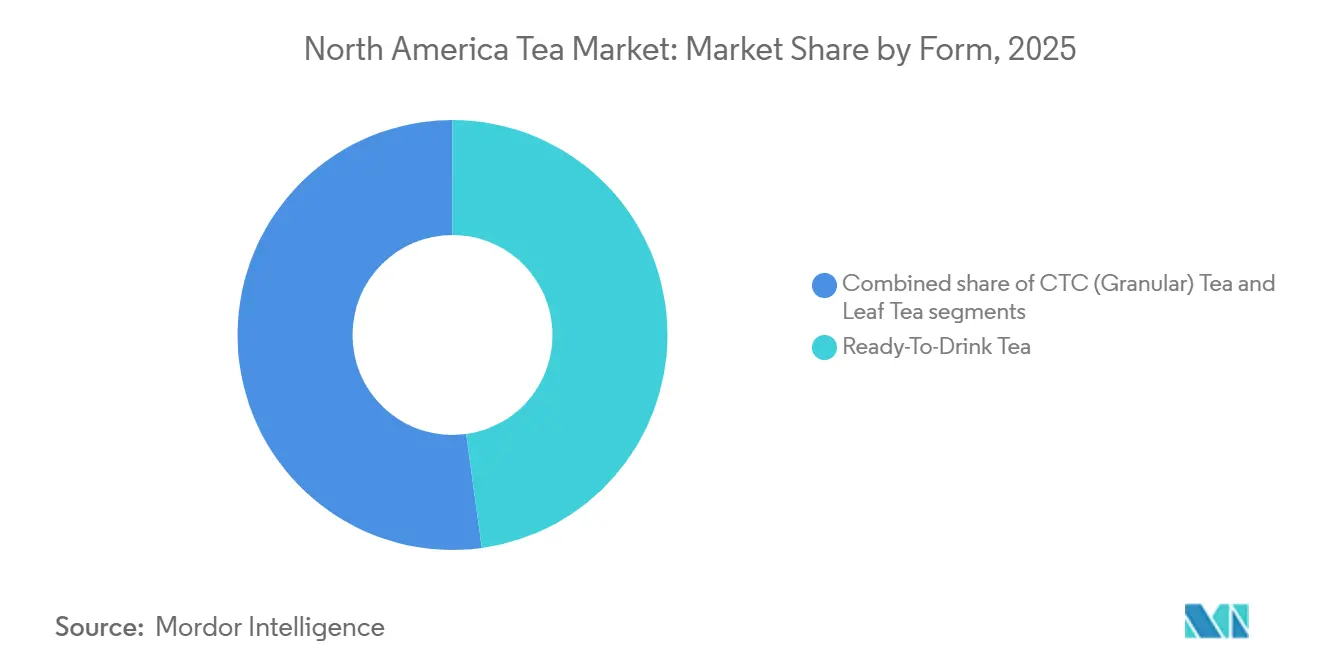
Convenience Drives RTD, Craft Fuels Leaf GrowthThe ready-to-drink (RTD) tea segment accounted for a significant 47.82% market share in 2025, reflecting strong consumer preference for grab-and-go convenience. In contrast, the leaf tea segment is projected to achieve a strong 5.85% CAGR through 2031, fueled by premiumization trends and enthusiasts who prioritize whole-leaf quality, multiple infusions, and intricate flavor profiles unavailable in mass-market tea bags. CTC (crush-tear-curl) granular teas continue to serve the value-oriented and foodservice segments, where rapid brewing and consistent strength are paramount, though growth is limited by the migration toward premium formats. RTD product innovation is accelerating through sparkling variants, reduced-sugar formulations, and functional blends incorporating botanicals, adaptogens, and probiotics to compete with kombucha and other functional beverages in refrigerated channels. Leaf tea’s resurgence is particularly evident in specialty retail and e-commerce, where direct-to-consumer subscription services provide curated seasonal offerings, detailed tasting notes, and brewing guidance that foster loyalty and repeat engagement. Collectively, these dual trends highlight a market trajectory where convenience-oriented RTD products coexist with a growing appetite for premium, experiential leaf teas.



By Product Type:
Black Tea Dominance Meets Green Tea AccelerationBlack tea holds a commanding 70.05% share of the market in 2025, reflecting its entrenched position driven by strong consumer preferences. On the other hand, green tea is gaining momentum with a 6.27% CAGR, driven by increasing consumer focus on wellness and the adoption of functional beverages. Herbal teas attract consumers seeking caffeine-free options with functional benefits from ingredients like chamomile, peppermint, rooibos, and hibiscus, though growth faces competition from other wellness beverages offering concentrated botanical extracts. Niche varieties such as oolong, white, yellow, and pu-erh teas are gaining interest among connoisseurs who value intricate processing, terroir, and aging potential, similar to specialty coffee and fine wine enthusiasts. Japanese matcha imports surged as consumers explored ceremonial-grade distinctions, umami flavor profiles, and culinary applications in lattes, smoothies, and baked goods. Chinese oolong and Taiwanese high-mountain teas are expanding in specialty retail, where provenance storytelling and limited-edition releases support premium pricing. This diversification of tea types reflects rising consumer sophistication and willingness to explore beyond traditional black tea, creating opportunities for brands that invest in education, sampling, and immersive experiences.
By Flavor Profile:
Unflavored Gains as Wellness Prioritizes PurityThe flavored tea segment accounted for a 55.25% market share in 2025 and is projected to achieve a robust 6.38% CAGR through 2031. Tea flavor innovation is increasingly drawing inspiration from specialty coffee, moving from simple flavorings toward origin-focused, cultivar-specific expressions that highlight processing techniques. Natural flavor systems derived from fruit extracts, essential oils, and botanical infusions are replacing artificial additives, reflecting clean-label initiatives and regulatory scrutiny under FDA FSMA guidelines. Savory and functional profiles, including turmeric-ginger, mushroom-reishi, and hibiscus-chili, are gaining traction among consumers seeking global culinary influences and targeted wellness benefits beyond traditional antioxidant claims. Unflavored tea growth is concentrated in premium loose-leaf formats and specialty retail, where informed consumers prioritize transparency, brewing control, and the flexibility to craft personalized blends. Brands that balance widely appealing flavored teas with authentic, unflavored offerings are well-positioned to capture both mainstream and connoisseur segments within the evolving North American market.
By Packaging Type:
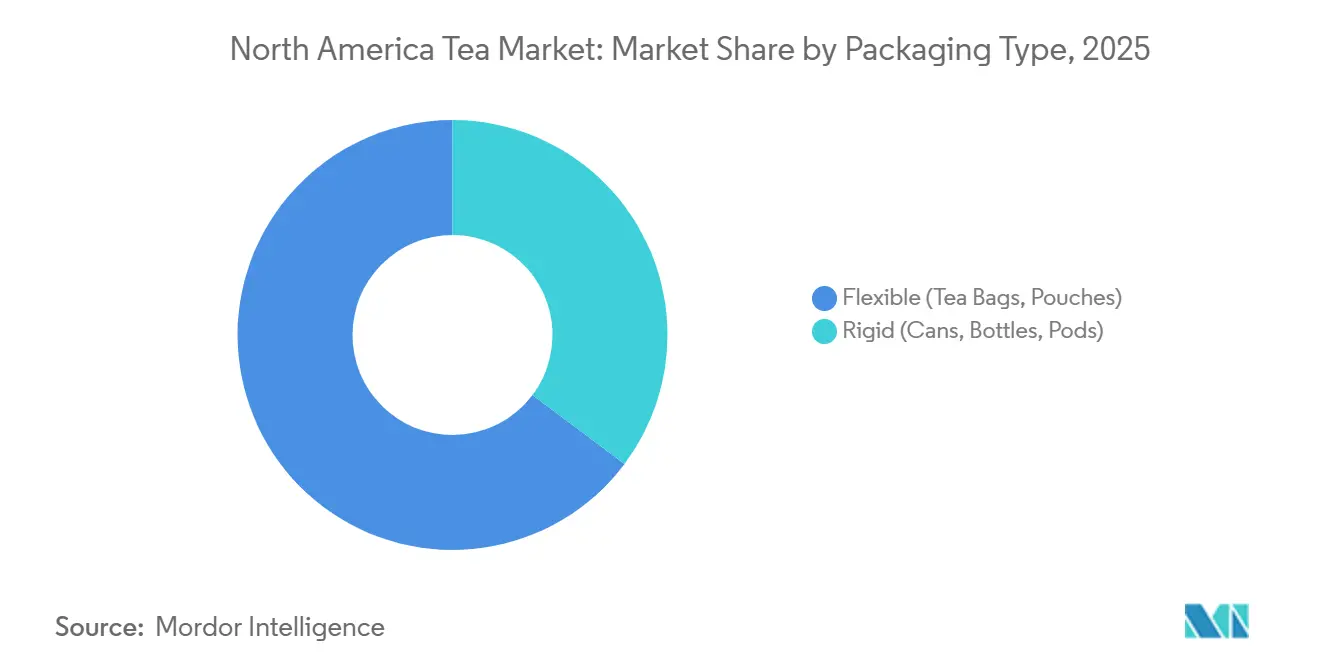
Flexible Leads, Rigid Innovates for SustainabilityIn 2025, flexible packaging, including tea bags and pouches, holds a significant 64.75% market share, driven by its advantages in convenience, portion control, and cost efficiency across retail channels. On the other hand, rigid packaging demonstrates a robust 5.78% CAGR, supported by advancements in cans, bottles, and pods that enhance premium positioning and extend shelf life. Packaging innovation in the tea industry continues to tackle sustainability challenges while maintaining product quality and addressing consumer demand for convenience. Regulatory frameworks for tea bag filter paper, including guidelines under 21 CFR Section 176.170, ensure food contact safety and foster development of biodegradable solutions. Companies are increasingly adopting eco-conscious materials such as FSC-certified paper, compostable PLA, and alginate-based alternatives to reduce microplastic exposure linked to conventional tea bags. Global regulations, including the EU’s Single-Use Plastics Directive, are shaping corporate packaging strategies, encouraging harmonization of sustainable materials across markets. Innovations in rigid formats, such as reusable and recyclable single-serve pods, illustrate how brands can combine convenience with environmental responsibility while minimizing waste. These initiatives reinforce sustainability as a core component of product design, supporting both consumer expectations and regulatory compliance in the North American tea market.
By Distribution Channel:
Off-Trade Scale Versus On-Trade ExperienceOff-trade distribution holds a commanding 77.95% market share in 2025, underscoring its dominance across supermarkets, specialty stores, and online channels. In contrast, on-trade exhibits a robust 6.08% CAGR, as operators introduce experiential tea ceremonies, nitro-infused cold brews, and botanical blends that command premium pricing and differentiate menus in saturated beverage markets. Supermarkets and hypermarkets continue to dominate the off-trade segment, offering extensive assortments, promotional activities, and private-label alternatives that intensify competition for branded products. Specialty retailers, including independent tea shops and established brands such as DAVIDsTEA, provide curated selections, knowledgeable staff, and sampling experiences that encourage trial and education, though high operating costs and e-commerce pressures can limit profitability. Online retail is the fastest-growing channel, enabling direct-to-consumer subscriptions, personalized recommendations, and access to niche and artisanal brands not typically available in physical stores. Convenience and grocery outlets capture impulse purchases and immediate consumption occasions, particularly favoring single-serve ready-to-drink formats over bulk leaf teas. On-trade tea service is evolving with professionalized offerings, including tea sommeliers, tasting flights, and visually engaging presentations that position tea as a social and aspirational beverage. Brands that successfully integrate omnichannel distribution, balancing mass-market reach, premium experiences, and digital engagement, are poised to secure a larger share of the bifurcated North American tea consumer base
Geography Analysis
United States Tea Market
The United States is the largest contributor to North America's tea market, accounting for 81.25% of the market share in 2025. Tea consumption in the United States is shaped by entrenched coffee-shop programs, widespread supermarket availability of established brands, and the prevalence of ready-to-drink (RTD) teas in convenience stores and vending channels. Iced tea traditions remain particularly strong in Southern states, while coastal metropolitan regions demonstrate higher adoption of premium and specialty teas. Regulatory compliance under the FDA’s Food Safety Modernization Act is raising operational costs for importers, emphasizing preventive controls, hazard analysis, and traceability, which tends to favor larger players with established quality systems. E-commerce growth is reshaping distribution, as direct-to-consumer subscriptions and online marketplaces capture share from specialty brick-and-mortar retailers.
Canada Tea Market
Canada maintains a smaller share of the North American market but shows premiumization trends similar to U.S. coastal regions, particularly in Toronto, Vancouver, and Montreal. Strong adoption of organic, Fair Trade, and specialty teas is complemented by Health Canada oversight of EGCG content in concentrated green tea extracts, prompting reformulation and clearer labeling to ensure safety. Bilingual labeling requirements add regulatory complexity and cost for U.S. brands entering the Canadian market, though cultural similarities facilitate smoother entry relative to Mexico. Indigenous tea consumption remains limited, but immigration from South Asia, East Asia, and the Middle East is diversifying preferences and driving demand for ethnic tea formats.
Mexico Tea Market
Mexico demonstrates significant potential with a compound annual growth rate of 6.40%, reflecting its emerging market dynamics. Expanding middle-class populations in Mexico City, Guadalajara, and Monterrey are fueling demand for branded, packaged teas that emphasize modernity and wellness. U.S. cultural influence, through media, tourism, and cross-border retail, is introducing formats such as iced tea, chai lattes, and RTD products that were previously niche. Regulatory requirements under COFEPRIS, including Spanish-language labeling, nutritional declarations, and substantiation of health claims, add complexity and compliance costs for foreign entrants. Local producers are creating regionally adapted teas using ingredients such as hibiscus (jamaica), cinnamon, and tamarind, blending traditional flavors with contemporary formats to appeal to domestic consumers.
Regulatory Landscape
In the United States, tea is regulated as a food under FDA oversight, with compliance obligations spanning preventive controls and labeling. A key labeling catalyst is the FDA rule defining the implied nutrient content claim "healthy" (effective February 25, 2025), under which water, tea, and coffee with less than 5 calories per reference amount customarily consumed can qualify, strengthening the role of unsweetened tea in front-of-pack messaging. Separately, FDA set January 1, 2028 as the uniform compliance date for food labeling regulations published between January 1, 2025 and December 31, 2026, creating a clear planning horizon for label updates across packaged tea and RTD portfolios.
In Canada, Health Canada frameworks shape formulation and communication for tea products that add caffeine or other ingredients and for products with higher nutrient levels. The Supplemented Foods Regulations set requirements such as a Supplemented Food Facts table (SFFt) for supplemented products (including certain caffeinated tea-based beverages), while mandatory front-of-package nutrition symbol labeling applies to prepackaged foods exceeding specified thresholds for saturated fat, sugars, or sodium. For cross-border brands, these rules add compliance steps alongside bilingual labeling and product classification considerations at the food versus natural health product interface.
Value Chain Analysis
The North America tea value chain is structurally import-dependent, with negligible domestic tea-leaf production, so upstream exposure to global growing regions, climate events, and freight conditions functions as a core operating variable. The chain starts with international tea estates and processors, then moves to importers and brokers managing quality, compliance, and customs, before reaching regional blending, flavoring, and packaging operations that tailor black, green, herbal, and specialty offerings to local taste and regulatory needs. Finished products flow from brand owners into distributors and retailers, with off-trade channels anchoring volume while foodservice and on-trade formats increasingly support premium and more experiential positioning.
In North America, value capture tends to concentrate in blending, formulation, packaging, and distribution infrastructure located near major logistics corridors and consumption centers in the United States and Canada. Examples of in-region capabilities include Blue Ocean Group manufacturing and warehousing in British Columbia, The Metropolitan Tea Company's FDA-registered manufacturing and blending facility in Toronto, and Wollenhaupt Tea North America's Seattle business center coordinating logistics interfaces. Pinch points include commodity and currency volatility, packaging-material requirements for food contact, and the need for robust traceability and preventive controls under FDA and Health Canada expectations, which can favor larger operators or specialized co-manufacturing partners.
Competitive Landscape
The North American tea market exhibits moderate consolidation, with major multinationals such as Nestlé, PepsiCo, and Keurig Dr Pepper holding significant market share through diversified portfolios, extensive distribution networks, and large-scale marketing operations. Companies are expanding portfolios, investing in sustainability certifications, and leveraging ESG initiatives to appeal to values-driven consumers.
Direct-to-consumer channels and subscription models allow smaller brands to bypass traditional retail and build loyal followings. Functional formats with adaptogens, nootropics, and probiotics present white-space opportunities. Technology adoption, including blockchain-enabled traceability, provides consumers with transparency on cultivation practices, harvest dates, and environmental impact, addressing demand for radical supply chain visibility.
Innovation in single-serve pods is expanding tea penetration in coffee-dominated households, though environmental concerns are driving investment in compostable alternatives that balance convenience with sustainability. Emerging disruptors, including startups offering adaptogenic lattes, CBD-infused teas, and nootropic blends, are attracting investor interest and blurring traditional category boundaries. While incumbents benefit from established distribution, brand recognition, and R&D resources, younger consumers’ lower brand loyalty and willingness to explore niche offerings through social media, influencers, and subscription boxes present a challenge. Companies that successfully integrate scale efficiencies with premium authenticity, leveraging agile product development, data-driven insights, and omnichannel distribution, are poised to capture disproportionate share in a bifurcated market where mass convenience and craft premiumization coexist.
North America Tea Industry Leaders
-
Keurig Dr Pepper Inc.
-
Nestlé SA
-
PepsiCo, Inc.
-
Arizona Beverages USA
-
R.C. Bigelow, Inc.
- *Disclaimer: Major Players sorted in no particular order
North America Tea Market Companies Covered in this Report
- Keurig Dr Pepper Inc.
- Nestlé SA
- PepsiCo, Inc.
- Hain Celestial Group Inc.
- Arizona Beverages USA
- Tata Consumer Products
- R.C. Bigelow, Inc.
- William B. Reily & Company (Luzianne)
- Ito En Ltd.
- Bettys & Taylors Group
- DavidsTea Inc.
- Red Diamond, Inc.
- Starbucks Corp. (Teavana)
- Rishi Tea & Botanicals
- Harney & Sons Fine Teas
- The Republic of Tea
- Sound Beverages LLC
- Planting Hope Company Inc. (Argo Tea)
- Stash Tea Co.
- East West Tea Company, LLC

Market Opportunities and Future Outlook
Labeling and formulation pathways create actionable whitespace for unsweetened and low-calorie teas, especially in the United States, where teas meeting the FDA "healthy" claim criteria (effective February 25, 2025) can strengthen shelf signaling versus sugar-sweetened alternatives. In Canada, the Supplemented Foods Regulations provide a defined route for compliant caffeinated tea-based beverages using a Supplemented Food Facts table (SFFt), enabling brands to compete in functional refreshment while operating within clear compositional and labeling guardrails.
Regional manufacturing and distribution investments point to opportunities linked to domestic capacity, cold-chain logistics, and faster innovation cycles in RTD and functional formats. Bigelow Tea began construction of a 265,000-square-foot production, packaging, and distribution facility in Louisville, Kentucky (September 2024, investment cited as over USD 70 million), while Milo's Tea Company expanded its footprint with a fourth manufacturing and distribution facility in Spartanburg, South Carolina (April 2025), and later opened a 150,000-square-foot distribution center in Alabama (July 2026). On the functional and specialty side, capacity additions including Caraway Tea Company's expanded facility in Poughkeepsie, New York (May 2026), with multiple pyramid tea bag and iced tea bag lines, show execution momentum behind sleep, stress, and benefit-led herbal blends, aligning with the premiumization and clean-label demand visible in North American retail and e-commerce.
Recent Industry Developments in North America Tea Market
- April 2026: PepsiCo and the Pepsi Lipton Tea Partnership launched Pure Leaf Mental Focus, a sparkling brewed iced tea line featuring naturally occurring caffeine from black tea and added L-theanine, with nationwide availability beginning in April 2026. The launch advances functional positioning within mainstream RTD tea, raising competitive intensity around benefit-led claims and ingredient differentiation in refrigerated and shelf-stable sets.
- August 2025: Keurig Dr Pepper Canada completed the rollout of Nestea in ready-to-drink format across Canada, supported by the Nothings Like Nestea marketing campaign. The expanded availability strengthens Keurig Dr Peppers reach in Canadian RTD tea through established brand equity and scaled distribution.
- November 2024: Keurig Dr Pepper introduced Snapple Zero Sugar Peach Tea in fountain-dispensed formats at participating 7-Eleven, Speedway, and Stripes stores, marking the first time a Snapple tea beverage was offered as a fountain drink. This extends RTD tea brands into high-traffic convenience retail dispense, broadening trial and consumption occasions beyond packaged formats.


North America Tea Market Report Scope and Research Methodology
Market Definition and Coverage
For this study, the North America tea market is defined as the value of tea sold for consumption across key formats, including leaf tea, CTC granular tea, and ready-to-drink tea, across the United States, Canada, Mexico, and the rest of North America.
Scope exclusions: This sizing excludes adjacent beverages and ingredients that are not sold as tea (for example, coffee, cocoa, and standalone botanical extracts).
Segments Covered in This Report
-
By Form
- Leaf Tea
- CTC (Granular) Tea
- Ready-To-Drink Tea
-
By Product Type
- Black Tea
- Green Tea
- Herbal Tea
- Other(Yellow tea, oolong, white teas and others)
-
By Flavor Profile
- Unflavored
- Flavored
-
By Packaging Type
- Flexible (Tea Bags, Pouches)
- Rigid (Cans, Bottles, Pods)
-
By Distribution Channel
- On-Trade
-
Off-Trade
- Supermarkets/Hypermarkets
- Specialty Stores
- Convenience/Grocery Stores
- Online Retail Stores
- Other Distribution Channels
-
By Country
- United States
- Canada
- Mexico
- Rest of North America
Data Sources, Market Sizing, and Validation
Desk Research
Desk research helped us set the starting boundaries of the tea market, align definitions across countries, and collect anchors for imports, retail activity, and consumption patterns before modeling. We referenced public statistics and documents such as USDA data, USITC trade and tariff tables, Statistics Canada releases, and Mexico trade statistics, and used them to directionally cross-check tea import flows and category movements.
To further ground the inputs, we also reviewed sources such as peer-reviewed food and nutrition journals, association and standards websites relevant to tea and packaged beverages, company filings and investor decks, and reputable business press coverage. In a few cases, we also used paid subscriptions for company financials and intelligence, news and financials, patent databases, and shipment-level import and export data to validate market structure and pricing logic. The desk sources listed here are illustrative only, and many other public and paid sources were also used for data collection, validation, and clarification.
Primary Interviews and Surveys
Primary work was used to convert desk signals into usable sizing inputs, especially where public data did not break out results by format, channel, or pricing ladder. We spoke with a mix of brand owners, distributors, retail-facing stakeholders, and industry specialists across the United States, Canada, and Mexico, so assumptions on share shifts, format mix, and price realization could be checked and refined.
Distribution of primary research fieldwork respondents
| Company type | Respondent position |
|---|---|
| Top tier: 25% | CXOs: 12% |
| Mid tier: 59% | Functional/Unit leaders: 41% |
| Smaller Players: 16% | Managers: 47% |
Market-Sizing & Forecasting
The market was built using a top-down approach where packaged beverage and tea category signals were reconstructed into a North America value pool, then split by format and channel based on observed mix and expert feedback. To keep totals realistic, selective bottom-up checks were also run, such as sampled price per unit multiplied by estimated volumes for key formats, plus channel checks to confirm that mix shifts were not overstated.
Inputs that mattered most included format mix across leaf, CTC, and ready-to-drink tea, retail and foodservice channel shares (on-trade versus off-trade), import volumes and unit values as directional pricing signals, packaging shifts that affect average selling prices, and consumer preference changes toward herbal and functional blends. Where data was missing at a sub-country level, gaps were handled by using proxy indicators from trade flow shares, retail footprint patterns, and expert-agreed distribution weights, which were then rechecked against full-country totals.
For forecasting, we used scenario analysis supported by a short set of driver assumptions that experts could validate without overfitting. These included expected pricing progression, channel mix movement, and premiumization trends by format. The forecast path was then reviewed against independent category growth signals to ensure it stayed consistent with what market participants were seeing in the near term.
Data Validation & Update Cycle
Outputs were validated through triangulation across independent signals, including trade direction, channel performance cues, and implied price ranges by format. When the model produced abrupt jumps or dips, assumptions were reviewed step by step, and respondents were re-contacted if the variance could not be explained by a clear market event or a definitional boundary.
Before sign-off, the work goes through multiple analyst reviews where inputs, formulas, and country splits are checked, followed by a final reasonableness scan against the latest public releases. Reports are refreshed annually, with interim updates when material events can change pricing or demand, and a fresh final pass is completed right before delivery so clients receive the latest updated view.
Mordor Intelligence's North America Tea Market Size Measured Against Other Published Estimates
Published market sizes for tea in North America often do not match because the market boundary is not consistent across studies, and the same word, tea, can be counted differently by format, channel, and pricing level. Differences also show up when one estimate uses retail value, another uses manufacturer revenue, or when ready-to-drink tea is treated as a separate beverage market.
By tracking format level mix (leaf, CTC, and ready-to-drink), checking on-trade versus off-trade value splits, and refreshing currency timing and price ladders, Mordor Intelligence keeps the modeled value tied to an explicit tea demand pool, which reduces over-counting from adjacent drink categories.
Benchmark comparison
| Source | Market Size | Gaps in Research Methodology |
|---|---|---|
| Mordor Intelligence | USD 42.01 B (2025) | |
| Industry Dataset A | USD 8.07 B (2024) | This estimate appears to apply a narrower definition that likely centers on packaged tea (often excluding ready-to-drink tea or counting it under a separate RTD beverage bucket), which compresses the total value when compared to a full format-inclusive scope. |
| Publisher B | USD 8.10 B (2024) | The reported level suggests a different valuation point (for example, manufacturer-level revenue or a limited set of channels), and the year base and price assumptions are not transparent enough to reconcile format and channel mix shifts. |
The spread in the table is mostly explained by how ready-to-drink tea and channel value capture are treated, and whether the number reflects a consumer spend view or a narrower revenue view. When scope and valuation points are made explicit and then checked against trade, pricing, and channel signals, the resulting market size becomes easier to replicate and to use for planning decisions.


Key Questions Answered in the Report
How large is the North America tea market in 2026?
The market is valued at USD 44.05 billion in 2026, with a forecast CAGR of 4.85% through 2031.
Which tea form sells the most across North America?
Ready-to-Drink formats lead, representing 47.82% of regional revenue in 2025.
What flavor segment is growing fastest?
Flavored teas are expanding at a 6.27% CAGR, propelled by ongoing innovation and functional pairings.
Which country offers the highest tea market growth potential?
Mexico leads with a projected 6.40% CAGR through 2031, despite its smaller current base.
Page last updated on:


 Your data is secure and never sold or shared.



