Green Tea Market Size and Share
Market Overview
| Study Period | 2021 - 2031 |
|---|---|
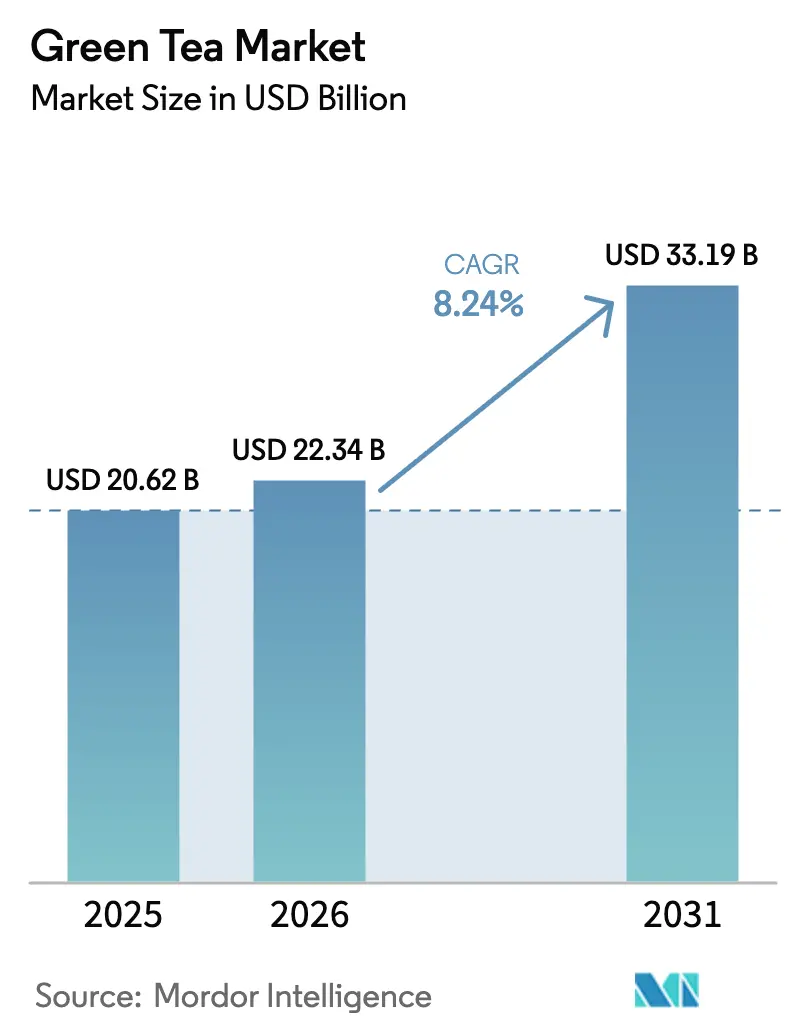
| Market Size (2026) | USD 22.34 Billion |
| Market Size (2031) | USD 33.19 Billion |
| Growth Rate (2026 - 2031) | 8.24% CAGR |
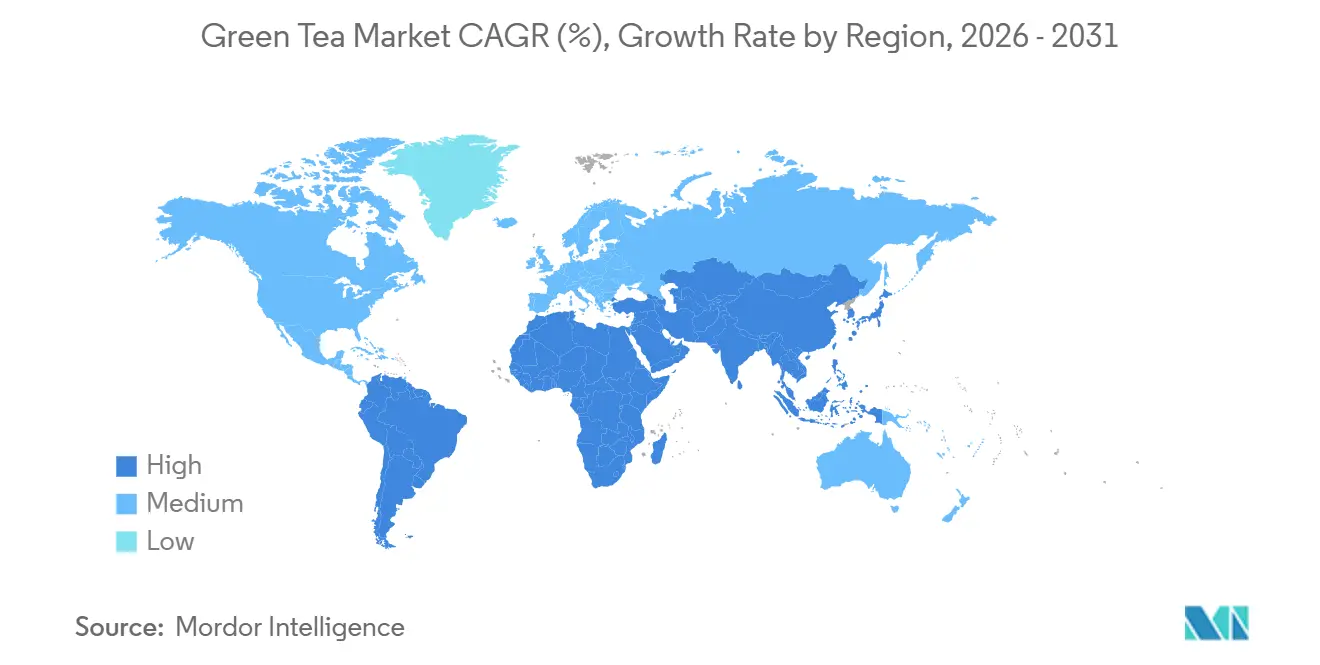
| Fastest Growing Market | South America |
| Largest Market | Asia Pacific |
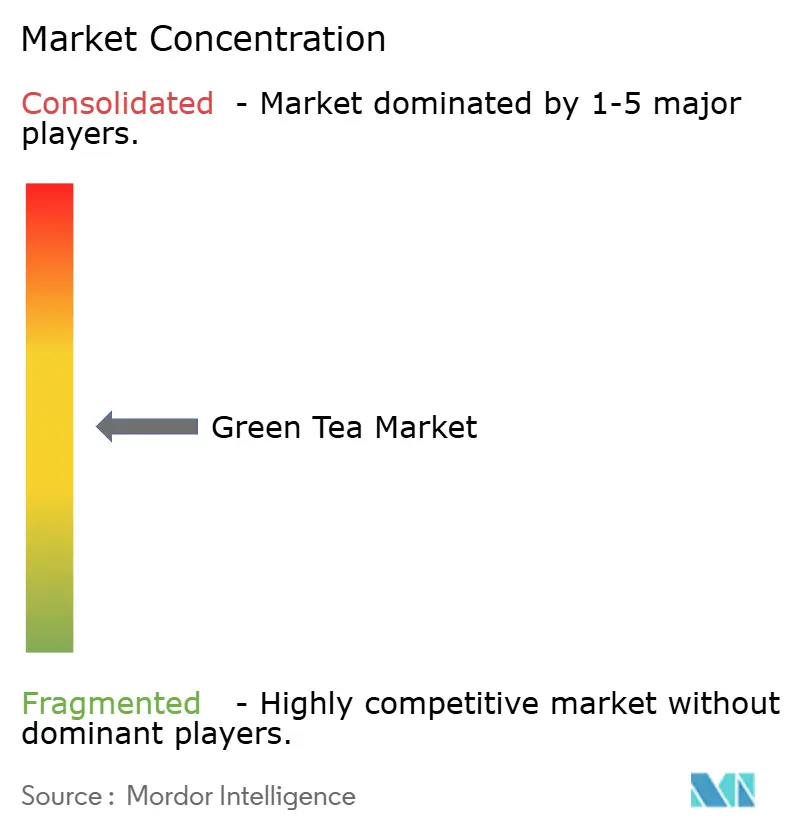
| Market Concentration | Medium |
Major Players
*Disclaimer: Major Players sorted in no particular order Image © Mordor Intelligence. Reuse requires attribution under CC BY 4.0. |
|
Green Tea Market Analysis by Mordor Intelligence
The green tea market size is expected to increase from USD 20.62 billion in 2025 to USD 22.34 billion in 2026 and reach USD 33.19 billion by 2031, growing at a CAGR of 8.24% over 2026-2031. Urbanization, increasing clinical evidence on catechins, and the combination of convenience with functionality are gradually shifting beverage spending toward fortified green tea formats. While conventional products are expected to dominate revenue in 2025, the premium-priced organic segment is experiencing the fastest growth. This growth is driven by factors such as certification, microplastic-free packaging, and transparent supply chains, which appeal to wellness-focused Millennials. The Asia-Pacific region continues to lead in both production and consumption; however, South America is now recording the highest incremental growth. This growth is primarily driven by Brazil’s expanding middle class and the rising adoption of matcha in Argentina. Key growth opportunities are concentrated in ready-to-drink (RTD) products fortified with adaptogens and probiotics, online direct-to-consumer (DTC) channels supported by rapid-delivery logistics, and sustainable packaging solutions that comply with single-use plastic regulations.
Key Report Takeaways
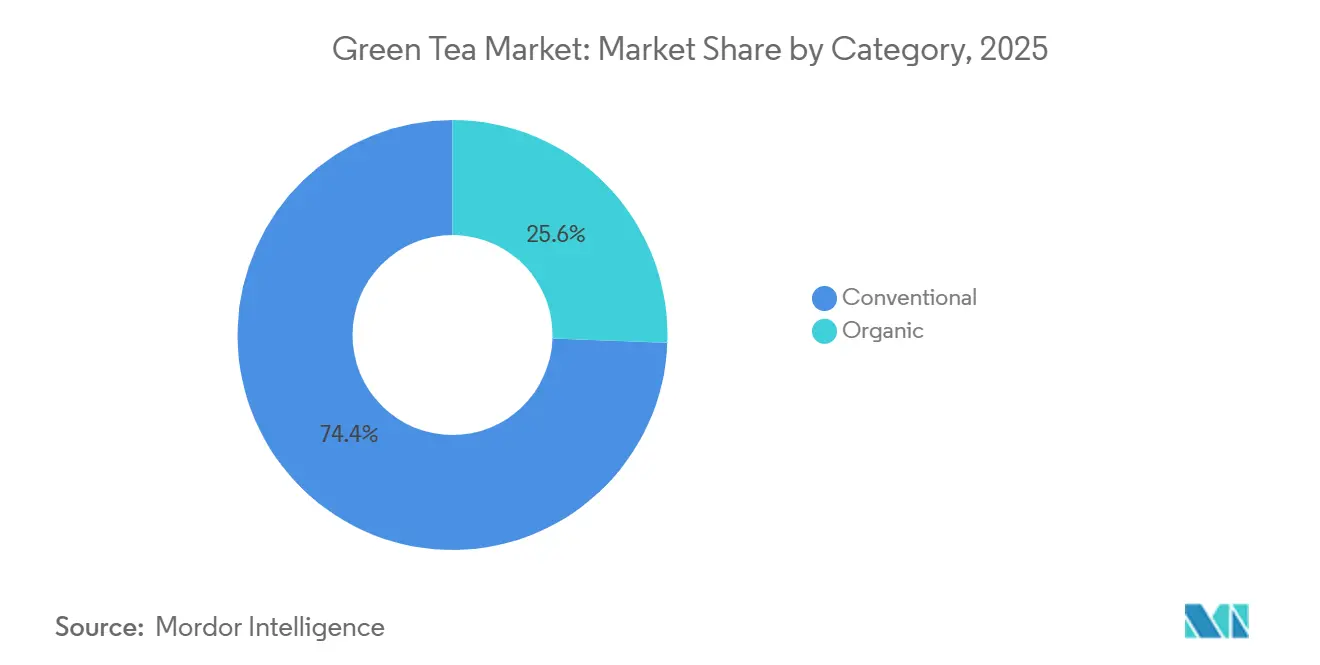
- By category, conventional green tea led with 74.43% revenue share in 2025, whereas organic green tea is projected to advance at an 8.94% CAGR through 2031.
- By flavor type, unflavored variants held 56.53% share of the Green Tea market size in 2025, whereas flavored green tea is expected to climb at 9.32% CAGR through 2031.
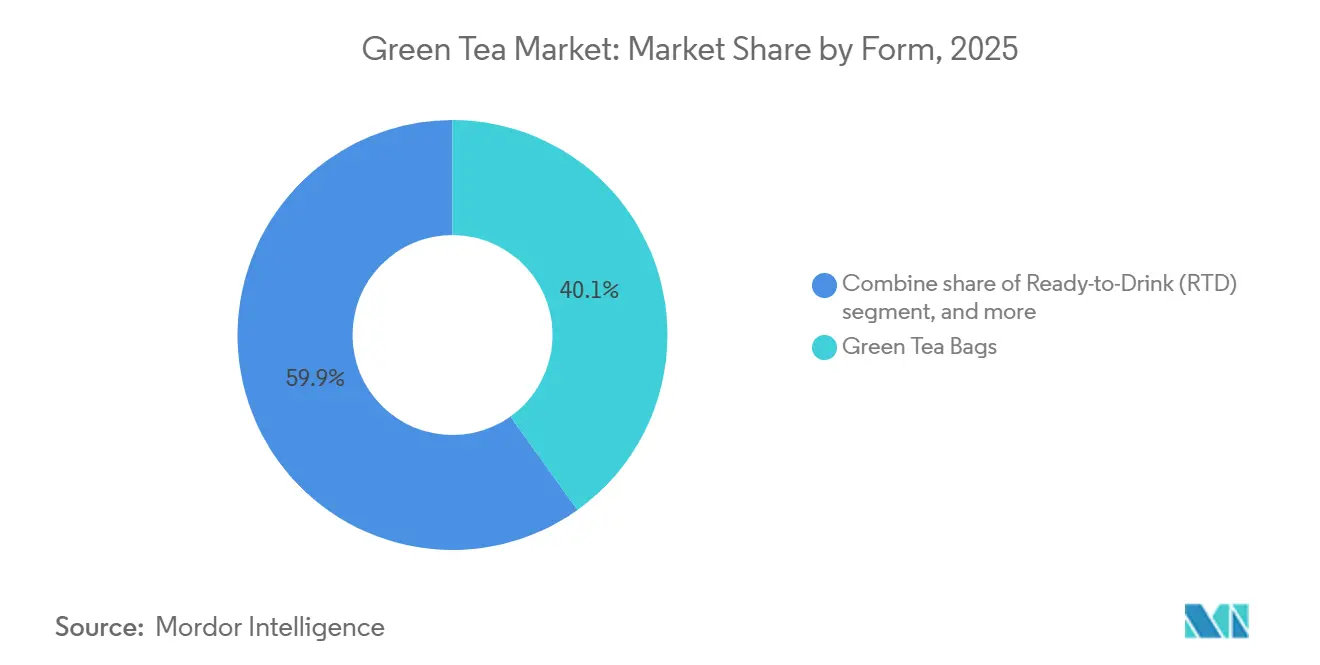
- By form, green tea bags accounted for 40.13% of the Green Tea market size in 2025, yet RTD green tea is poised to expand at a 10.21% CAGR over 2026-2031.
- By distribution channel, supermarkets and hypermarkets commanded 45.83% revenue share in 2025, but online retail is set to grow at 9.04% CAGR during the forecast period.
- By geography, Asia-Pacific captured 36.22% value share in 2025, while South America is forecast to record the fastest regional growth at 9.42% CAGR to 2031.
Note: Market size and forecast figures in this report are generated using Mordor Intelligence’s proprietary estimation framework, updated with the latest available data and insights as of January 2026.
Global Green Tea Market Trends and Insights
Drivers Impact Analysis*
| Driver | (~) % Impact on CAGR Forecast | Geographic Relevance | Impact Timeline |
|---|---|---|---|
| Rising global health consciousness promotes green tea as antioxidant-rich beverage | +1.8% | Global, with concentration in North America, Europe, and urban Asia-Pacific | Medium term (2-4 years) |
| Increasing awareness of benefits like weight management and immunity boosting | +1.5% | North America, Europe, Asia-Pacific urban centers | Medium term (2-4 years) |
| Shift toward natural and organic products appeals to wellness-focused consumers | +1.4% | North America, Europe, with spillover to urban South America and Asia-Pacific | Long term (≥ 4 years) |
| Growing preference for functional beverages with added health properties | +1.3% | Global, led by North America and Asia-Pacific innovation hubs | Medium term (2-4 years) |
| Urban lifestyles drive demand for convenient ready-to-drink RTD green tea formats | +1.2% | Global urban centers, particularly Asia-Pacific, North America, and South America | Short term (≤ 2 years) |
| Product innovations in flavored, functional, and blended varieties | +1.0% | Global, with premium positioning in North America and Europe | Medium term (2-4 years) |
| Source: Mordor Intelligence | |||
Rising global health consciousness promotes green tea as antioxidant-rich beverage
Once a cultural staple, green tea has now emerged as a scientifically validated functional ingredient, thanks to the endorsement of its dominant catechin, epigallocatechin gallate (EGCG). This shift has resonated with health-conscious consumers who prioritize evidence-based wellness. Studies have confirmed that EGCG plays a pivotal role in modulating lipid catabolism, boosting thermogenesis, and shaping gut microbiome composition, all of which contribute to green tea's metabolic advantages. Meta-analyses published in recent years highlighted that green tea consumers experienced notable improvements in weight management metrics, including reductions in body weight, body mass index, waist circumference, and body fat percentage. These findings were particularly pronounced when green tea was combined with exercise. Yet, caution is warranted. The European Food Safety Authority, alongside other regulatory entities, raised alarms over potential liver toxicity in individuals consuming high doses of EGCG daily for extended periods. This scrutiny has led brands to not only reformulate their supplements but also to transparently label catechin content, striking a balance between efficacy and safety. Such scientific validation elevates green tea from mere anecdotal wellness claims to a credible ally in weight management and metabolic health, especially in regions grappling with obesity and heightened chronic disease awareness.
Increasing awareness of benefits like weight management and immunity boosting
Weight management strategies have shifted from broad "detox" marketing to precise messaging supported by peer-reviewed research. This approach enables brands to target specific consumer groups, such as pre-diabetic individuals and fitness enthusiasts seeking evidence-based supplementation. A randomized controlled trial revealed that 400 milligrams catechin supplementation combined with inulin improved insulin resistance markers, as measured by the homeostatic model assessment for insulin resistance. However, it did not reduce visceral fat, highlighting the nuanced efficacy profile that informed consumers now expect. At the same time, immunity-focused positioning has gained prominence, with green tea polyphenols demonstrating immunomodulatory effects in laboratory studies. However, the lack of large-scale human trials creates a regulatory gray area, prompting brands to emphasize general wellness rather than disease-specific claims. Japan's Ayataka brand, owned by Coca-Cola, leveraged this trend by introducing four new functional variants in spring 2026, including a gamma-aminobutyric acid (GABA)-enriched hojicha aimed at stress reduction and improving sleep quality. This innovation contributed to the brand's best-ever sales performance in 2025. The integration of metabolic and immune health messaging positions green tea uniquely within the functional beverage market. It appeals to consumers who perceive daily consumption as a form of preventive healthcare rather than simply a source of refreshment.
Shift toward natural and organic products appeals to wellness-focused consumers
Organic green tea reflects a growing consumer shift toward certified and traceable supply chains, driven by concerns over microplastic contamination and pesticide residues in conventional products. Polypropylene-based tea bags release approximately 1.2 billion microplastic fragments per milliliter of infusion, increasing demand for alternatives such as abacá, corn-starch polylactic acid, and NatureFlex cellulose materials, which brands like Tea Repertoire and Esah Tea began commercializing in 2024. Life-cycle assessments indicate that polybutylene succinate and cellulose home-compostable tea bags have a lower environmental impact compared to polypropylene options, aligning with the compliance timelines of the European Union Single-Use Plastics Directive and North American consumer preferences for biodegradable packaging. Organic certification bodies, including United States Department of Agriculture (USDA) Organic, European Union (EU) Organic, and India Organic, enforce strict pesticide-free cultivation standards. However, supply constraints remain, as global organic tea production reached only 150,000 tonnes in 2022, representing a small fraction of conventional output.
Growing preference for functional beverages with added health properties
Functional green tea formulations are reshaping the wellness landscape. By merging traditional catechins with adaptogens, nootropics, and probiotics, these innovations are drawing in consumers who once relied on a multitude of products for their wellness routines. Green tea, with its adeptness at fortification and flavor masking, plays a significant role in this growing segment. A case in point is Wild Orchard's Regenerative Organic Certified Green Tea Energy Shot. Launched in 2025 and hailing from Jeju Island, this energy shot melds epigallocatechin gallate (EGCG) with natural caffeine and B vitamins, positioning it as a formidable rival to synthetic energy drinks. Meanwhile, Kombucha, a probiotic-rich fermented tea, underscores the market's potential, showcasing consumers' readiness to invest in products that offer both taste and tangible benefits. Yet, as brands amplify their health claims, regulatory bodies like the United States Food and Drug Administration (FDA) and the European Food Safety Authority (EFSA) are tightening the reins. They now mandate that such claims, especially those related to structure and function, be backed by randomized controlled trials. This benchmark poses a challenge for smaller innovators, who often lack the deep pockets for pharmaceutical-grade research.
Restraints Impact Analysis*
| Restraint | (~) % Impact on CAGR Forecast | Geographic Relevance | Impact Timeline |
|---|---|---|---|
| Regulatory complexities around health claims and labeling standards | -0.6% | Global, with heightened scrutiny in North America and Europe | Long term (≥ 4 years) |
| Supply chain disruptions and complexities in traceability | -0.5% | Global, with acute impact in Asia-Pacific sourcing regions | Medium term (2-4 years) |
| Quality control issues and authenticity concerns erode trust | -0.4% | Global, particularly affecting conventional segments in price-sensitive markets | Medium term (2-4 years) |
| Fluctuating raw material prices from climate change and weather variability | -0.5% | Global, with severe impact on Japan, China, and India cultivation zones | Long term (≥ 4 years) |
| Source: Mordor Intelligence | |||
Regulatory complexities around health claims and labeling standards
Different regulatory frameworks across major markets require brands to create formulations, labeling, and clinical substantiation dossiers specific to each jurisdiction. This increases compliance costs and delays product launches. In the United States, the Food and Drug Administration (FDA) permits structure-function claims for dietary supplements under the Dietary Supplement Health and Education Act but prohibits disease-specific claims without New Drug Application approval [1]Source: United States Food & Drug Administration, “Structure/Function Claims,” fda.gov. In the European Union, the European Food Safety Authority (EFSA) requires pre-market authorization for health claims and enforces a restrictive list of approved botanical health relationships [2]Source: European Food Safety Authority, “Health claims,” efsa.europa.eu. In India, the Food Safety and Standards Authority of India (FSSAI) introduced updated regulations in 2024 for botanical extracts in food and beverages, mandating standardized testing protocols and maximum residue limits for pesticides. However, enforcement remains inconsistent across states, creating compliance uncertainty for multinational brands. Japan's Foods with Function Claims system allows self-certification based on scientific evidence but requires post-market surveillance and adverse-event reporting, which smaller exporters often find challenging to implement [3]Source: Japan's Consumer Affairs Agency (CAA), “The System of ' Food with Function Claims"' has been launched,” caa.go.jp. These fragmented regulatory systems make it difficult to achieve economies of scale in product development and marketing, as a single global stock-keeping unit (SKU) cannot meet the requirements of all jurisdictions simultaneously. Brands that invest in regulatory intelligence and maintain dedicated compliance teams gain a competitive advantage, but this fixed-cost burden disproportionately impacts mid-sized players that lack the resources of larger multinational companies.
Supply chain disruptions and complexities in traceability
Climate volatility, geopolitical tensions, and fragmented smallholder cultivation models contribute to supply chain opacity, undermining traceability efforts and exposing brands to reputational risks, such as undisclosed pesticide use or labor violations. According to Plant Science, climate change is expected to significantly reduce suitable tea cultivation areas in China by the middle of the century. Rising temperatures and altered precipitation patterns are already impacting yields in traditional growing regions. For example, Japan's matcha yields have seen a sharp decline in recent harvests due to unseasonable frosts and heat stress, while auction prices have risen substantially year-over-year. This highlights how supply shocks affect premium segments where substitution options are limited. Blockchain-based traceability platforms and Internet of Things (IoT) sensors present potential technical solutions, but their adoption remains limited. Smallholders often lack the digital literacy and financial resources needed to implement these systems, perpetuating information gaps that benefit vertically integrated estates over cooperative models.
*Our forecasts treat driver/restraint impacts as directional, not additive. The impact forecasts reflect baseline growth, mix effects, and variable interactions.
Segment Analysis
By Category: Organic Certification Drives Premium Repositioning
Conventional green tea accounted for 74.43% of the projected 2025 revenue, driven by mass-market brands utilizing economies of scale in procurement, processing, and distribution. However, organic green tea is expected to grow at a compound annual growth rate (CAGR) of 8.94% through 2031, as consumers increasingly prioritize pesticide-free cultivation and transparent supply chains. Achieving organic certification requires a three-year transition period during which estates must forgo synthetic inputs, often resulting in yield declines of 10% to 20%. These financial challenges limit organic production to well-capitalized estates and cooperatives with access to patient capital.
While conventional green tea benefits from established distribution networks and strong brand recognition, it faces challenges such as microplastic contamination scandals and concerns over pesticide residues, which undermine trust among health-conscious consumers. A 2024 study published in Chemosphere highlighted that polypropylene-based tea bags, commonly used in conventional products, release approximately 1.2 billion microplastic fragments per milliliter. In response, brands like Esah Tea introduced microplastic-free cotton alternatives in 2024.


By Flavor Type: Sensory Innovation Attracts New Consumers
Unflavored green tea accounted for 56.53% of the projected 2025 revenue, reflecting traditional consumption preferences in Asia-Pacific markets. Attributes such as single-origin purity and terroir expression remain highly valued, particularly in Japan's sencha and China's Longjing categories. Flavored green tea is expected to grow at a Compound Annual Growth Rate (CAGR) of 9.32% through 2031, driven by fruit-forward blends and floral infusions that mitigate the astringency and grassy notes often unappealing to Western consumers unfamiliar with traditional green tea profiles. Premium brands are incorporating botanical aromas such as jasmine, rose, osmanthus, and sakura to create differentiated products, commanding price premiums of 30% to 50% and positioning green tea as a luxury product rather than a commodity beverage.
Fruit infusions featuring flavors like lychee, ube, blueberry-pomegranate, pineapple-mango, and passionfruit-peach are particularly appealing to younger demographics, offering familiar flavor profiles that lower barriers to trial in markets dominated by coffee and black tea. AriZona Beverages demonstrated innovation in this space by launching Good Brew, a natural leaf-brewed line with six flavors, including green tea, in 2025. This was followed by a collaboration with Mike's Hot Honey in September 2025 to introduce a spicy green tea variant, showcasing how rapid product iteration can sustain consumer engagement.
By Form: RTD Formats Capture Urban Convenience Demand
Green tea bags contributed 40.13% of the revenue in 2025, driven by established consumer habits, strong retail shelf presence, and suitability for both home and office brewing. However, ready-to-drink (RTD) green tea is projected to grow at a compound annual growth rate (CAGR) of 10.21% through 2031, supported by urban lifestyles that emphasize portability and immediate consumption. Loose green tea leaves attract connoisseurs who value control over steeping parameters and associate whole-leaf formats with higher quality. Nevertheless, this segment faces challenges due to time constraints and the growing popularity of single-serve alternatives, which offer consistent results without requiring specialized equipment.
Instant green tea mixes provide convenience but are hindered by quality concerns, as spray-drying and freeze-drying processes can reduce catechin content and flavor complexity. This limits their appeal to price-sensitive consumers who prioritize speed over sensory experience. The compound annual growth rate (CAGR) of 10.21% for ready-to-drink (RTD) green tea reflects its alignment with functional beverage trends, with brands enhancing RTD formats by incorporating adaptogens, probiotics, and nootropics, transforming green tea into a wellness-oriented product. For example, Lipton's hard iced tea line, which combined 5% alcohol with citrus green tea and accounted for 46% of the brand's RTD sales in 2025, demonstrates how RTD formats are expanding into adjacent beverage categories.

By Distribution Channel: E-Commerce Disrupts Traditional Retail
Supermarkets and hypermarkets accounted for 45.83% of the distribution share in 2025, benefiting from high foot traffic, impulse purchase opportunities, and established partnerships with multinational brands. However, online retail is projected to grow at a Compound Annual Growth Rate (CAGR) of 9.04% through 2031, driven by direct-to-consumer models and quick-commerce platforms that bypass traditional distribution channels. From 2021 to 2024, India's online beverage market experienced significant growth, driven by quick-commerce platforms offering rapid delivery within minutes. This capability led to a substantial increase in beverage sales within a short period, enabling digital-native brands to gain a notable share of the market from established players in just one year. For example, Vahdam India reported impressive revenue in fiscal 2025, with the majority of its earnings coming from exports. This highlights how e-commerce empowers niche brands to access global markets without requiring the capital-intensive investments associated with physical retail expansion.
Specialty stores continue to attract premium consumers by offering curated selections and expert advice. However, their market share is gradually declining as e-commerce platforms focus on strategies like content marketing, partnerships with influencers, and subscription models that replicate the discovery experience online. The strong growth of online retail through 2031 reflects its structural advantages, such as the ability to capture customer data, provide personalized recommendations, and establish direct feedback loops for faster product development. These capabilities are difficult for traditional brick-and-mortar stores to achieve without significant investments in technology. In response to the increasing competition from e-commerce, traditional retailers are collaborating with brands to maintain their market presence. For instance, in March 2025, AriZona Beverages partnered with 7-Eleven to launch Southland Reserve private-label cold brew, which includes green tea leaves. This collaboration demonstrates how traditional retailers are working to counter the growing influence of online retail.
Geography Analysis
In 2025, the Asia-Pacific region accounted for 36.22% of global revenue, driven by China's position as the largest producer and consumer of green tea. In Japan, green tea dominated domestic tea sales, representing over half of the market, with annual volumes reaching significant levels. Over the past year, Japan exported tea worth billions of yen, primarily matcha, and aims to achieve higher export targets by mid-decade. However, these ambitions face challenges due to supply constraints, including declining yields and rising prices. In India, urban millennials, influenced by wellness trends, have shifted their preference from black tea to green tea, leading to notable growth in consumption. Emerging brands like Vahdam India and Blue Tea have utilized direct-to-consumer strategies and quick-commerce platforms to capture significant market share from established players in a short time frame.
South America is expected to grow at a Compound Annual Growth Rate (CAGR) of 9.42% through 2031, the fastest among all regions, driven by Brazil's wellness-focused middle class and Argentina's increasing adoption of matcha. Consumers in the region are increasingly viewing green tea as a healthier alternative to sugary soft drinks and traditional mate. Ready-to-drink tea formats have experienced rapid growth in South America, fueled by urban lifestyles in cities like São Paulo, Buenos Aires, and Santiago, which prioritize convenience and portability. Emerging markets such as Chile and Peru present opportunities as rising incomes and exposure to North American wellness trends create demand for premium green tea offerings. However, challenges such as limited distribution infrastructure and the need for consumer education require brands to collaborate with local retailers and leverage influencer marketing campaigns.
Other regions, including North America, Europe, the Middle East, and Africa, exhibit varying dynamics. North America and Europe show mature consumption patterns but continue to grow through premiumization, functional innovation, and sustainability-focused positioning, which allow for price premiums over commodity-grade products. In November 2025, Lipton expanded into concentrates and herbal teas, with plans to introduce matcha in 2026, showcasing how established players diversify their portfolios to compete with specialty brands. In Europe, regulatory frameworks such as European Food Safety Authority (EFSA) health-claim standards and the European Union (EU) Single-Use Plastics Directive drive innovation in biodegradable packaging and functional product positioning. These regulations create compliance costs that favor established companies with dedicated regulatory teams. Meanwhile, the Middle East and Africa remain emerging markets where black tea and coffee dominate cultural preferences. However, growth pockets are emerging in urban centers like Dubai, Johannesburg, and Lagos, where expatriate communities and health-conscious affluent consumers are incorporating green tea into broader wellness lifestyles.

Competitive Landscape
The green tea market exhibits a moderate level of concentration, reflecting a competitive landscape. Prominent multinational companies such as Unilever, Tata Consumer Products, and Ito En compete alongside regional specialists and direct-to-consumer brands that utilize digital platforms and sustainability-focused strategies. Established players are increasingly adopting vertical integration to enhance their supply chains. For example, Lipton collaborated with Browns Investments to gain access to tea estates in Kenya, Rwanda, and Tanzania. Similarly, Ito En expanded its global footprint by setting up a Europe unit in Germany in April 2024 and planning an India subsidiary in Mumbai by April 2026, with an investment of Indian Rupees (INR) 300 million. Tata Consumer Products committed Indian Rupees (INR) 2,000 crore over five years through a memorandum of understanding signed in September 2025, focusing on specialty tea expansion. Additionally, brands like Teapigs and Good Earth reported growth rates of 35 percent and 100 percent, respectively, in fiscal 2026.
White-space opportunities in the market are concentrated in functional ready-to-drink (RTD) formats, sustainable packaging, and premium matcha offerings. While supply constraints create entry barriers, they also provide pricing advantages for brands with dependable sourcing partnerships. Technology adoption in the market is centered on blockchain traceability, Internet of Things (IoT)-enabled quality monitoring, and Artificial Intelligence (AI)-driven demand forecasting. However, smallholder suppliers face challenges such as low digital literacy and limited capital, which hinder widespread implementation.
Mergers and acquisitions are gaining momentum as established players acquire niche brands to drive innovation and tap into new consumer segments. For instance, Luxmi Group acquired an 80 percent stake in the United Kingdom's Brew Tea Co in July 2025, marking its first overseas retail acquisition. Competitive intensity is expected to increase further as private-label offerings from retailers, such as 7-Eleven's partnership with AriZona Beverages for Southland Reserve cold brew in March 2025, put pressure on mid-tier brands. These brands may struggle to maintain margins unless they differentiate through sustainability, functionality, or direct consumer relationships.
Green Tea Industry Leaders
-
Ito En, Ltd.
-
Tata Consumer Products
-
Associated British Foods
-
Starbucks Corporation
-
Lipton Teas and Infusions
- *Disclaimer: Major Players sorted in no particular order

Recent Industry Developments
- July 2025: Mizkan Holdings launched Fibee Maroyaka Blend Tea, combining green tea, hojicha, and Japanese black tea with 6.0g of fermentable dietary fiber per 500ml bottle, targeting gut health-conscious consumers through its official online store.
- July 2025: ITO EN launched its 'Green Tea for Good' global initiative featuring Shohei Ohtani, with a limited edition bottle and advertising campaign across 62 countries, demonstrating how brands are leveraging celebrity partnerships and sustainability messaging to build international recognition. The initiative includes environmental conservation activities and recycled paper materials made from used tea leaves.
- June 2025: Peet's Coffee and Tea acquired Mighty Leaf Tea to enhance its premium tea portfolio, with Mighty Leaf continuing independent operations while benefiting from Peet's resources and distribution network. This acquisition strengthens Peet's position in the specialty tea sector amid growing demand for premium products.
- March 2025: Luxmi Tea Estates launched 'Zero Proof' cold tea beverages, including 'Citrine Oasis' green tea with orange extracts, made from high-altitude Himalayan tea with no added sugars or preservatives, reflecting growing demand for healthier non-alcoholic alternatives. This launch follows successful collaboration with Coca-Cola for organic iced tea production.


Global Green Tea Market Report Scope
The green tea market refers to the global production, marketing, and consumption of green tea as a health-focused beverage. This market is experiencing growth due to increasing awareness of wellness, continuous product innovation, and the premiumization of both traditional and ready-to-drink (RTD) green tea formats. The market is segmented by category into organic and conventional; by flavor type into flavored and unflavored; by form into green tea bags, loose green tea leaves, instant green tea mixes, ready-to-drink (RTD) green tea, capsules and tablets, and loose leaf powder; by distribution channel into supermarkets and hypermarkets, specialty stores, online retail, and others; and by geography into North America, Europe, Asia-Pacific, South America, and the Middle East and Africa. The market sizing has been done in value terms in USD and volume in tonnes for all the abovementioned segments.
| Organic |
| Conventional |
| Flavored |
| Unflavored |
| Green Tea Bags |
| Loose Green Tea Leaves |
| Instant Green Tea Mixes |
| Ready-to-Drink (RTD) Green Tea |
| Capsules and Tablets |
| Loose Leaf Powder |
| Supermarkets and Hypermarkets |
| Specialty Stores |
| Online Retail |
| Others |
| North America | United States |
| Canada | |
| Mexico | |
| Rest of North America | |
| Europe | Germany |
| United Kingdom | |
| Italy | |
| France | |
| Spain | |
| Netherlands | |
| Poland | |
| Belgium | |
| Sweden | |
| Rest of Europe | |
| Asia-Pacific | China |
| India | |
| Japan | |
| Australia | |
| Indonesia | |
| South Korea | |
| Thailand | |
| Singapore | |
| Rest of Asia-Pacific | |
| South America | Brazil |
| Argentina | |
| Colombia | |
| Chile | |
| Peru | |
| Rest of South America | |
| Middle East and Africa | South Africa |
| Saudi Arabia | |
| United Arab Emirates | |
| Nigeria | |
| Egypt | |
| Morocco | |
| Turkey | |
| Rest of Middle East and Africa |
| By Category | Organic | |
| Conventional | ||
| By Flavor Type | Flavored | |
| Unflavored | ||
| By Form | Green Tea Bags | |
| Loose Green Tea Leaves | ||
| Instant Green Tea Mixes | ||
| Ready-to-Drink (RTD) Green Tea | ||
| Capsules and Tablets | ||
| Loose Leaf Powder | ||
| By Distribution Channel | Supermarkets and Hypermarkets | |
| Specialty Stores | ||
| Online Retail | ||
| Others | ||
| By Geography | North America | United States |
| Canada | ||
| Mexico | ||
| Rest of North America | ||
| Europe | Germany | |
| United Kingdom | ||
| Italy | ||
| France | ||
| Spain | ||
| Netherlands | ||
| Poland | ||
| Belgium | ||
| Sweden | ||
| Rest of Europe | ||
| Asia-Pacific | China | |
| India | ||
| Japan | ||
| Australia | ||
| Indonesia | ||
| South Korea | ||
| Thailand | ||
| Singapore | ||
| Rest of Asia-Pacific | ||
| South America | Brazil | |
| Argentina | ||
| Colombia | ||
| Chile | ||
| Peru | ||
| Rest of South America | ||
| Middle East and Africa | South Africa | |
| Saudi Arabia | ||
| United Arab Emirates | ||
| Nigeria | ||
| Egypt | ||
| Morocco | ||
| Turkey | ||
| Rest of Middle East and Africa | ||


Key Questions Answered in the Report
How large will Green Tea sales be by 2031?
The Green Tea market is projected to reach USD 33.19 billion by 2031 on an 8.24% CAGR trajectory.
Which product format is growing quickest?
Ready-to-drink green tea is advancing at a 10.21% CAGR, outpacing bags, loose-leaf, and instant mixes.
Why is organic green tea attracting premium pricing?
Limited certified acreage and rising microplastic concerns allow organic variants to price 20-40% above conventional products.
Which region is adding the most new revenue?
South America posts the fastest regional growth at 9.42% CAGR, fueled by Brazil and Argentina’s wellness adoption.
What main regulatory hurdle do brands face?
Divergent health-claim standards across FDA, EFSA, and FSSAI jurisdictions inflate compliance costs and slow product launches.
Page last updated on:


