
Blood Screening Market Size and Share
Market Overview
| Study Period | 2020 - 2031 |
|---|---|
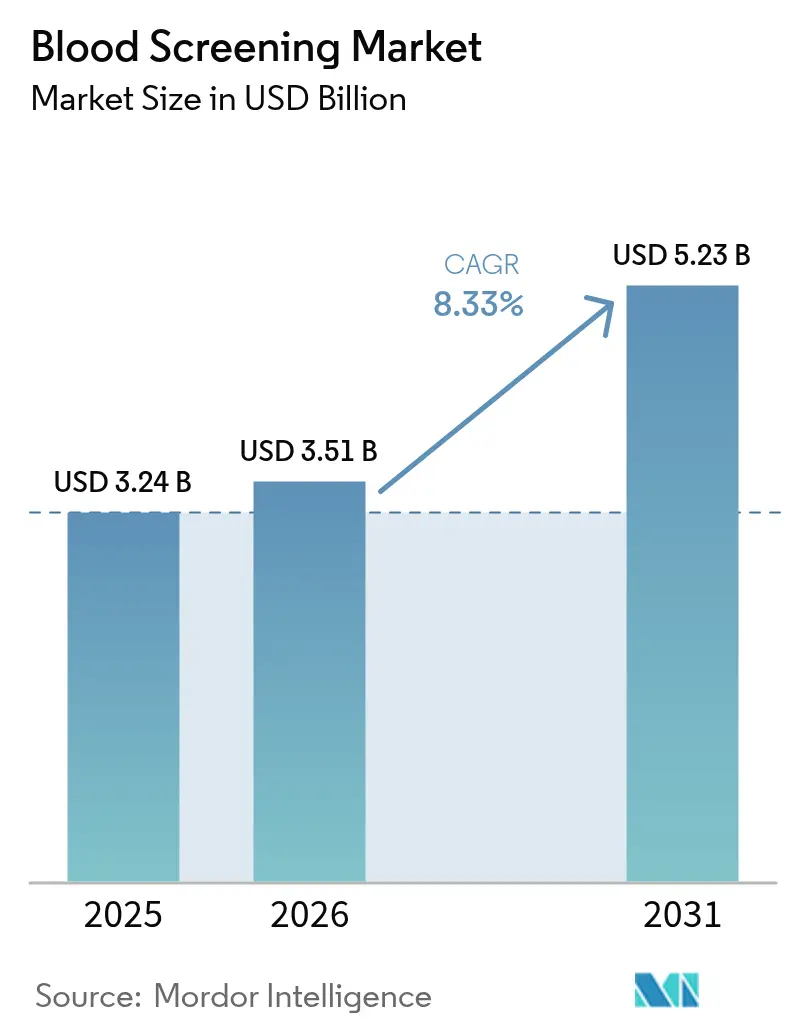
| Market Size (2026) | USD 3.51 Billion |
| Market Size (2031) | USD 5.23 Billion |
| Growth Rate (2026 - 2031) | 8.33 % |
| Fastest Growing Market | Asia Pacific |
| Largest Market | North America |
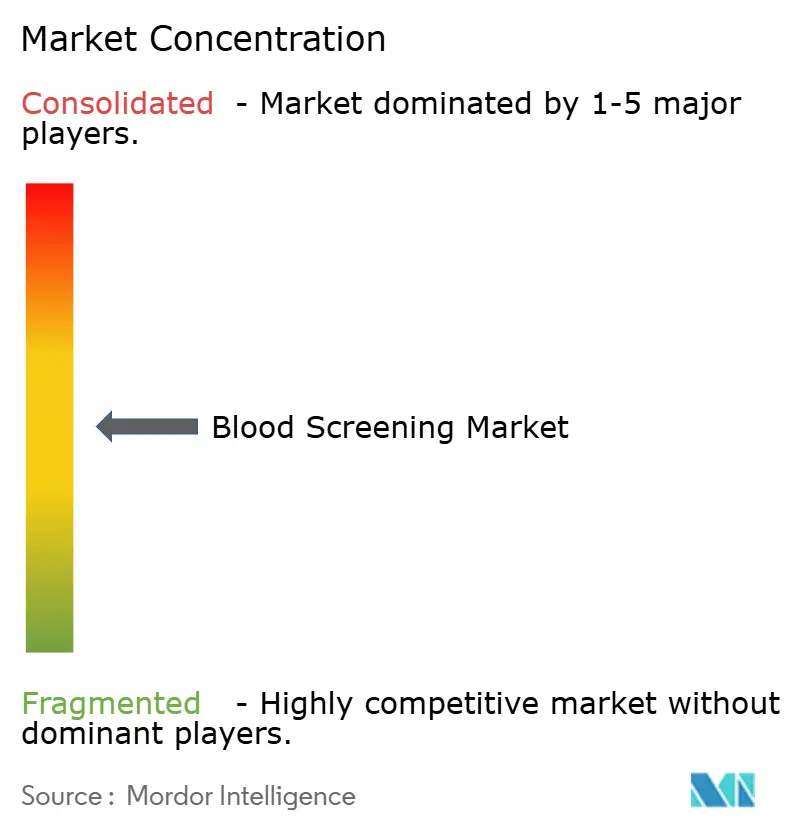
| Market Concentration | Medium |
Major Players *Disclaimer: Major Players sorted in no particular order Image © Mordor Intelligence. Reuse requires attribution under CC BY 4.0. | |
Blood Screening Market Analysis by Mordor Intelligence
blood screening market size in 2026 is estimated at USD 3.51 billion, growing from 2025 value of USD 3.24 billion with 2031 projections showing USD 5.23 billion, growing at 8.33% CAGR over 2026-2031. Growth is propelled by regulatory reforms that emphasize individual donor risk assessment, rapid adoption of automation, and the steady rebound in global donations. Wider use of multiplex nucleic-acid testing, the arrival of point-of-care molecular platforms, and expanding inventory-management algorithms are streamlining operations while improving pathogen detection. Meanwhile, cost pressures linked to compliance with evolving Laboratory Developed Test (LDT) rules are driving hospitals and blood banks to invest in integrated solutions that lower per-unit testing costs. Finally, pathogen-reduction technologies are starting to complement conventional screening, prompting incumbents to rethink R&D priorities and partnerships.
Key Report Takeaways
- By product, reagents and kits led with 55.62% of blood screening market share in 2025; instruments are projected to grow at a 9.78% CAGR to 2031.
- By technology, NAT held 41.88% revenue share in 2025, while next-generation sequencing is forecast to advance at an 11.02% CAGR through 2031.
- By screening target, infectious-disease panels dominated with 49.05% share of the blood screening market size in 2025 and are set to expand at a 12.12% CAGR by 2031.
- By end-user, blood banks accounted for 58.15% of the blood screening market size in 2025, whereas clinical laboratories will register a 10.22% CAGR to 2031.
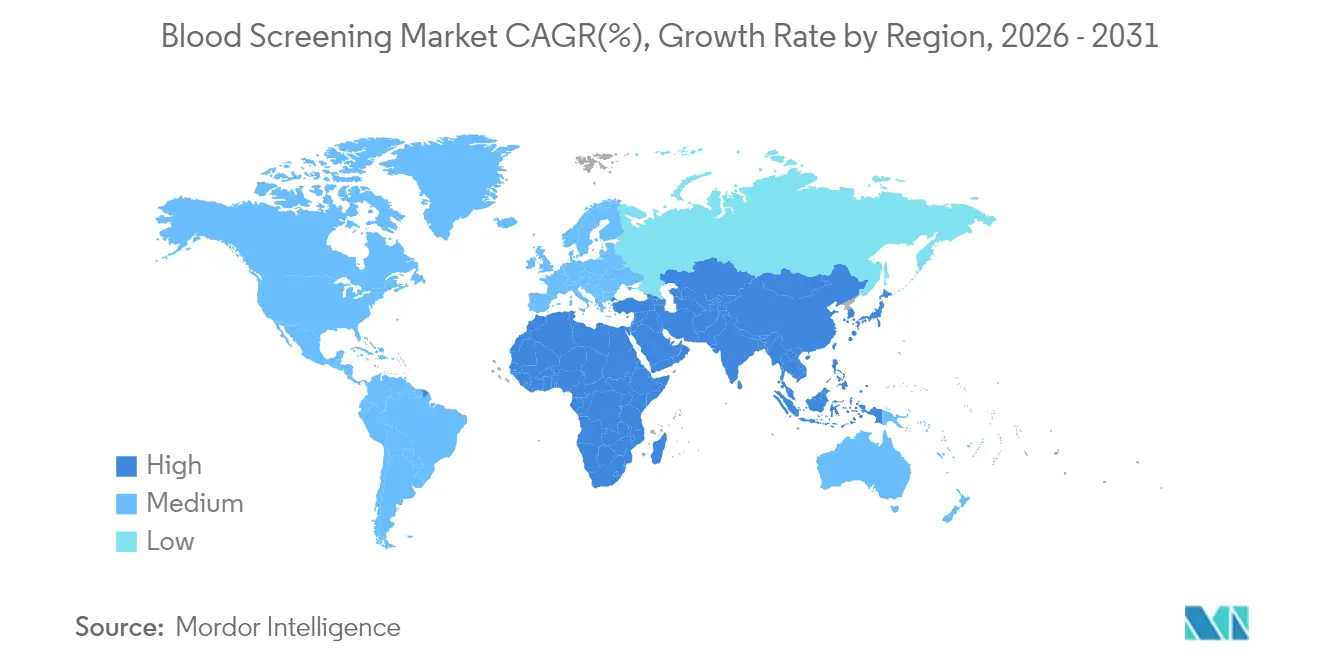
- By geography, North America commanded 35.10% of the blood screening market share in 2025; Asia-Pacific is the fastest-growing region at 9.86% CAGR to 2031.
Note: Market size and forecast figures in this report are generated using Mordor Intelligence’s proprietary estimation framework, updated with the latest available data and insights as of 2026.
Market Trends and Insights
Drivers Impact Analysis of Blood Screening Market*
| Driver | (~) % Impact on CAGR Forecast | Geographic Relevance | Impact Timeline |
|---|---|---|---|
| Rising Blood Donations Leading To Increased Transfusion Screenings | +1.2% | Global, with strongest impact in North America & Europe | Medium term (2-4 years) |
| Increasing Prevalence Of Transfusion-Transmissible Infections | +1.8% | Global, particularly APAC and MEA regions | Long term (≥ 4 years) |
| Stringent Regulatory Guidelines For Blood Safety | +0.9% | North America & EU, expanding to APAC | Short term (≤ 2 years) |
| Technological Advancement In Blood Screening Methods | +1.5% | Global, led by North America and developed APAC markets | Medium term (2-4 years) |
| Rising Awareness For Blood Transmitted Infections And Increasing Number Of Blood Banks | +1.1% | Global, with accelerated growth in emerging markets | Long term (≥ 4 years) |
| AI-Driven Inventory Optimisation Platforms In Blood Banks | +0.7% | North America & EU, early adoption in urban APAC centers | Short term (≤ 2 years) |
| Source: Mordor Intelligence | |||
Rising blood donations leading to higher transfusion screenings
Group-donation campaigns, such as China’s 2025 initiative that rewards repeat donors, are reversing the pandemic dip in supply and creating fresh demand for scalable screening. A parallel shift by the United States Food and Drug Administration (FDA) to risk-based donor assessment removes categorical deferrals for men who have sex with men, enlarging the eligible pool while increasing the complexity of per-unit screening.[1]U.S. Food and Drug Administration, “Laboratory Developed Tests Regulatory Impact Analysis,” fda.gov Together, higher volumes and donor diversity are encouraging blood establishments to adopt fully automated assays and robotics so that throughput rises without compromising sensitivity.
Greater prevalence of transfusion-transmissible infections
The Centers for Disease Control and Prevention (CDC) issued a 2025 alert after 13 million dengue cases occurred in the Americas during 2024, more than twice the prior year.[2]Centers for Disease Control and Prevention, “Ongoing Risk of Dengue Virus Infections,” cdc.govConcurrent West Nile outbreaks in Bulgaria and isolated monkeypox transmissions through platelet products underline the need for multiplex assays that go beyond the HIV-HBV-HCV triad. Rapid expansion of such panels has lifted demand for NAT reagents that can screen for emerging flaviviruses, orthopoxviruses, and region-specific pathogens within one workflow.
Stricter regulatory guidelines for blood safety
The new European Regulation (EU) 2024/1938 sets harmonized oversight standards effective 2027, while updated FDA guidance for blood establishments focuses on donor qualification, platelet collection and hepatitis B procedures.[3]AABB, “AI and Data Sciences in Blood Banking,” aabb.org These rules accelerate investment in quality-management systems, automated documentation, and validated screening platforms. Vendors able to provide turnkey compliance features and audit-ready software modules gain a competitive edge.
Technological advances in screening methods
FDA approval of the cobas Malaria NAT test—the first molecular assay cleared for U.S. donors—illustrates regulators’ openness to high-sensitivity molecular diagnostics. Portable systems, such as Dragonfly, now deliver 96.1% orthopoxvirus sensitivity in under 40 minutes, making near-patient molecular testing viable. At the same time, metagenomic sequencing detects 74.0% of sepsis pathogens versus 41.1% by culture, offering a blueprint for future integrated blood-bank workflows.
Restraints Impact Analysis of Blood Screening Market*
| Restraint | (~) % Impact on CAGR Forecast | Geographic Relevance | Impact Timeline |
|---|---|---|---|
| High Capital & Consumable Cost For Screening | -1.4% | Global, most pronounced in emerging markets | Medium term (2-4 years) |
| Limited Skilled Workforce And Laboratory Infrastructure | -1.1% | APAC, MEA, and rural regions globally | Long term (≥ 4 years) |
| Competition From Pathogen-Reduction Technologies | -0.8% | North America & EU, expanding to developed APAC | Medium term (2-4 years) |
| Reagent Supply-Chain Disruptions (Geo-Politics & Cold-Chain) | -0.9% | Global, with acute impact in import-dependent regions | Short term (≤ 2 years) |
| Source: Mordor Intelligence | |||
High capital and consumable costs
Compliance with the newly finalized LDT rule will cost the U.S. screening sector an estimated USD 566 million to USD 3.56 billion each year, according to FDA modelling. Emerging economies struggle even more because NAT platforms require significant upfront spending and high-grade cold-chain reagents. Although microfluidic chips have driven per-test costs down to USD 9.5, overall affordability remains a challenge for smaller blood centres.
Limited skilled workforce and lab infrastructure
Expertise in molecular diagnostics is scarce outside tier-one hospitals. Rural Asia-Pacific labs face difficulties staffing technologists trained to run real-time PCR, interpret mNGS data, or maintain closed-system robotics. Without targeted training and tele-mentoring, decentralization may stall.
*Our forecasts treat driver/restraint impacts as directional, not additive. The impact forecasts reflect baseline growth, mix effects, and variable interactions.
Blood Screening Market Segment Analysis
By Product:
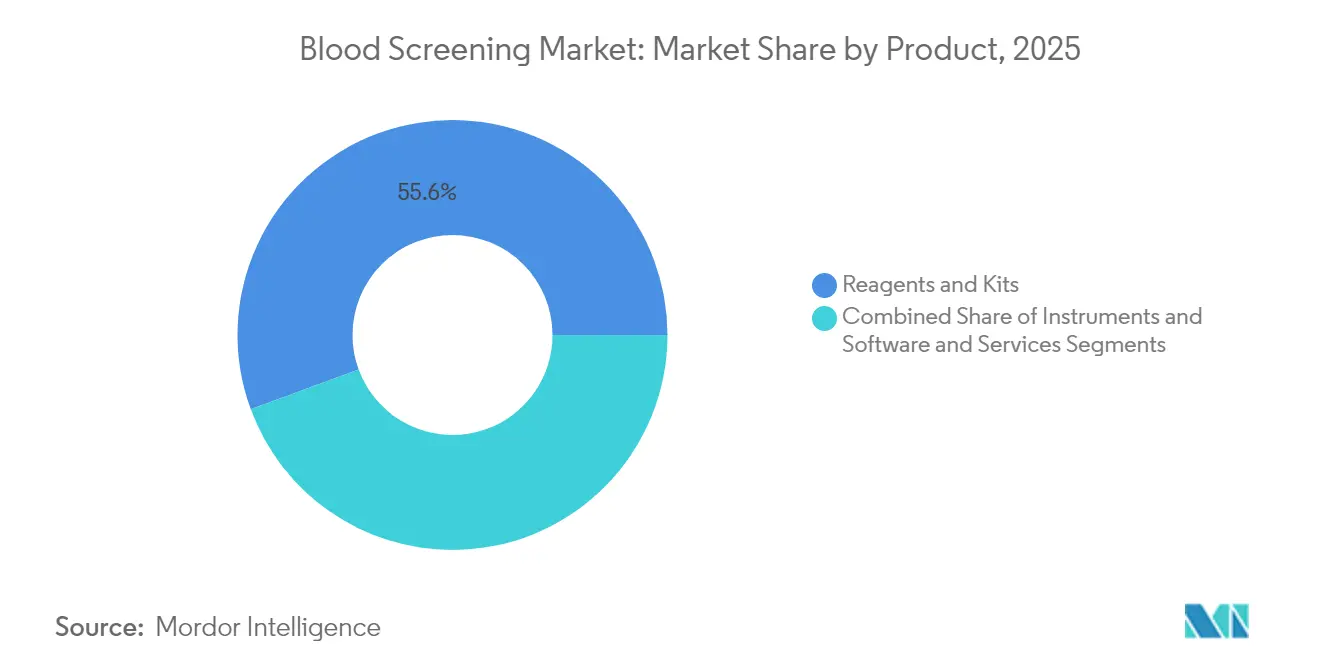
Reagents anchor revenue while smart instruments reshape workflowsReagents and kits retained 55.62% of blood screening market share in 2025 due to recurring demand for NAT, immunoassay and confirmatory components. Their dominance is reinforced by batch-specific regulatory validation that locks in proprietary formulations. The instruments category is expanding at 9.78% CAGR as laboratories upgrade to fully automated NAT workcells and next-generation immunoassay analyzers that integrate robotic pipetting, bar-code tracking and LIS connectivity.
A surge in AI-enabled middleware is also notable; OneBlood’s deployment cut inventory levels by 40%, proving the operational value of real-time analytics. Software & services revenues therefore accelerate as blood banks seek predictive dashboards and automated deviation reporting, a trend likely to outpace reagent growth beyond 2028. Meanwhile, the emergence of portable molecular diagnostic devices, typified by the Dragonfly platform, suggests that decentralized testing could further fragment the instruments sub-segment over the long term.



By Technology:
NAT leads today, NGS rises fastestNAT maintained a robust 41.88% share of the blood screening market in 2025 as its capacity to detect viral nucleic acids during window periods remains unmatched for HIV-1/2, HBV and HCV. Nevertheless, next-generation sequencing is scaling quickly at an 11.02% CAGR. mNGS can uncover unexpected pathogens, pinpoint co-infections and support genomic surveillance during outbreaks, evidenced by a 74.0% detection rate in sepsis studies.
Traditional enzyme immunoassays (ELISA/CLIA) still dominate in lower-resource settings because of lower instrumentation costs and simpler workflows. Rapid tests fill emergency needs but struggle with sensitivity versus NAT. Western blot retains a niche for confirmatory HIV workups. As AI tools mine large molecular datasets, labs may unify NAT and NGS within a common informatics layer, eventually blurring the boundaries between technologies.
By Screening Target:
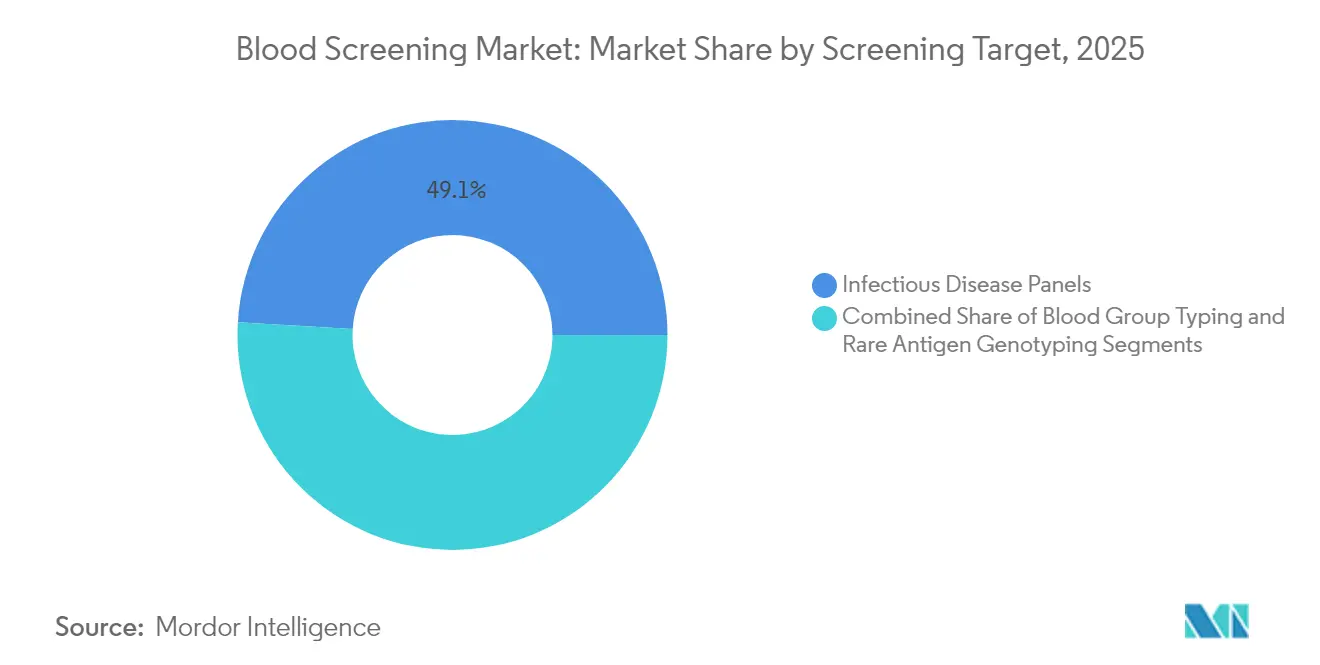
Infectious-disease panels outpace all other categoriesInfectious-disease panels accounted for 49.05% of revenue in 2025 and will grow at a 12.12% CAGR through 2031. Dengue’s surge to 13 million cases in the Americas during 2024 drove immediate demand for flavivirus NAT panels. Widening West Nile and Zika footprints similarly elevate the need for multiplex assays.
Blood-group typing continues to be indispensable for compatibility, while rare-antigen genotyping serves complex transfusion cases, especially in multi-ethnic populations. Roche’s cobas Malaria test, cleared in 2024, broadens screening for travelers and immigrants from endemic areas. Taken together, these advances reinforce the case for syndromic panels capable of processing multiple targets in a single run, streamlining both cost and logistics.
By End-User:
Blood banks remain central, clinical labs race aheadBlood banks processed 58.15% of global donations in 2025, reflecting their integrative role in collection, testing, processing and distribution. Yet testing decentralization is accelerating: clinical laboratories will expand at 10.22% CAGR to 2031 as hospital networks outsource specialty NAT and mNGS work to reference labs equipped with high-throughput sequencers.
University Hospitals Blood Bank recorded a 7% rise in samples and activated 323 massive-transfusion protocols in 2024, illustrating the growing testing burden on tertiary centers. Private-sector consolidation is also reshaping the end-user landscape, highlighted by Quest Diagnostics’ USD 985 million purchase of LifeLabs to extend advanced diagnostics into Canada. Plasma-fractionation facilities continue to demand stringent viral clearance, sustaining high-specificity NAT reagent consumption.
Geography Analysis
North America Blood Screening Market
North America held 35.10% of the blood screening market in 2025. The FDA’s risk-based donor eligibility guidance, AI-assisted inventory management, and ongoing implementation of LDT oversight collectively maintain the region’s technology edge. Canada’s diagnostics sector expanded after Quest Diagnostics took full control of LifeLabs, deepening molecular-testing capacity and cross-border sample logistics. Meanwhile, Mexico is improving rural donation infrastructure, which lifts demand for mid-tier immunoassay analyzers.
APAC Blood Screening Market
Asia-Pacific is the growth engine, projected at a 9.86% CAGR to 2031. Japan’s 2025 hemoglobin-vesicle trial—the world’s first artificial-blood clinical study—could eventually reduce dependence on donor supply and lengthen storage life to two years at room temperature. India’s Quick Vitals facial-scan platform delivers non-invasive hemogram readouts within a minute and is being piloted in public hospitals, underscoring the region’s openness to disruptive diagnostics. China’s national carrier rate of 8.95% for thalassemia points to substantial prenatal and donor screening volume, while ongoing group-donation campaigns expand collection points in second-tier cities.
Europe Blood Screening Market
Europe shows steady progress under Regulation (EU) 2024/1938, which pools oversight across member states and allocates funds for crisis readiness. Germany and France are trial-ling pathogen-reduced platelets alongside traditional screening, whereas Bulgaria’s West Nile outbreak prompted expanded NAT panels at regional blood bank. The regulation’s unified guidance will streamline vendor approvals, encouraging pan-European platform standardization.

Regulatory Landscape
Blood screening is regulated through evolving IVD and blood establishment requirements that focus on transfusion safety, traceability, and validated performance for assays used on donated blood and components. In the United States, FDA guidance continues to shape donor testing workflows, including updates related to hepatitis B and transfusion-transmitted malaria screening, while AABB-led implementation tools track agency positions; for example, AABB updated Ebola-related donor screening materials in July 2026 to reflect FDA guidance, with a short implementation window for blood establishments.
In Europe, oversight is framed by the EU In Vitro Diagnostic Regulation (IVDR, EU 2017/746) and transitional changes under Regulation (EU) 2024/1860 adopted in June 2024 to mitigate device shortages and address Eudamed delays. This reinforces the need for proactive technical file maintenance and notified-body capacity planning. Standards bodies are also tightening technical expectations, with ISO publishing ISO 15193:2026 and ISO 15194:2026 in June 2026, emphasizing reference measurement procedures and certified reference materials that influence analytical traceability requirements in submissions.
Value Chain Analysis
The blood screening value chain begins with specialized raw materials and biological inputs (antibodies, antigens, enzymes, calibrators, controls, and reference materials), followed by assay design, validation, and regulated manufacturing of reagents and kits, as well as instruments. Distribution then relies on cold-chain capable logistics to blood banks, hospital transfusion units, clinical laboratories, and plasma fractionation centers. The downstream workflow covers sample collection, accessioning and labeling, screening (often NAT plus immunoassays), confirmatory testing, documentation in quality systems and LIS, and release decisions governed by regulatory and accreditation requirements.
Constraints often come from concentration of critical inputs (for example, molecular-grade components used in NAT), lot-to-lot release and validation lead times, and temperature-controlled distribution, which can disrupt continuity of screening programs in import-dependent regions. Manufacturers are responding with supply resilience and localized production, illustrated by Grifols opening a new San Diego facility in October 2025 to produce DG Gel cards and reagent red blood cells, aimed at improving domestic availability and reducing dependency risks. Service, software, and automation partners increasingly sit alongside reagent and instrument suppliers as blood centers adopt integrated workcells and inventory optimization to manage staffing shortages and compliance documentation.
Competitive Landscape
Major suppliers—Roche, Abbott, Grifols and bioMérieux—pursue end-to-end platforms rather than stand-alone tests. Roche gained first-mover status with FDA-approved malaria NAT, while bioMérieux’s EUR 111 million SpinChip purchase strengthens the firm’s 10-minute, point-of-care portfolio. Grifols is doubling investment in its NAT business to ward off competition from emergent NGS-based services.
The arrival of pathogen-reduction technologies heightens rivalry by offering an alternative safety layer that could eventually trim the number of individual assays per donation. At the same time, AI-driven middleware and cloud inventory platforms invite non-traditional players from the software sector into the blood screening industry, intensifying competition for data ownership.
Regulatory hurdles may consolidate the market: mandated LDT submissions and hefty post-market surveillance fees could marginalize small independent labs, pushing them toward alliances or acquisition. Simultaneously, emerging manufacturers in India and China are scaling reagent production for domestic use, signaling a potential shift in global supply dynamics within five years.
Blood Screening Industry Leaders
F. Hoffmann-La Roche Ltd.
Grifols
bioMérieux
Bio-Rad Laboratories, Inc.
Danaher Corporation
- *Disclaimer: Major Players sorted in no particular order
Blood Screening Market Companies Covered in this Report
- Roche
- Grifols
- Abbott Laboratories
- bioMérieux
- Bio-Rad Laboratories
- Beckton Dickinson
- Danaher
- DiaSorin
- Siemens Healthineers
- Thermo Fisher Scientific
- Ortho Clinical Diagnostics
- Revvity
- Hologic
- QIAGEN
- Illumina
- GRAIL, Inc
- Immucor
- Meril Life Sciences
- Mindray
- Sysmex

Market Opportunities and Future Outlook
Workflow consolidation and automation create opportunity for suppliers that can combine high-throughput molecular screening with compliance-ready software, particularly as quality expectations tighten. In the United States, the FDA Quality Management System Regulation (QMSR) took effect in February 2026, aligning device quality system requirements with ISO 13485:2016 and increasing the operational value of validated, audit-ready platforms that reduce manual documentation and support standardized change control across multi-site blood organizations.
Product-led opportunities also show up in multi-target and outbreak-relevant screening expansions. Roche launched the cobas MPX-E assay in March 2026 as a 4-in-1 donor screening test (HIV, HCV, HBV, and HEV) for use on the cobas x800 family, supporting laboratories looking to reduce runs and simplify reagent management. Grifols received FDA approval in April 2026 for the Procleix Plasmodium Assay on the Procleix Panther System, adding a molecular option for malaria donor screening. These updates reinforce momentum for scalable NAT menus, middleware that links instruments to LIS and quality systems, and regional manufacturing strategies that reduce cold-chain and import friction in high-volume blood screening programs.
Recent Industry Developments in Blood Screening Market
- July 2026: Roche introduced the cobas HDV test in CE mark countries for use on cobas 5800/6800/8800 systems. The launch adds a fully automated HDV diagnostic option, extending consolidated virology testing on existing high-throughput platforms used by large laboratories. This supports laboratories standardizing workflows around integrated systems while expanding coverage for severe viral hepatitis.
- May 2025: bioMerieux partnered with AdventHealth Orlando to implement the VITEK REVEAL fast antimicrobial susceptibility testing system for bloodstream infections. The deployment expands rapid susceptibility workflows in a major hospital network, influencing automation decisions and resource allocation near transfusion testing operations. The partnership signals continued investment in rapid, automated solutions that compete for lab capital and staffing attention.
- June 2024: Regulation (EU) 2024/1860 was adopted to mitigate device shortages and address Eudamed delays, shaping regulatory expectations for IVDR compliance and clinical workflow planning. The move anchors EU market readiness efforts and underscores the need for proactive documentation and notified-body capacity.


Blood Screening Market Report Scope and Research Methodology
Market Definition and Coverage
For this study, the blood screening market is defined as the revenue generated from laboratory testing used to screen donated blood and blood components before transfusion, along with the related reagents, instruments, and dedicated software used to run and manage those tests.
Scope exclusions: We exclude point-of-care glucose testing, hematology diagnostics, and stand-alone blood-typing analyzers that are not part of infectious-marker screening workflows.
Segments Covered in This Report
- By Product
- Reagents & Kits
- NAT Reagents and Kits
- Immunoassay Reagents and Kits
- Other Reagents and Kits (WB, Rapid, WB)
- Instruments
- Automated NAT Systems
- Immunoassay Analysers (ELISA/CLIA)
- Point-of-Care Molecular Devices
- Software & Services
- Reagents & Kits
- By Technology
- Nucleic Acid Amplification Test (NAT)
- TMA
- Real-time PCR
- Immunoassay
- ELISA
- CLIA / EIA
- Rapid Tests (Lateral-flow)
- Next-Generation Sequencing (NGS)
- Western Blotting
- Emerging Point-of-Care Molecular Tests
- Nucleic Acid Amplification Test (NAT)
- By Screening Target
- Infectious Disease Panels
- HIV
- HBV
- HCV
- Emerging Pathogens (Zika, WNV, Dengue)
- Blood Group Typing
- Rare Antigen Genotyping
- Infectious Disease Panels
- By End-User
- Blood Banks
- Hospitals
- Clinical Laboratories
- Plasma Fractionation Centres
- By Geography
- North America
- United States
- Canada
- Mexico
- Europe
- Germany
- United Kingdom
- France
- Italy
- Spain
- Rest of Europe
- Asia-Pacific
- China
- Japan
- India
- Australia
- South Korea
- Rest of Asia-Pacific
- Middle East and Africa
- GCC
- South Africa
- Rest of Middle East and Africa
- South America
- Brazil
- Argentina
- Rest of South America
- North America
Data Sources, Market Sizing, and Validation
Desk Research
Desk research started with mapping how donated blood moves through collection, testing, release, and transfusion, because that flow helps anchor what products and revenues belong in this market. We referenced public health and surveillance sources such as the World Health Organization (WHO), the US CDC, and national blood-service publications to understand donation volumes, infectious marker priorities, and testing requirements that impact demand.
To translate demand signals into a usable sizing model, we used sources such as the US FDA (screening and blood establishment requirements), European Directorate for the Quality of Medicines and HealthCare guidance that is used across many EU systems, and peer-reviewed journals that report screening yield and adoption of NAT and immunoassay methods. We also reviewed company filings, investor decks, and reputable press coverage to cross-check product mix shifts and pricing direction, then filled gaps using paid subscriptions for company financials and intelligence, news and financials, and patent databases where helpful. The desk sources mentioned here are illustrative, and many other public documents were also checked for data collection, validation, and clarification.
Primary Interviews and Surveys
Primary work was used to pressure-test what we saw in secondary sources, especially around what tests are routinely run per donation, how fast NAT and automation are being adopted, and where pricing is holding or changing. We spoke with a mix of blood-bank decision makers, hospital transfusion-lab staff, plasma-fractionation stakeholders, and industry specialists across major regions so assumptions could be adjusted to local testing algorithms and procurement patterns.
Distribution of primary research fieldwork respondents
| Company type | Respondent position | Region |
|---|---|---|
| Top tier: 36% | CXOs: 15% | APAC: 44% |
| Mid tier: 43% | Functional/Unit leaders: 27% | EMEA: 35% |
| Smaller Players: 21% | Managers: 58% | Americas: 21% |
Market-Sizing & Forecasting
Sizing was built using a top-down approach where donation and component volumes, screening algorithms (tests per donation), and method mix were used to reconstruct the annual test demand pool by region, and then translated into revenue using typical reagent use rates, instrument placement intensity, and service and software attach assumptions. To keep the output realistic, we corroborated totals with selective bottom-up checks, such as roll-ups of sampled supplier revenues by product lines, channel discussions on instrument installations, and ASP times volume checks for high-run assays.
A few inputs that mattered most included blood donation volumes and deferral rates, the share of collections tested with NAT versus serology, the infectious-disease panel breadth applied in routine screening, throughput and utilization levels of automated platforms in large blood centers, and reagent price progression under tender cycles and long-term supply contracts. Where data could not be observed cleanly, gaps were handled through conservative ranges, followed by interview-led narrowing and consistency checks against known testing protocols and published regulatory expectations.
Forecasts were developed using scenario analysis, where donation growth, regulatory testing requirements, and adoption speed of automation and NAT were varied by region, and then aligned to what interviewees viewed as achievable adoption paths over the next five years. Final projections were also checked for common behavior, including stable test-per-donation patterns in mature markets and faster method upgrades in systems modernizing screening infrastructure.
Data Validation & Update Cycle
Validation was done through triangulation across multiple steps so the final number is not driven by any single input. We compared model outputs against independent signals such as reported donation volumes, public health screening guidance, and observable shifts in testing technology adoption, then reviewed any large variances by revisiting price, utilization, and panel assumptions.
Before sign-off, the work goes through internal analyst review, where calculations, unit logic, and conversion choices are rechecked and outliers are challenged. Reports are refreshed annually, and interim updates are triggered when material events occur, such as major regulation changes, large tender outcomes, or sharp pricing shifts. Right before delivery, an analyst runs a final update pass so clients receive the most current view possible.
Mordor Intelligence's Blood Screening Market Size Compared Against Other Published Estimates
Different published market sizes for blood screening can look far apart, even when the topic sounds the same, because the included test scope and the counted revenue lines are not always consistent. The biggest drivers are usually whether blood typing and broader transfusion diagnostics are mixed into the total, how instrument and software revenue is treated, and whether the estimate is updated with recent tender pricing and method adoption shifts.
Some external figures fold blood screening and typing into one pool, and they often apply a broad average price per test across regions with limited adjustment for NAT penetration and panel breadth. In Mordor Intelligence, the count is limited to infectious-marker screening on donated blood and components, and the model separates reagents, instruments, and dedicated software, then performs region-level checks on tests-per-donation and procurement-driven ASP movements.
Benchmark comparison
| Source | Market Size | Gaps in Research Methodology |
|---|---|---|
| Mordor Intelligence | USD 3.51 B (2026) | |
| Trade Journal A | USD 3.34 B (2024) | Uses a different base year and often relies on a single blended growth rate, and it may not fully reconcile NAT adoption, panel breadth, and tender-driven price resets across regions. |
| Industry Report B | USD 7.26 B (2024) | Combines blood screening with blood typing in one total, which expands the revenue pool materially, and the split between consumables and instruments is not always made explicit. |
Taken together, the spread in published values mainly comes from scope expansion into typing and from how prices and method mix are handled across regions. By keeping the demand pool tied to donated-unit screening workflows and cross-checking against adoption and procurement signals, the resulting market size remains traceable to clear inputs that can be reviewed and repeated.


Key Questions Answered in the Report
What is the current size of the blood screening market?
The blood screening market size stands at USD 3.51 billion in 2026 and is projected to reach USD 5.23 billion by 2031.
Which product segment generates the highest revenue?
Reagents and kits hold the largest share at 55.62% in 2025, thanks to recurring demand for NAT and immunoassay consumables.
Which region shows the fastest growth?
Asia-Pacific is forecast to grow at 9.86% CAGR through 2031, fueled by technological leapfrogging in Japan, India and China.
How are new regulations affecting the market?
FDA LDT rules and EU Regulation 2024/1938 tighten oversight, raising compliance costs but driving adoption of fully validated, automated platforms.
What technological trend is set to disrupt current workflows?
Next-generation sequencing and AI-enabled inventory systems are poised to streamline multi-pathogen detection and reduce reagent wastage.
Will pathogen-reduction systems replace traditional screening?
Adoption is rising, yet most blood banks still combine reduction with nucleic-acid testing to meet stringent safety margins.
Page last updated on:





