
Market Overview
| Study Period | 2020 - 2031 |
|---|---|
| Market Size (2026) | USD 6.68 Billion |
| Market Size (2031) | USD 9.34 Billion |
| Growth Rate (2026 - 2031) | 6.92 % |
| Fastest Growing Market | Asia-Pacific |
| Largest Market | North America |
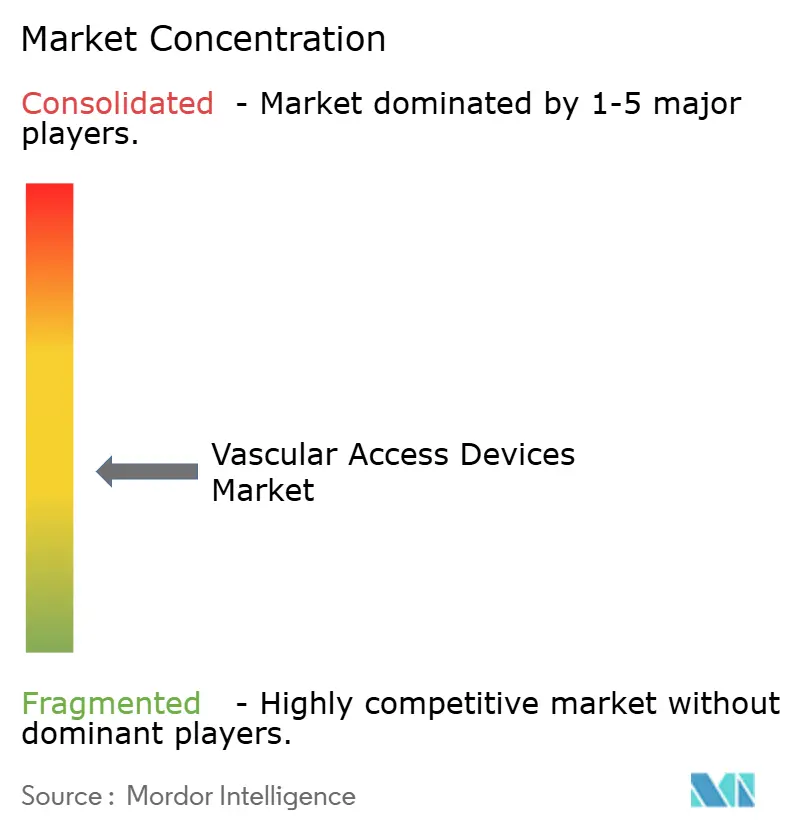
| Market Concentration | Medium |
Major Players
*Disclaimer: Major Players sorted in no particular order Image © Mordor Intelligence. Reuse requires attribution under CC BY 4.0. |
|
Vascular Access Devices Market Analysis by Mordor Intelligence
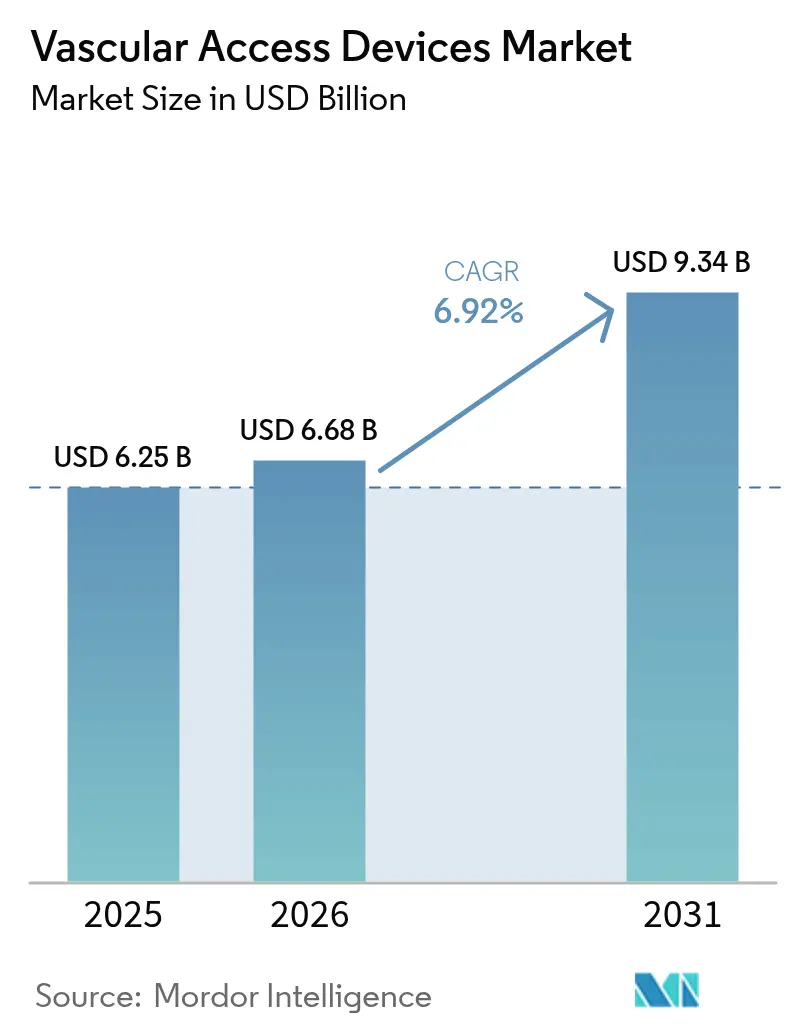
The vascular access devices market size is expected to grow from USD 6.25 billion in 2025 to USD 6.68 billion in 2026 and is forecast to reach USD 9.34 billion by 2031 at 6.92% CAGR over 2026-2031. This expansion reflects healthcare providers’ pivot toward value-based innovation that prioritizes infection prevention, material durability and procedural efficiency. A rising chronic disease burden, broader adoption of ultrasound-guided insertion and the shift to outpatient care models collectively underpin sustained demand. At the same time, advances in hydrophilic biomaterials and antimicrobial coatings intensify product differentiation, while supply-chain reshoring helps manufacturers mitigate raw-material risk. Competitive dynamics therefore favor firms able to pair scale manufacturing with rapid technology roll-outs, keeping the vascular access devices market on a steady growth trajectory.
Key Report Takeaways
- By device type, central vascular access devices led with 56.12% revenue share in 2025, while peripheral devices are projected to expand at a 7.61% CAGR through 2031.
- By application, medication administration held 39.55% of 2025 revenue, whereas diagnostics and testing is set to grow at a 7.68% CAGR to 2031.
- By material, polyurethane captured 48.25% share, whereas silicone is forecast to register an 7.85% CAGR over 2026-2031.
- By end user, hospitals and clinics accounted for 52.90% share in 2025, while ambulatory surgery centers (ASCs) are poised for an 7.77% CAGR.
- By geography, North America dominated with 39.85% revenue share in 2025, but Asia-Pacific is projected to advance at an 7.95% CAGR.
Note: Market size and forecast figures in this report are generated using Mordor Intelligence’s proprietary estimation framework, updated with the latest available data and insights as of 2026.
Market Trends and Insights
Drivers Impact Analysis of Vascular Access Devices Market*
| Driver | (~) % Impact on CAGR Forecast | Geographic Relevance | Impact Timeline |
|---|---|---|---|
| Rising burden of chronic diseases & high IV-therapy demand | 2.1% | Global, with concentration in North America & Europe | Long term (≥ 4 years) |
| Growth in chemotherapy procedures & hospitalization | 1.8% | Global, particularly developed markets | Medium term (2-4 years) |
| Increasing pediatric & neonatal vascular access | 1.2% | North America & Europe, expanding to APAC | Medium term (2-4 years) |
| Adoption of ultrasound-guided DIVA solutions | 1.5% | Global, led by North America | Short term (≤ 2 years) |
| Expansion of home & community infusion therapy | 1.9% | North America & Europe | Medium term (2-4 years) |
| Favorable reimbursement policies and guidelines | 0.8% | Primarily North America & Europe | Long term (≥ 4 years) |
| Source: Mordor Intelligence | |||
Rising burden of chronic diseases & high IV-therapy demand
Chronic conditions such as diabetes and heart failure are driving long-term intravenous treatment requirements worldwide. Home infusion now serves more than 3.2 million Americans annually, with spending exceeding USD 110 billion and rising 5-7% each year. Durable midline catheters and extended-dwell peripheral devices lower complication risk, supporting broader outpatient management. Hydrophilic biomaterials like Access Vascular’s MIMIX reduce failure rates and can save a 1,000-bed hospital USD 1.8 million a year. These economics elevate vascular access devices from commodity supplies to essential infrastructure.
Growth in chemotherapy procedures & hospitalization
Personalized oncology regimens increasingly depend on central venous catheters that tolerate vesicant drugs while permitting frequent sampling [1]Caitriona Duggan, "Vascular access devices for prolonged intravenous therapy regimens in people diagnosed with cancer," Cohrane Library, pmc.ncbi.nlm.nih.gov. Peripherally inserted central catheters (PICCs) improve outpatient flexibility, cutting treatment delays and hospital stays. Chlorhexidine-impregnated dressings have trimmed bloodstream infections by 52% in trials, underpinning premium pricing for infection-resistant devices [2]Huilin Xu, "Improving central venous catheter care with chlorhexidine gluconate dressings: evidence from a systematic review and Meta-analysis," BMC, jhpn.biomedcentral.com.
Increasing pediatric & neonatal vascular access
Neonatal intensive care units report 4-day average indwell times for extended-dwell peripheral IVs with 71.7% success, while PICCs reach 83.6%. The modified Seldinger technique minimizes vessel trauma in premature infants. Taurolidine locks cut bloodstream infections by 45% and hospitalizations by 41% in children on parenteral nutrition. Pediatric-specific R&D therefore remains a strategic differentiator.
Adoption of ultrasound-guided DIVA solutions
Difficult intravenous access affects up to 35% of surgical patients, costing U.S. emergency departments USD 2.68 billion annually. Ultrasound triples first-attempt success, yet two-thirds of clinicians still rely on blind cannulation. One-hand guidewire kits achieve 75% first-try success versus 50% for standard methods. Vendors pairing catheters with bedside imaging and training capture outsized mindshare [3]Amit Bahl, "An Improved Definition and SAFE Rule for Predicting Difficult Intravascular Access (DIVA) in Hospitalized Adults," Journal of Infusion Nursing, journals.lww.com.
Restraints Impact Analysis of Vascular Access Devices Market*
| Restraint | % Impact on CAGR Forecast | Geographic Relevance | Impact Timeline |
|---|---|---|---|
| Catheter-associated bloodstream infections (CLABSI) | -1.4% | Global, particularly acute care settings | Medium term (2-4 years) |
| Stringent regulatory scrutiny & product recalls | -0.9% | Global, led by FDA and European regulators | Short term (≤ 2 years) |
| Alternate long-acting drug-delivery routes | -0.6% | Developed markets with advanced pharmaceutical infrastructure | Long term (≥ 4 years) |
| Medical-grade PU & silicone supply constraints | -1.1% | Global, with particular impact on Asia-Pacific manufacturing | Short term (≤ 2 years) |
| Source: Mordor Intelligence | |||
Catheter-associated bloodstream infections (CLABSI)
Intensive-care units still record 4.9 infections per 1,000 catheter days, with every episode adding treatment cost and mortality risk. Digital dashboards cut CLABSI rates by up to 73% but require capital investment. Chlorhexidine dressings reduce catheter colonization by 54%. Hospitals consequently favor integrated infection-control bundles, squeezing commodity vendors that lack advanced coatings.
Stringent regulatory scrutiny & product recalls
FDA alerts on catheter material fatigue and its harmonized Quality System Regulation demand costly redesigns that smaller firms struggle to meet. New 506J shortage-notification rules compel manufacturers to disclose supply disruptions six months ahead, exposing competitive information. The compliance burden accelerates consolidation in the vascular access devices market.
*Our forecasts treat driver/restraint impacts as directional, not additive. The impact forecasts reflect baseline growth, mix effects, and variable interactions.
Vascular Access Devices Market Segment Analysis
By Device Type:
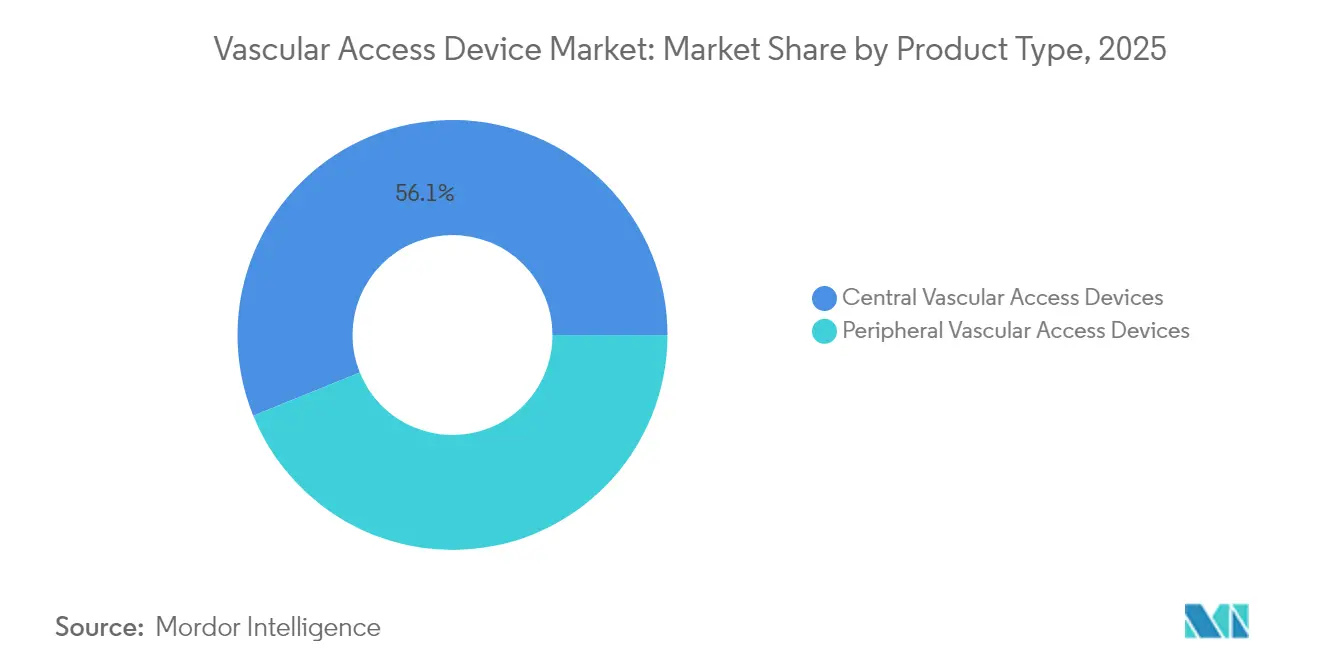
Central Dominance with Peripheral MomentumCentral devices captured 56.12% of vascular access devices market share in 2025. PICCs remain the workhorse for oncology and critical-care settings, whereas tunneled catheters support year-long therapies. Hospitals value their reliable flow and lower reinsertion frequency, even as reimbursement pressures intensify scrutiny of infection risk and dwell time.
Peripheral catheters, however, are the fastest-growing class at a 7.61% CAGR. Extended-dwell designs bridge the gap between standard PIVCs and PICCs, reducing cost and complication rates for intermediate therapies. FDA-cleared devices such as B. Braun’s Introcan Safety 2 extend median dwell to 5.7 days. Ultrasound-guided placement has broadened clinical acceptance, and antimicrobial polyurethane upgrades further differentiate offerings. As outpatient infusion volumes swell, peripheral innovations are positioned to gain additional vascular access devices market traction.



By Application:
Therapeutic Delivery Leads, Diagnostics AcceleratesMedication administration commanded 39.55% of 2025 revenue, underlining the indispensable role of safe intravenous drug delivery. Complex biologics, chemotherapy cocktails and high-osmolar solutions necessitate robust central lines and ports capable of repeated access without integrity loss. Coated lumens and pressure-tolerant hubs have become standard, supporting price premiums.
Diagnostics and testing is forecast to grow at a 7.68% CAGR as precision-medicine protocols demand serial biomarker sampling. Point-of-care devices shorten turnaround times, spurring hospitals to favor catheters with low hemolysis rates and easy blood-draw access. Manufacturers integrating multi-lumen configurations and AI-optimized geometries offer tangible workflow savings, strengthening competitive positioning within the vascular access devices market.
By End User:
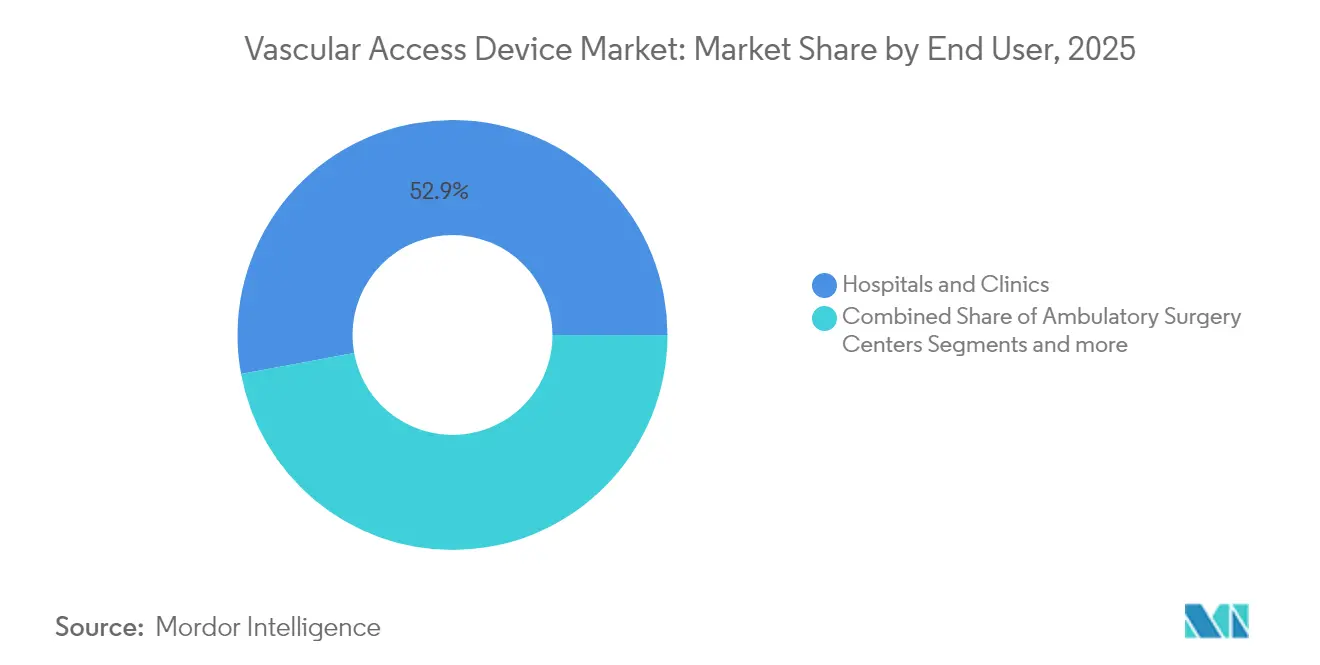
Hospitals Retain Scale, ASCs Gain VelocityHospitals and clinics generated 52.90% of 2025 revenue because critical-care, emergency and surgical departments rely on high-performance vascular access platforms. Large networks negotiate bulk contracts that bundle catheters with integrated securement and antimicrobial accessories. Supply-chain shocks have led many systems to dual-source, allowing nimble suppliers to unseat incumbents.
ASCs represent the fastest-expanding channel with an 7.77% CAGR through 2031. Newly introduced C-codes lift reimbursement for cardiac catheterization by up to USD 3,346, validating same-day procedural economics. Private-equity backed ASC chains are scaling cardiology and vascular suites, elevating demand for user-friendly kits that speed turnover. Vendors re-engineering packaging for quick procedural setup are poised to capture incremental vascular access devices market sales.
By Material:
Polyurethane Foundation, Silicone UpswingPolyurethane held 48.25% share in 2025, reflecting decades of clinical familiarity and cost efficiency. Yet the material’s 30% complication rate in catheter cases drives hospitals to seek alternatives. Tight medical-grade PU supply following PTFE shortages has prompted larger firms to verticalize extrusion or lock in long-term contracts, buffering margin impact.
Silicone, advancing at an 7.85% CAGR, benefits from superior biocompatibility that lowers thrombosis. Surface-modified silicone infused with antimicrobial agents slashes bacterial adhesion and meets long-term implant needs. Pediatric specialists increasingly specify silicone lines for fragile vessels, making the material a strategic focus area. Hybrid constructs—combining silicone flexibility with polyurethane strength—are emerging, reinforcing material innovation as a core battleground in the vascular access devices market.
Geography Analysis
North America Vascular Access Devices Market
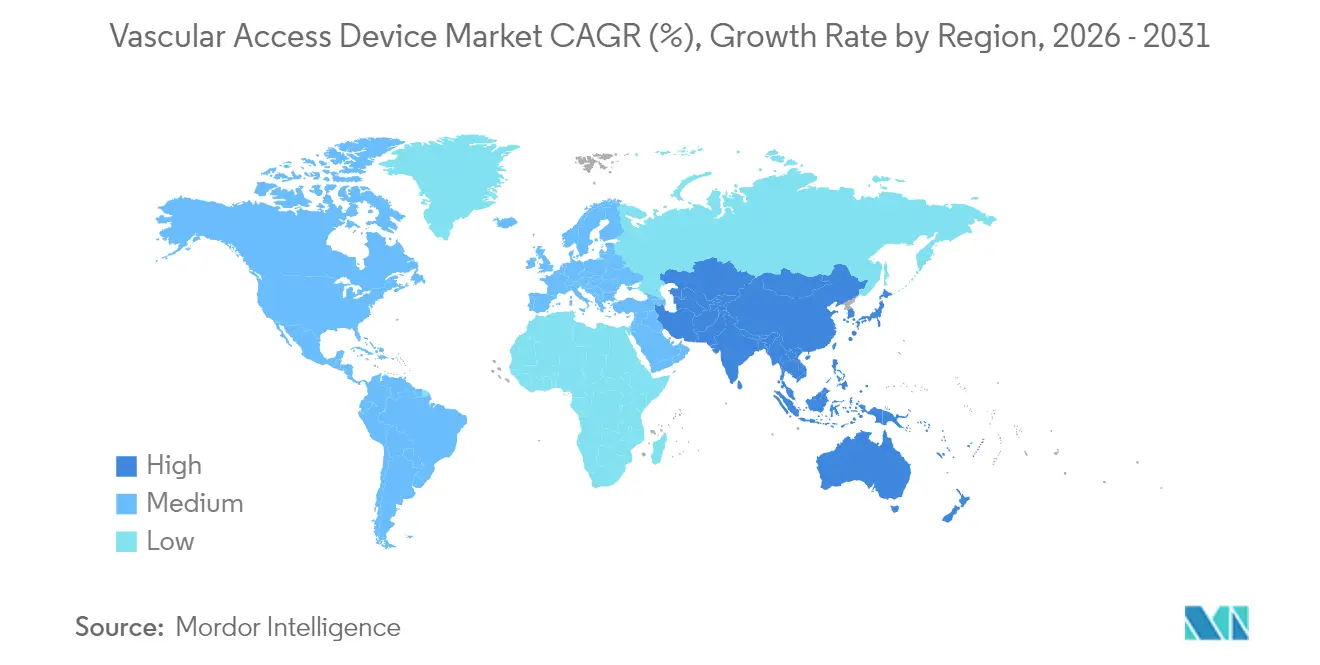
North America commanded 39.85% of 2025 revenue on the back of sophisticated healthcare infrastructure and an insurance mix that rewards infection-reduction technologies. BD invested more than USD 10 million in 2024 to expand U.S. catheter production, adding hundreds of millions of units annually and reinforcing domestic supply resilience. Terumo earmarked USD 30 million for Angio-Seal capacity in Puerto Rico, underscoring the region’s manufacturing pull.
APAC Vascular Access Devices Market
Asia-Pacific is projected to post an 7.95% CAGR through 2031, reflecting rising chronic disease prevalence and healthcare spending. China’s shift to value-based procurement is exerting price pressure, yet local champions eye export markets to offset domestic margin compression. Japan-headquartered Terumo reported that its Rika mid-clamp platform is now installed in 98 centers across the region, nearing its 100-site milestone.
Europe, Middle East and South America Vascular Access Devices Market
Europe maintains a robust installed base driven by strict infection-prevention mandates and early HTA adoption. Meanwhile, Middle Eastern health-system build-outs and South American economic recovery create pockets of high growth, especially where public insurers support outpatient infusion. Ongoing geopolitical frictions and raw-material constraints are encouraging firms to develop multi-hub sourcing models so the vascular access devices market can meet varied regional demand without disruption.

Regulatory Landscape
Vascular access devices are regulated as medical devices across major markets, with U.S. requirements centered on FDA device classification and quality system compliance for design, manufacturing, and post-market controls (including device types covered under 21 CFR 876.5540 for blood access devices). FDA scrutiny has increasingly focused on material performance and reliability in catheter systems, alongside broader U.S. policy attention to medical device oversight and supply continuity. This is raising expectations for documentation, risk management, and change control across incumbent portfolios and line extensions.
In Europe, Regulation (EU) 2017/745 (MDR) continues to shape clinical evidence and conformity assessment pathways for catheters and implantable access solutions, influencing timelines and the role of notified bodies. In March 2026, the European Commission adopted Delegated Regulation (EU) 2026/1451, updating the list of implantable and class III devices exempted from mandatory clinical investigations, and providing targeted clarity for certain catheter, cannula, and introducer categories. In Canada, Health Canada has continued modernizing medical device licensing processes, including an April 2026 shift to mandatory use of its regulatory enrolment process, reinforcing the move toward standardized, structured submissions.
Competitive Landscape
The vascular access devices market shows moderate fragmentation, with multinationals leveraging broad portfolios, infection-control IP and global distribution. BD, Teleflex and ICU Medical anchor the top tier, while mid-sized firms differentiate through niche clinical focus or advanced material science. Infection-resistant coatings remain the centerpiece of premium positioning; heparin network surface treatments have cut thrombus formation by 62.5% in preclinical work.
Technology convergence is quickening. ICU Medical and Otsuka formed a USD 200 million venture that lifts annual IV-solution capacity to 1.4 billion units and embeds closed-loop safety valves. Robotic insertion and AI-guided selection tools, though nascent, are beginning to influence procurement criteria, especially among teaching hospitals.
Portfolio rationalization continues. AngioDynamics divested its PICC and midline brands to Spectrum Vascular for USD 45 million to focus on thrombus management platforms. Supply-chain reliability is growing in strategic importance; manufacturers able to assure redundancy in resin sourcing and sterilization capacity enjoy preferential contract status. As outpatient settings expand, design priorities tilt toward ease-of-use and rapid turnover, fostering a steady pipeline of incremental innovations that keep competition brisk across the vascular access devices market.
Vascular Access Devices Industry Leaders
-
NIPRO Medical Corporation
-
B. Braun Melsungen AG
-
Baxter International Inc.
-
Becton, Dickinson and Company
-
Teleflex Inc.
- *Disclaimer: Major Players sorted in no particular order
Vascular Access Devices Market Companies Covered in this Report
- Beckton Dickinson
- Teleflex
- ICU Medical (inc. Smiths Medical)
- B. Braun
- Baxter
- Fresenius
- Medtronic
- Terumo Corp.
- Nipro Medical Corp.
- Siemens Healthineers
- AngioDynamics
- Cook Group
- Access Vascular Inc.
- Vygon
- Merit Medical Systems
- Delta Med SpA
- Poly Medicure Ltd.
- Argon Medical Devices
- Vyaire Medical
- Sam Medical

Market Opportunities and Future Outlook
Procurement is shifting away from standalone commodity catheters toward integrated insertion and workflow systems that reduce steps, limit contamination opportunities, and standardize technique in high-volume settings. A concrete proof point is BD's April 2026 commercial launch of the CentroVena One Insertion System (following FDA 510(k) clearance and FDA Safer Technologies Program acceptance), along with its June 2026 Innovative Technology contract award from Vizient, which supports faster access within provider networks focused on measurable efficiency and safety improvements. This direction creates whitespace for vendors that bundle device, insertion components, and training into standardized kits aligned with ultrasound-guided practice and difficult IV access protocols.
Material innovation is another opportunity area, particularly for long-dwell performance in chronic therapy and dialysis, where infection and thrombosis concerns support differentiation and total-cost arguments. In July 2026, Xeltis initiated European commercialization of its aXess vascular access device for hemodialysis, with a first commercial patient treatment at Artemed Klinikum Munich South, illustrating active translation of restorative biomaterial concepts into clinical use. Commercial scaling also depends on distribution leverage, illustrated by Access Vascular's multi-year co-branding and distribution agreement with Medline for HydroMID and HydroPICC catheters. Regulatory expectations further reinforce usability-led design, since FDA's May 2026 final guidance on human factors information in device marketing submissions raises the bar for risk-based usability evidence and rewards companies that embed human factors engineering earlier in development.
Recent Industry Developments in Vascular Access Devices Market
- July 2026: Xeltis began European commercialization of its aXess vascular access device for hemodialysis and reported the first commercial patient treatment at Artemed Klinikum Munich South in Germany. The milestone signals movement of restorative, biomaterial-based access conduits from development into early commercial use, raising differentiation pressure in dialysis access segments.
- June 2025: Teleflex Incorporated announced the acquisition of BIOTRONIK's Vascular Intervention business for approximately EUR 760 million. The deal broadens Teleflex's interventional footprint and strengthens cross-selling potential into procedures that rely on compatible access and catheter technologies.
- October 2024: BD introduced the BD Intraosseous Vascular Access System for emergency settings where conventional IV placement is delayed. The launch expands BD's access portfolio into time-critical care pathways, supporting hospitals and EMS providers seeking faster vascular access options when peripheral insertion is challenging.


Vascular Access Devices Market Report Scope and Research Methodology
Market Definition and Coverage
This market covers revenues from vascular access devices used to access the venous system for infusion, fluid and nutrition delivery, blood sampling, dialysis access, and monitoring in care settings.
Scope exclusions: We exclude diagnostic guidewires, vascular closure devices, and peripheral stents from the market totals.
Segments Covered in This Report
-
By Device Type
-
Central Vascular Access Devices
- Peripherally-Inserted Central Catheters (PICCs)
- Non-tunnelled Catheters
- Tunnelled Catheters
- Other Central Vascular Access Devices
-
Peripheral Vascular Access Devices
- Peripheral IV Catheters (PIVC)
- Midline Catheters
- Other Peripheral Vascular Access Devices
-
Central Vascular Access Devices
-
By Application
- Medication or Drug Administration
- Fluid and Nutrition Administration
- Blood and Blood-Product Transfusion
- Diagnostics and Testing
- Other Applications
-
By End User
- Hospitals & Clinics
- Ambulatory Surgery Centers
- Others
-
By Material
- Polyurethane
- Silicone
- Others
-
By Geography
-
North America
- United States
- Canada
- Mexico
-
Europe
- Germany
- United Kingdom
- France
- Italy
- Spain
- Rest of Europe
-
Asia-Pacific
- China
- Japan
- India
- Australia
- South Korea
- Rest of Asia-Pacific
-
Middle East and Africa
- GCC
- South Africa
- Rest of Middle East and Africa
-
South America
- Brazil
- Argentina
- Rest of South America
-
North America
Data Sources, Market Sizing, and Validation
Desk Research
Desk research sets the fact base for demand and procedure context before any modeling assumptions are applied. We typically start with public health and utilization signals, such as the CDC for infection and hospitalization indicators, the WHO for disease burden directionally, and OECD health statistics for system level activity patterns.
To connect that demand pool to devices, we also review sources such as CMS datasets for procedure and setting mix signals in the US, FDA databases for device clearances and safety actions, and peer reviewed journals that discuss catheter dwell time and complication rates. Company filings, investor presentations, and reputable press are then used to confirm product mix direction and regional exposure, supported where relevant by paid subscriptions for company financials, news, and patent intelligence. These examples are not exhaustive, and many other public and subscription sources were also used for collection, cross-checking, and clarifying gaps.
Primary Interviews and Surveys
Primary work focuses on confirming where desk sources do not show the link cleanly, especially how procedure activity converts into device volumes and how pricing maps to the realized ASP. We spoke with manufacturers, distributors, hospital procurement teams, clinicians, and infection prevention roles across APAC, EMEA, and the Americas, so assumptions on utilization, replacement, and pricing could be stress tested and then adjusted.
Distribution of primary research fieldwork respondents
| Company type | Respondent position | Region |
|---|---|---|
| Top tier: 38% | CXOs: 16% | APAC: 41% |
| Mid tier: 40% | Functional/Unit leaders: 25% | EMEA: 32% |
| Smaller Players: 22% | Managers: 59% | Americas: 27% |
Market-Sizing & Forecasting
Sizing is built mainly from a top-down pathway where procedure volumes and therapy use reconstruct the addressable demand pool for venous access, which is then translated into device units by care setting and typical line usage. Once that structure is in place, we check totals with selective bottom-up approximations using sampled unit volumes and average selling prices (ASP) by device family, followed by channel checks to catch over-counting.
Key inputs include central line and peripheral IV utilization patterns, dialysis access activity, average dwell time and replacement frequency, hospital and outpatient setting mix, and the share shift toward longer dwell options such as PICCs and ports. Price behavior is handled through an ASP ladder that is refreshed by device type and region, and then converted to USD using the year specific average exchange rates to avoid mixing timing.
For forecasting, we use scenario analysis because uptake and replacement can move with infection-control protocols, staffing constraints, and guideline changes. Assumptions are aligned to what primary respondents expect for utilization intensity, mix shift, and pricing pressure, and any thin data pockets are filled using conservative proxy ratios that are later rechecked during validation.
Data Validation & Update Cycle
Outputs are validated through multiple checks, where demand indicators, procedure direction, and implied per procedure device usage are compared against independent signals from public datasets and interview feedback. When a region shows an unusual swing, we trace it back to the specific variable, and respondents are re-contacted if the change cannot be explained by a known event.
Before sign-off, the model is reviewed in steps so the math, assumptions, and currency handling are internally consistent. The report is refreshed annually, and interim updates are made when material events occur that can change volumes or ASPs. Right before delivery, a final pass is completed so clients receive the latest updated view.
Mordor Intelligence's Vascular Access Device Market Estimate Compared With Other Published Estimates
Published market values for vascular access devices can vary even when the topic sounds similar, because the boundaries around what counts as a vascular access device are not always applied the same way. Differences also come from how pricing is treated over time, how currencies are converted, and how frequently assumptions are refreshed.
In many models, ASPs are carried forward using broad inflation factors, or FX rates are applied from a different timing window, which can lift or compress the same unit base. The spread also grows when adjacent items like guidewires or other procedure accessories are included, or when utilization and replacement assumptions are not rechecked after practice changes. By refreshing the ASP ladder and currency timing in line with the study year, and revalidating utilization with periodic re-contacts, Mordor Intelligence reduces drift that can build up in longer forecast runs.
Benchmark comparison
| Source | Market Size | Gaps in Research Methodology |
|---|---|---|
| Mordor Intelligence | USD 6.68 B (2026) | |
| Global Research Publisher A | USD 8.64 B (2024) | Uses an earlier base year and a broader product basket presentation, and the uplift versus 2026 can be amplified when price progression and FX timing are not aligned to the same reference year. |
| Healthcare Analytics Firm B | USD 5.45 B (2024) | Shows a lower 2024 starting point that can come from narrower inclusion rules and conservative utilization or replacement assumptions, which reduces implied units even before forecasting is applied. |
Across the three figures, most of the variance is explained by year alignment and what gets counted inside the device boundary, followed by how ASP and currency are carried forward. When these items are made explicit and rechecked, the resulting number stays easier to trace back to repeatable demand and pricing drivers.


Key Questions Answered in the Report
What is the current vascular access devices market size and its projected growth rate?
The market is valued at USD 6.68 billion in 2026 and is forecast to grow at a 6.92% CAGR, reaching USD 9.34 billion by 2031.
Which device category commands the largest share and which is expanding the fastest?
Central vascular access devices lead with a 56.12% share in 2025, while peripheral devices post the highest growth at a 7.61% CAGR through 2031.
Which region contributes the most revenue, and which shows the strongest growth momentum?
North America accounts for 39.85% of global revenue in 2025, whereas Asia-Pacific is set to advance at an 7.95% CAGR.
What primary driver has the greatest positive influence on market expansion?
The rising burden of chronic diseases and high IV-therapy demand adds an estimated +2.1% to the overall CAGR.
How do hospitals compare with ambulatory surgery centers (ASCs) in market performance?
Hospitals and clinics hold 52.90% market share in 2025, whereas ASCs are the fastest-growing channel at an 7.77% CAGR.
Which materials dominate, and which material segment is growing quickest?
Polyurethane maintains a 48.25% share, while silicone is the fastest-growing material with an 7.85% CAGR.
Page last updated on:





