Blood Cell Factors Market Size and Share
Market Overview
| Study Period | 2019 - 2030 |
|---|---|
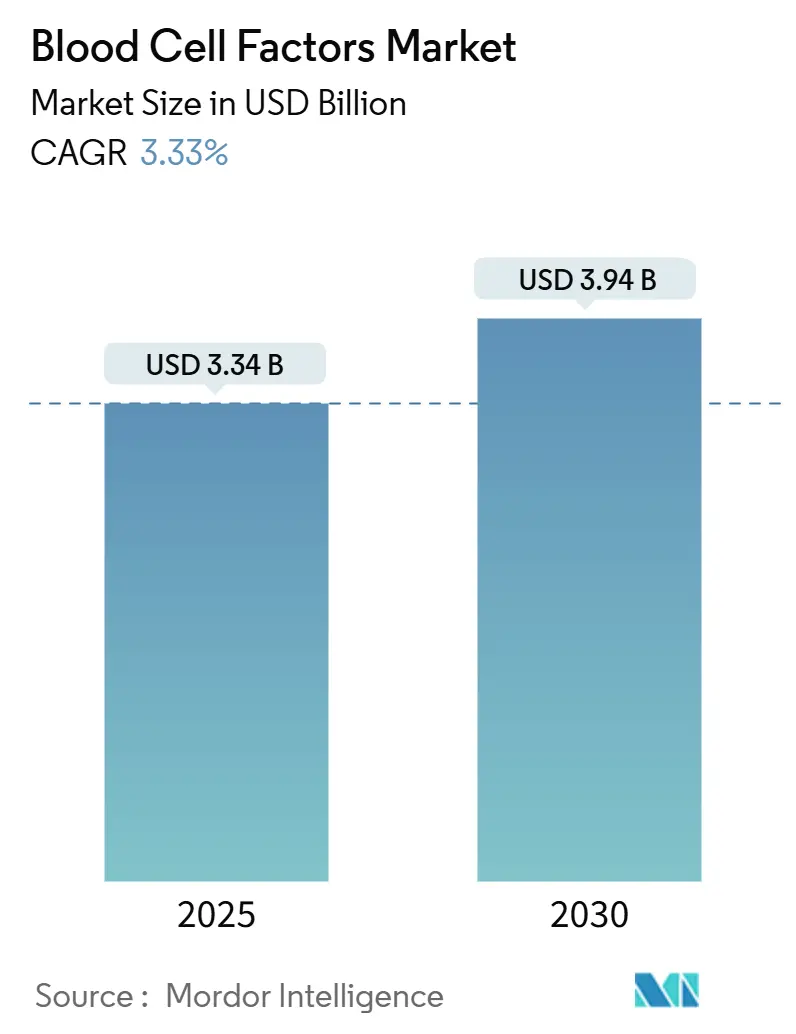
| Market Size (2025) | USD 3.34 Billion |
| Market Size (2030) | USD 3.94 Billion |
| Growth Rate (2025 - 2030) | 3.33% CAGR |
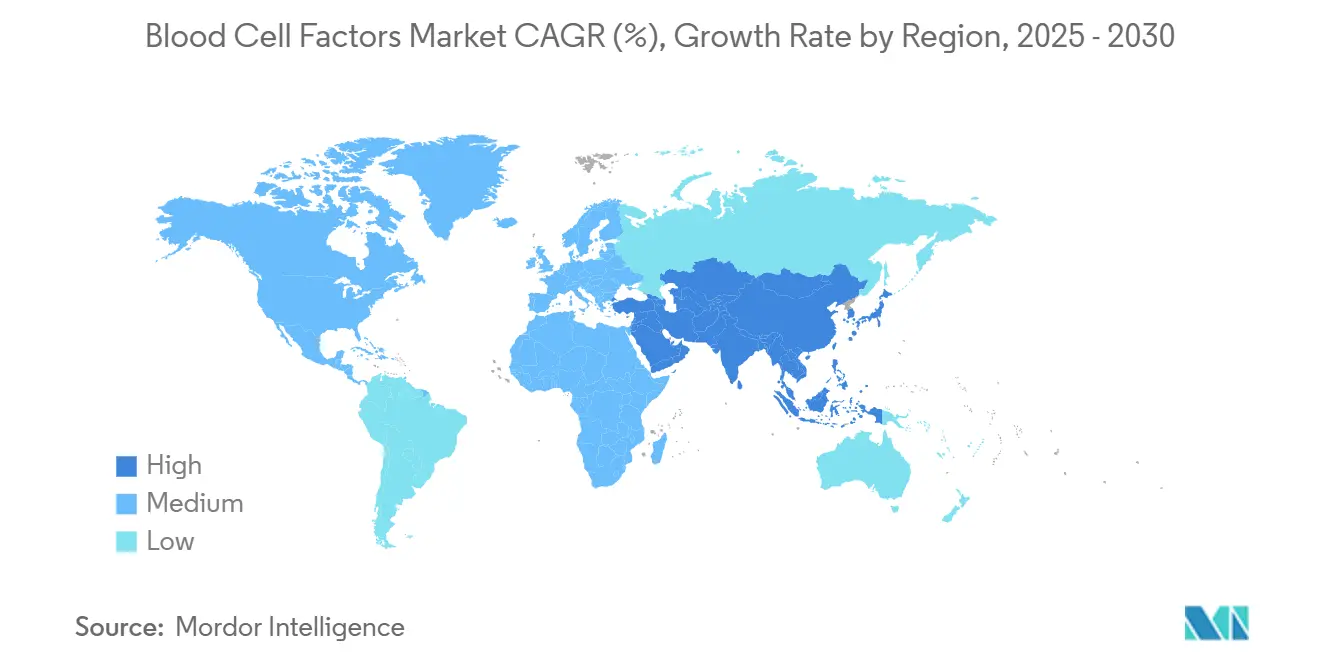
| Fastest Growing Market | Asia Pacific |
| Largest Market | North America |
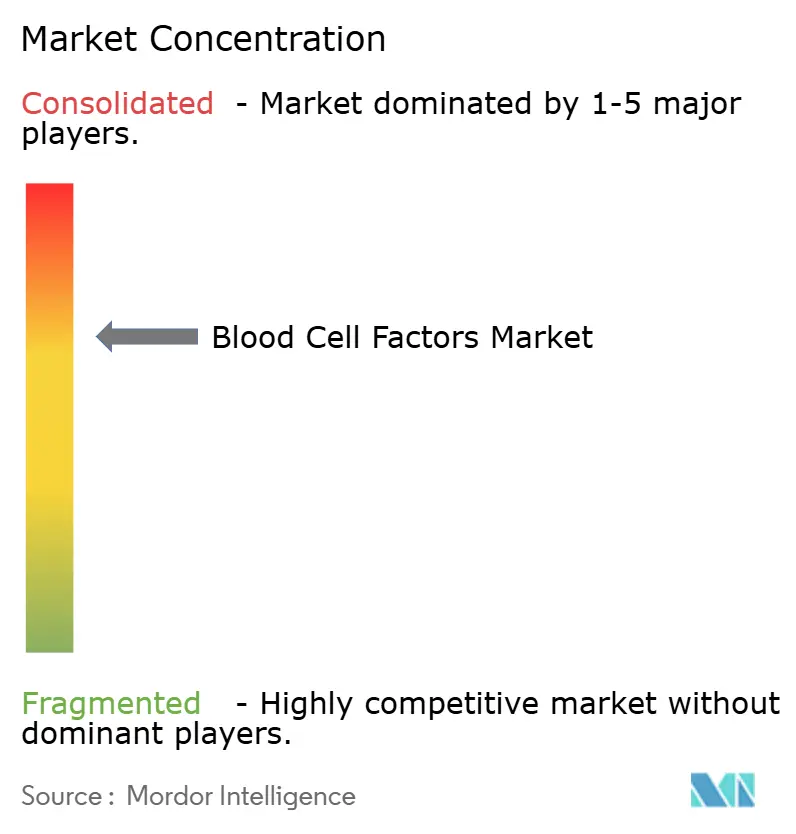
| Market Concentration | Medium |
Major Players *Disclaimer: Major Players sorted in no particular order Image © Mordor Intelligence. Reuse requires attribution under CC BY 4.0. | |
Blood Cell Factors Market Analysis by Mordor Intelligence
The blood cell factors market size stood at USD 3.34 billion in 2025 and is forecast to reach USD 3.94 billion by 2030, advancing at a 3.33% CAGR across the period. This steady expansion reflects the migration from conventional recombinant proteins toward gene-therapy vectors, AI-guided dosing platforms, and point-of-care manufacturing models. The U.S. FDA’s approval of RYTELO (imetelstat) in 2024 signaled the first telomerase-inhibition approach for myelodysplastic syndromes, while Pfizer’s USD 3.5 million-per-dose Beqvez gene therapy for hemophilia B highlighted the pricing leverage of curative modalities.[1]U.S. Food and Drug Administration Staff, “FDA approves imetelstat for low- to intermediate-1 risk myelodysplastic syndromes with transfusion-dependent anemia,” Food and Drug Administration, fda.gov Gene-therapy vectors already exhibit the fastest segment growth as hospitals face supply-chain strains, contract manufacturers grapple with workforce shortages, and regulators clear decentralized production. At the same time, biosimilar competition and patent expiries pressure established franchises, forcing incumbents to pivot toward longer-acting fusion proteins and novel mechanisms.
Key Report Takeaways
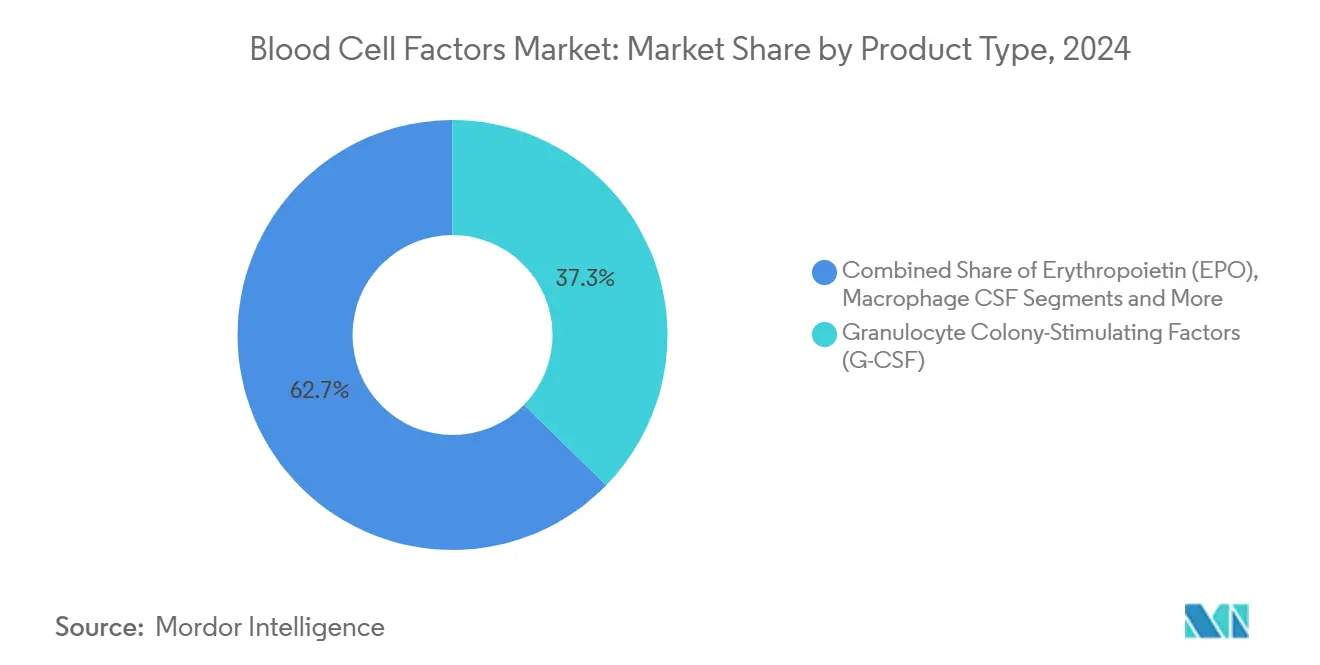
- By product category, granulocyte colony-stimulating factors led with 37.31% revenue share of the blood cell factors market share in 2024, while gene-therapy vectors are projected to expand at a 7.24% CAGR through 2030.
- By source type, recombinant DNA–derived products held 68.26% share of the blood cell factors market size in 2024, whereas gene-therapy vectors post the highest 7.89% CAGR to 2030.
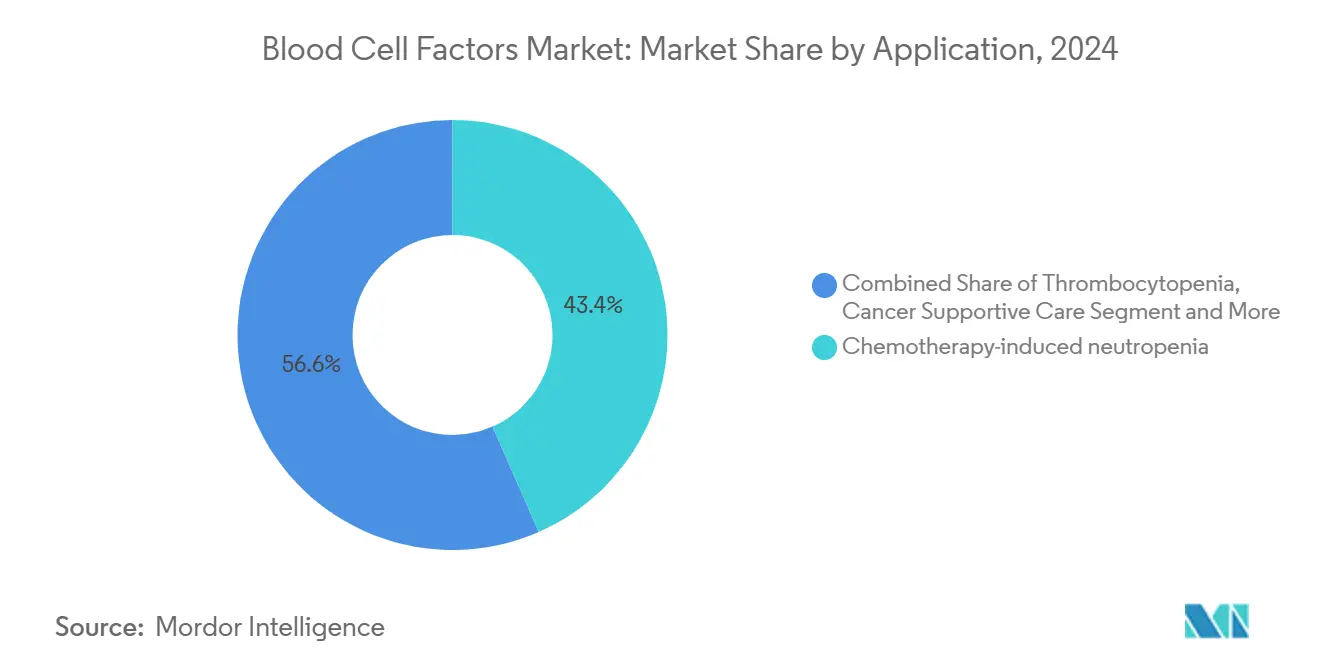
- By application, chemotherapy-induced neutropenia accounted for 43.43% share of the blood cell factors market size in 2024; stem-cell transplant support is advancing at a 6.28% CAGR through 2030.
- By end user, hospitals commanded 58.63% of the blood cell factors market share in 2024, yet specialty clinics record the fastest 5.29% CAGR to 2030.
- By geography, North America held 39.48% share of the blood cell factors market size in 2024, while Asia-Pacific shows the highest 5.38% CAGR to 2030.
Global Blood Cell Factors Market Trends and Insights
Drivers Impact Analysis*
| Driver | (~) % Impact on CAGR Forecast | Geographic Relevance | Impact Timeline |
|---|---|---|---|
| Increasing prevalence of anemia & neutropenia | +0.8% | Global, strongest in aging North American & European populations | Long term (≥ 4 years) |
| Growing adoption of recombinant growth factors | +0.6% | North America, Europe, rising Asia-Pacific uptake | Medium term (2-4 years) |
| Rising hematopoietic stem-cell transplants | +0.5% | North America & Europe core, Asia-Pacific acceleration | Medium term (2-4 years) |
| Emergence of biospecific fusion cytokines | +0.4% | Early adoption in North America & Europe | Long term (≥ 4 years) |
| AI-guided dose-titration platforms | +0.3% | North America leads, Europe follows | Short term (≤ 2 years) |
| Point-of-care manufacturing of personalized cytokines | +0.2% | U.K. and North America first movers | Medium term (2-4 years) |
| Source: Mordor Intelligence | |||
Increasing Prevalence of Anemia & Neutropenia
An aging global population raises chronic kidney disease incidence, heightening demand for erythropoiesis-stimulating agents. FDA authorization of vadadustat in 2024 introduced a hypoxia-inducible pathway alternative, broadening therapeutic options.[2]U.S. Food and Drug Administration Staff, “VAFSEO (vadadustat) Tablets, for Oral Use,” Food and Drug Administration, fda.gov High-dose chemotherapy and CAR-T regimens intensify cytopenias, ensuring ongoing granulocyte colony-stimulating factor use. Myelodysplastic syndrome cases among seniors further support adoption of telomerase inhibitors, while broader immunocompromised populations drive prophylactic neutropenia management in oncology and transplant settings.
Growing Adoption of Recombinant Growth Factors
Process optimization now delivers ≥ 99% purity in E. coli systems, lowering costs and improving global access.[3]Shai Izraeli, “Development of VLA4 and CXCR4 Antagonists for the Mobilization of Hematopoietic Stem and Progenitor Cells,” Biomolecules, mdpi.com Biosimilar entrants slash prices 25-30%, particularly in Europe, stimulating wider treatment coverage. Fc-fusion engineering lengthens half-life, cutting injection frequency and elevating adherence. Enhanced lot-to-lot consistency addresses historical immunogenicity worries, and plasma-derived alternatives lose share amid supply and safety constraints.
Rising Hematopoietic Stem-Cell Transplants
European data logged 3,205 CAR-T recipients in 2022, underlining the shift to cellular therapies.FDA approval of motixafortide added a CXCR4 antagonist to mobilization toolkits, raising collection efficiency.[4]Xiang Li, “Scaling up production of recombinant human basic fibroblast growth factor in an Escherichia coli strain,” Frontiers in Pharmacology, frontiersin.org Gene-editing cures like CASGEVY and LYFGENIA depend on autologous stem-cell manipulation, expanding growth-factor needs during conditioning and engraftment phases. Indications now span autoimmune and inherited disorders, enlarging the patient pool.
Emergence of Biospecific Fusion Cytokines
CD20×CD3 bispecific antibodies achieved high response rates in large B-cell lymphoma, illustrating multivalent targeting power. Next-gen IL-2 variants selectively expand regulatory T cells, promising safer autoimmune interventions. Fusion constructs boost half-life and specificity, allowing premium pricing. Although manufacturing is complex, clinical benefit fuels market uptake, particularly when combined with checkpoint inhibitors.
Restraints Impact Analysis*
| Restraint | (~) % Impact on CAGR Forecast | Geographic Relevance | Impact Timeline |
|---|---|---|---|
| Patent expiries causing price erosion | -0.7% | Mature North American & European markets | Short term (≤ 2 years) |
| Safety concerns (e.g., thrombosis with EPO) | -0.4% | Heightened scrutiny in North America & Europe | Medium term (2-4 years) |
| Supply-chain fragility for plasmid vectors | -0.3% | North America, Europe, Asia-Pacific hubs | Short term (≤ 2 years) |
| Regulatory uncertainty for gene-edited analogs | -0.2% | Diverse global standards | Long term (≥ 4 years) |
| Source: Mordor Intelligence | |||
Patent Expiries Causing Price Erosion
Biosimilar epoetins entered European markets with 25-30% discounts, quickly shifting prescribing patterns and shrinking originator revenue pools. Originators now compete on service and portfolio breadth rather than exclusivity. Pharmacy benefit managers leverage biosimilars to drive deeper rebates, accelerating erosion. The resulting margin squeeze forces reinvestment toward breakthrough therapies.
Safety Concerns (E.G., Thrombosis With EPO)
Regulators intensified post-marketing surveillance after erythropoietin thrombosis reports, while a 2025 FDA clinical hold on Sarepta’s Elevidys gene therapy underscored willingness to intervene when signals emerge. Although thrombopoietin receptor agonists did not significantly raise thrombotic risk in meta-analyses, developers now budget for longer safety follow-up, extending timelines and costs.
*Our forecasts treat driver/restraint impacts as directional, not additive. The impact forecasts reflect baseline growth, mix effects, and variable interactions.
Segment Analysis
By Product Type: Gene Vectors Drive Innovation
Gene-therapy vectors now form the fastest-growing product, posting a 7.24% CAGR through 2030, while granulocyte colony-stimulating factors retain the leading 37.31% revenue share. FDA clearance of lentiviral LYFGENIA at USD 3.5 million per patient underpins the blood cell factors market’s premium segment pricing. Patent headwinds push erythropoietin volumes but cap revenue, and granulocyte-macrophage CSF fulfills niche mobilization roles. Thrombopoietin agonists sustain growth thanks to an improved risk profile, whereas interleukins serve specialized marrow-failure cases. Emerging biospecific fusion cytokines populate the “others” bucket, extending the innovation frontier.
Recombinant franchises still enjoy broad reimbursement; however, each biosimilar arrival trims average selling prices, incentivizing product differentiation via long-acting conjugates and combo regimens. Developers see gene vectors as lifetime cures rather than recurring injections, aligning with payer interest in one-and-done solutions despite high upfront cost.


By Source Type: Recombinant DNA Dominance Challenged
Recombinant DNA products held 68.26% of 2024 revenue, yet gene-therapy vectors accelerate at 7.89% CAGR as a curative model displaces chronic protein replacement. Enhanced microbial expression and downstream purification drive cost leadership for recombinant DNA, fostering global penetration where health budgets remain constrained. By contrast, plasma-derived products face supply and pathogen-transmission worries that stall uptake. Small-molecule mimetics address oral-dose niches such as HIF stabilization, carving limited but steady slices.
Curative promise means gene-vector makers absorb higher manufacturing complexity. Specialists invest in viral vector suites and closed-system production, confident that premium list prices offset capital intensity. As regulatory familiarity grows, more contract sites come online, gradually easing current capacity pinch.
By Application: Transplant Support Accelerates
Chemotherapy-induced neutropenia commanded 43.43% of 2024 spending thanks to entrenched oncology use, yet stem-cell transplant support posts a 6.28% CAGR to 2030. CAR-T uptake drives additional conditioning cycles and engraftment support, amplifying colony-stimulating factor volumes. Advanced mobilizing drugs give clinicians alternatives to G-CSF, but combination regimens still require baseline growth-factor support. The anemia-of-CKD segment remains a high-volume, cost-sensitive domain where biosimilar EPO competes fiercely.
Thrombocytopenia care benefits from better safety data on thrombopoietin agonists, while novel indications in autoimmune and inherited diseases expand supportive-care use. Diverse applications balance business cycles, cushioning revenue fluctuations when any single therapeutic area stalls.
By End User: Specialty Clinics Rise
Hospitals and clinics accounted for 62.31% of the cancer biological therapy market share in 2024, reflecting their entrenched infusion infrastructure and broad payer contracts. Steady patient inflow, integrated diagnostic services, and established multidisciplinary teams keep these facilities central to therapy delivery. Their dominance is reinforced by favorable reimbursement codes for intravenous and subcutaneous biologics as well as mature pharmacovigilance systems. Nonetheless, capacity constraints in high-volume urban hospitals have prompted referral shifts to specialized centers. These hospitals continue to refine cytokine release syndrome and neurotoxicity management protocols, sustaining physician confidence in complex treatments.
Cancer treatment centers are projected to grow at an 8.24% CAGR through 2030, enlarging their portion of the cancer biological therapy market size as they internalize point-of-care CAR-T manufacturing and round-the-clock critical care. Concentrated expertise reduces post-infusion complications, boosting payer acceptance and shortening wait times. Academic and research institutes complement this ecosystem by running early-phase trials, accelerating translational insights that migrate quickly into treatment-center protocols. Heightened collaboration among these three end-user groups strengthens the overall supply chain and broadens patient access to cutting-edge biological therapies.
Geography Analysis
North America remains the revenue leader, leveraging established reimbursement and concentrated biomanufacturing. Canada and Mexico add specialized production and trial networks, while U.S. academic-industry alliances speed first-in-human studies. AI-guided dosing pilots gain early traction given broad electronic health-record integration.
Europe’s joint procurement fosters biosimilar penetration, freeing budget for innovative options. Germany and France prioritize hospital budgets for long-acting cytokines; Italy and Spain adopt decentralized production models as labor costs decline. The U.K.’s MHRA framework positions Britain as a regulatory sandbox for modular ATMP plants, attracting inward investment.
Asia-Pacific’s outsize growth stems from regulatory liberalization, government incentives, and sizable patient pools. Japan’s super-aging society raises anemia and neutropenia incidence, while China’s volume-based procurement balances budget pressure with access to new modalities. India’s biosimilar exports support local adoption, and Australia-South Korea clinical networks accelerate regional trials.

Competitive Landscape
The blood cell factors market shows moderate concentration. Amgen, Johnson & Johnson, and Pfizer combine legacy franchises with gene-therapy pipelines, leveraging scale and regulatory muscle. Amgen logged USD 8,041 million Q2 2024 sales across its hematology portfolio. New entrants pursue niche innovation: Telomerase inhibitors from Geron (via partner Janssen), CD3-bispecifics from Roche/Genentech, and CRISPR spinouts developing ex vivo edits. Biosimilar specialists such as Celltrion received multiple 2025 U.S. approvals, broadening competitive intensity.
Strategic themes include vertical manufacturing integration, regional capacity builds, and digital-manufacturing convergence. Kyowa Kirin’s U.S. biologics plant secures North American supply, while several Big Pharma groups partner with AI start-ups to embed dose-optimization software into clinical protocols. Contract developers invest in continuous-flow and closed-system vector suites to capture outsourced gene-therapy demand.
Blood Cell Factors Industry Leaders
Amgen
Johnson & Johnson (Janssen)
Sandoz
F. Hoffmann-La Roche Ltd
Teva Pharmaceutical
- *Disclaimer: Major Players sorted in no particular order

Recent Industry Developments
- March 2025: Celltrion won FDA approval for STOBOCLO and OSENVELT denosumab biosimilars, aiming for June 2025 launch.
- March 2025: FDA cleared Qfitlia (fitusiran) for prophylaxis in hemophilia A/B, demonstrating 73% bleed-rate reduction.
- February 2025: Celltrion’s AVTOZMA secured FDA nod as an ACTEMRA biosimilar for multiple inflammatory disorders.
- November 2024: StemCyte received FDA license for REGENECYTE cord-blood stem-cell therapy for blood and immune diseases.


Global Blood Cell Factors Market Report Scope
| Erythropoietin (EPO) |
| Granulocyte Colony-Stimulating Factors (G-CSF) |
| Granulocyte-Macrophage CSF (GM-CSF) |
| Macrophage CSF (M-CSF) |
| Thrombopoietin & MPL agonists |
| Interleukins (IL-3, IL-11) |
| Others |
| Recombinant DNA-derived |
| Plasma-derived |
| Small-molecule mimetics |
| Gene-therapy vectors |
| Anemia associated with CKD |
| Chemotherapy-induced neutropenia |
| Thrombocytopenia |
| Stem-cell transplant support |
| Cancer supportive care |
| Others |
| Hospitals |
| Specialty Clinics |
| Research & Academic Institutions |
| Home-care Settings |
| Biopharma Companies |
| North America | United States |
| Canada | |
| Mexico | |
| Europe | Germany |
| United Kingdom | |
| France | |
| Italy | |
| Spain | |
| Rest of Europe | |
| Asia-Pacific | China |
| Japan | |
| India | |
| Australia | |
| South Korea | |
| Rest of Asia-Pacific | |
| Middle East and Africa | GCC |
| South Africa | |
| Rest of Middle East and Africa | |
| South America | Brazil |
| Argentina | |
| Rest of South America |
| By Product Type | Erythropoietin (EPO) | |
| Granulocyte Colony-Stimulating Factors (G-CSF) | ||
| Granulocyte-Macrophage CSF (GM-CSF) | ||
| Macrophage CSF (M-CSF) | ||
| Thrombopoietin & MPL agonists | ||
| Interleukins (IL-3, IL-11) | ||
| Others | ||
| By Source Type | Recombinant DNA-derived | |
| Plasma-derived | ||
| Small-molecule mimetics | ||
| Gene-therapy vectors | ||
| By Application | Anemia associated with CKD | |
| Chemotherapy-induced neutropenia | ||
| Thrombocytopenia | ||
| Stem-cell transplant support | ||
| Cancer supportive care | ||
| Others | ||
| By End User | Hospitals | |
| Specialty Clinics | ||
| Research & Academic Institutions | ||
| Home-care Settings | ||
| Biopharma Companies | ||
| By Geography | North America | United States |
| Canada | ||
| Mexico | ||
| Europe | Germany | |
| United Kingdom | ||
| France | ||
| Italy | ||
| Spain | ||
| Rest of Europe | ||
| Asia-Pacific | China | |
| Japan | ||
| India | ||
| Australia | ||
| South Korea | ||
| Rest of Asia-Pacific | ||
| Middle East and Africa | GCC | |
| South Africa | ||
| Rest of Middle East and Africa | ||
| South America | Brazil | |
| Argentina | ||
| Rest of South America | ||


Key Questions Answered in the Report
What is the present value of the blood cell factors market?
The blood cell factors market size reached USD 3.34 billion in 2025.
How fast is the market expected to grow through 2030?
It is projected to register a 3.33% CAGR and reach USD 3.94 billion by 2030.
Which product segment shows the quickest growth?
Gene-therapy vectors are expanding at 7.24% CAGR, the fastest among all product categories.
Why are specialty clinics gaining importance?
New point-of-care manufacturing rules let clinics produce autologous cytokines on-site, lifting their forecast growth to 5.29% CAGR.
Which region offers the highest growth rate?
Asia-Pacific is forecast to advance at a 5.38% CAGR owing to regulatory reforms and growing biologics investments.
How are biosimilars affecting pricing?
Post-patent biosimilar entry has driven 25-30% price reductions for epoetin products across Europe, putting pressure on original brands.
Page last updated on:


