Anemia Treatment Market Size and Share
Market Overview
| Study Period | 2020 - 2031 |
|---|---|
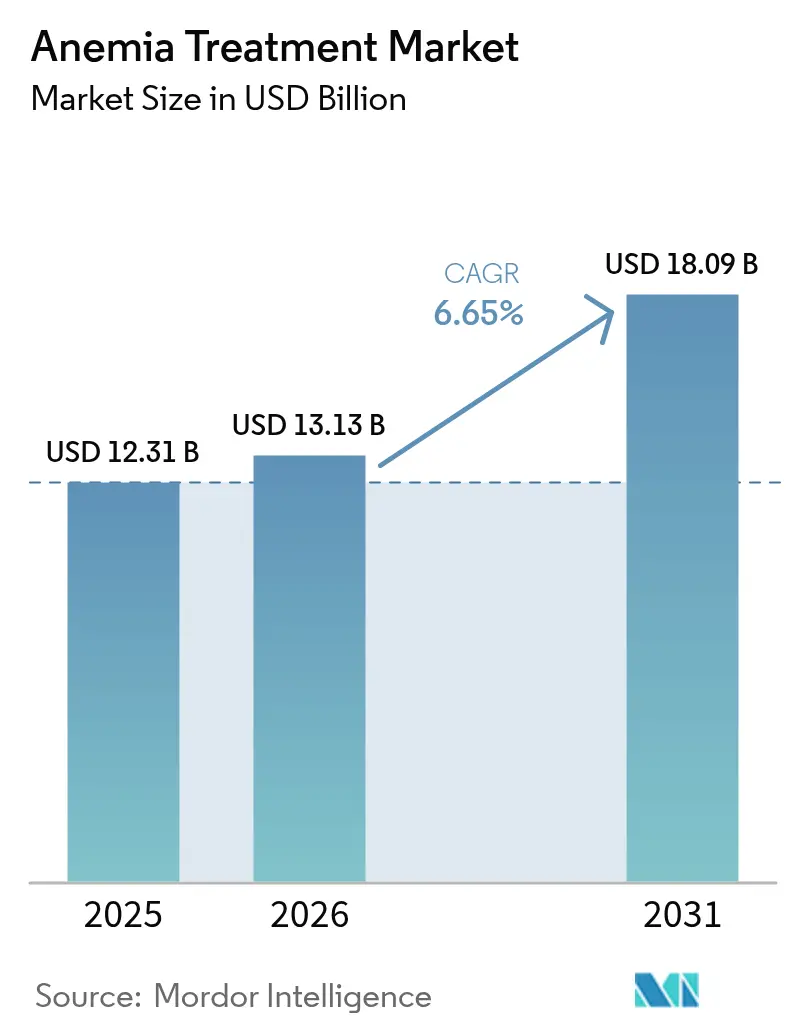
| Market Size (2026) | USD 13.13 Billion |
| Market Size (2031) | USD 18.09 Billion |
| Growth Rate (2026 - 2031) | 6.65% CAGR |
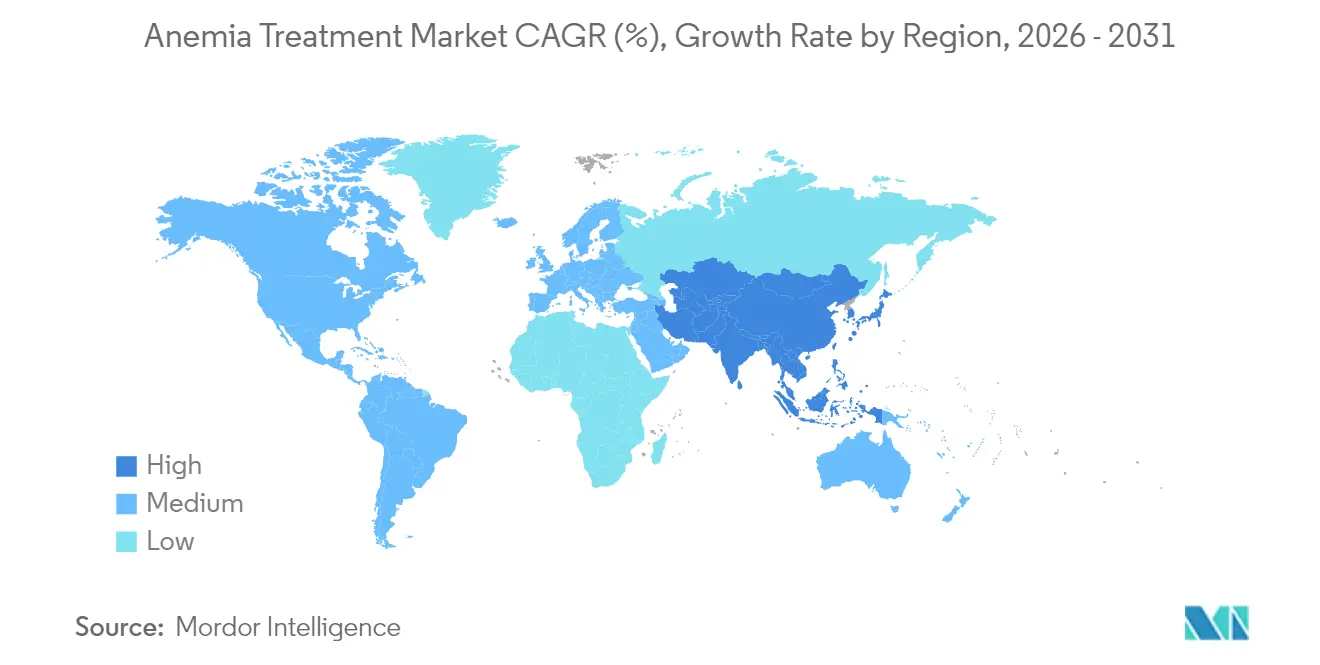
| Fastest Growing Market | Asia-Pacific |
| Largest Market | North America |
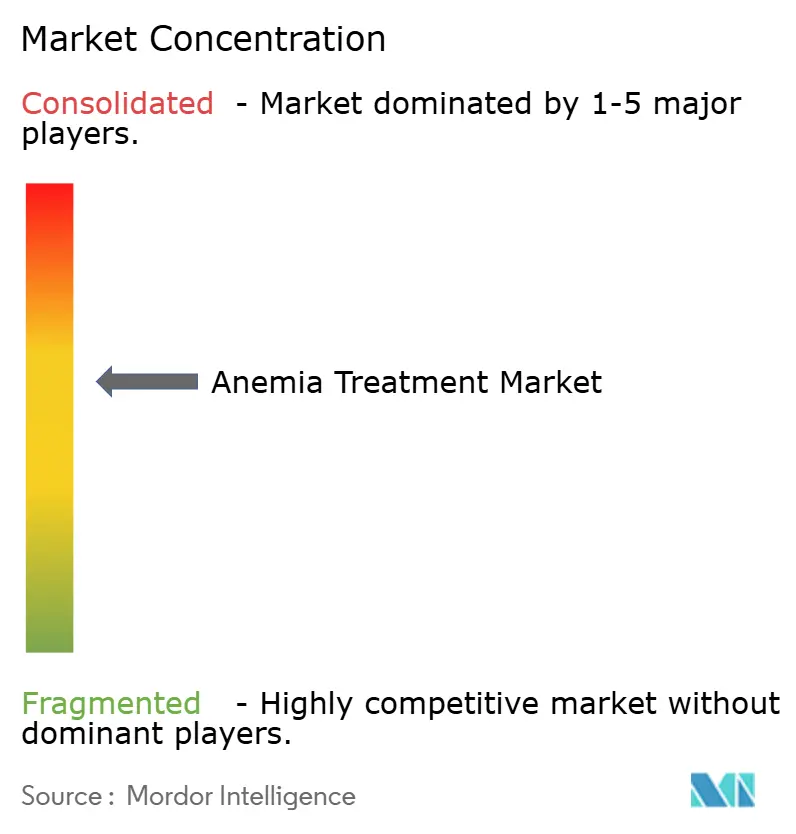
| Market Concentration | Medium |
Major Players *Disclaimer: Major Players sorted in no particular order Image © Mordor Intelligence. Reuse requires attribution under CC BY 4.0. | |
Anemia Treatment Market Analysis by Mordor Intelligence
The anemia treatment market size was valued at USD 12.31 billion in 2025 and estimated to grow from USD 13.13 billion in 2026 to reach USD 18.09 billion by 2031, at a CAGR of 6.65% during the forecast period (2026-2031). Rising global prevalence, faster diagnosis, and successive therapeutic breakthroughs combine to accelerate growth. Intravenous iron and injectable biologics still drive revenue, yet oral HIF-PH inhibitors and gene therapies attract the most attention because they promise easier dosing, better safety, and even curative outcomes. Strengthening nutrition programs in Asia Pacific and Africa widen treatment reach, while AI-enabled point-of-care devices lower diagnostic barriers in resource-constrained settings. Regulatory approvals for products such as CASGEVY underscore how innovation is moving from supportive care to disease modification, supporting sustained investment flows and strategic partnerships.
Key Report Takeaways
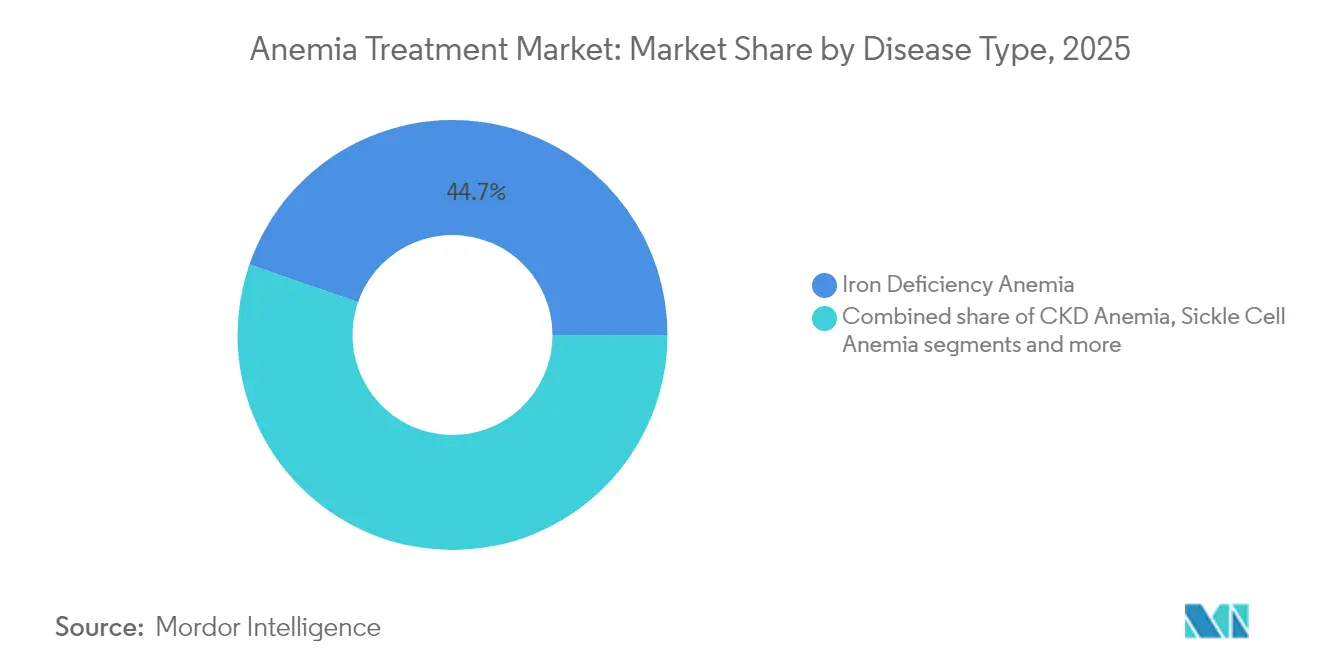
- By disease type, iron deficiency anemia held 44.68% of the anemia treatment market share in 2025, whereas sickle cell anemia is projected to grow at an 8.15% CAGR through 2031.
- By therapy class, intravenous iron commanded 36.23% of revenue in 2025, while HIF-PH inhibitors are advancing at an 7.90% CAGR to 2031.
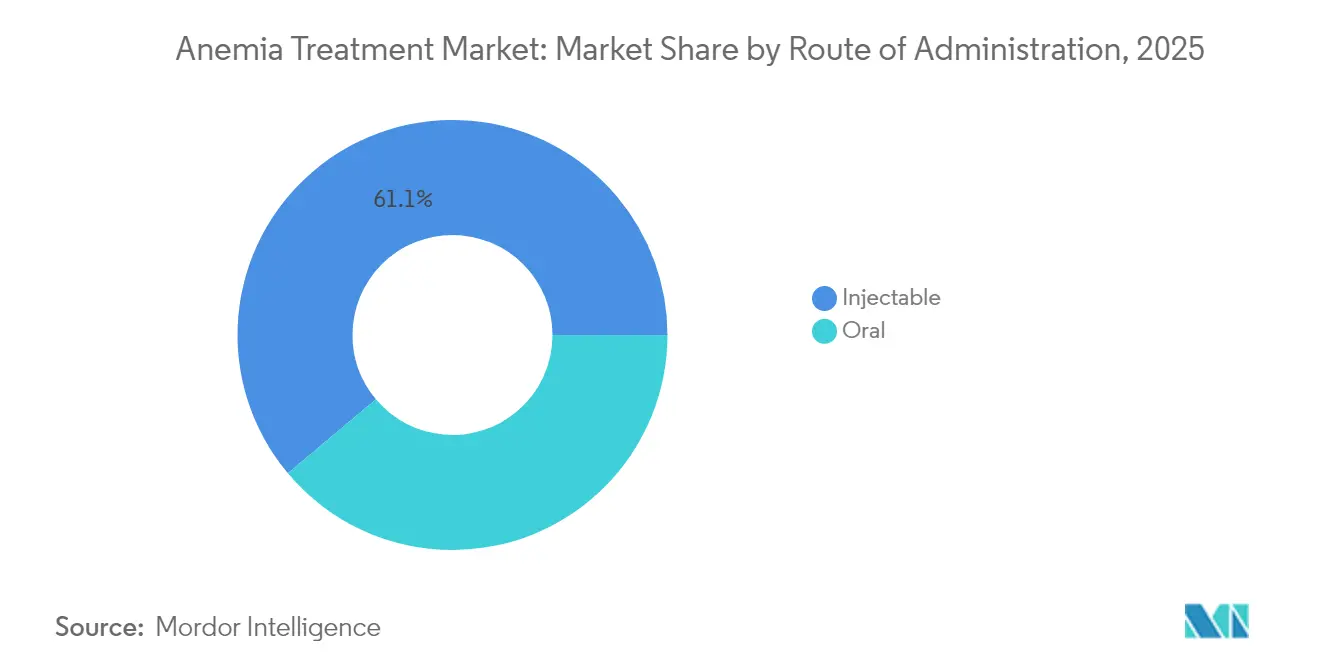
- By route of administration, injectable represented 61.12% of sales in 2025; oral formulations are expanding at a 7.35% CAGR.
- By geography, North America led with 37.05% revenue share in 2025, yet Asia Pacific is on track to increase at an 8.02% CAGR.
Note: Market size and forecast figures in this report are generated using Mordor Intelligence’s proprietary estimation framework, updated with the latest available data and insights as of 2026.
Global Anemia Treatment Market Trends and Insights
Drivers Impact Analysis*
| Driver | (~) % Impact on CAGR Forecast | Geographic Relevance | Impact Timeline |
|---|---|---|---|
| Escalating worldwide incidence and earlier diagnosis of anemia | +1.2% | Global, with highest impact in APAC and Africa | Medium term (2-4 years) |
| Growing prevalence of comorbid chronic diseases | +0.9% | North America & EU, expanding to APAC | Long term (≥ 4 years) |
| Regulatory approvals and pipeline progress for novel therapeutic classes | +1.5% | Global, led by North America and EU | Short term (≤ 2 years) |
| Government nutrition programs for women of reproductive age | +0.8% | APAC core, spill-over to MEA and South America | Medium term (2-4 years) |
| AI-enabled PoC hematology devices expanding diagnosis reach | +0.7% | Global, accelerated adoption in LMICs | Medium term (2-4 years) |
| Precision-medicine advances in hematology | +0.6% | North America & EU, gradual APAC adoption | Long term (≥ 4 years) |
| Source: Mordor Intelligence | |||
Escalating Worldwide Incidence and Earlier Diagnosis of Anemia
The combined effects of demographic change, improved screening, and AI-supported imaging uncover previously hidden cases across populations. . The World Health Organization reports that 29.9% of women aged 15-49 and 39.8% of children aged 6-59 months suffered from anemia globally, with the African region showing the highest prevalence at 60.2% among children under five.[1]Source: World Health Organization, “Global Health Observatory – Anaemia in Women and Children,” who.int Smartphone-based tests that deliver hemoglobin values in under one minute widen access and help providers intervene sooner, increasing patient volumes in the anemia treatment market.
Growing Prevalence of Comorbid Chronic Diseases
Chronic kidney disease, cancer, and inflammatory disorders each elevate anemia risk and require more complex interventions than iron replacement alone. The 2025 KDIGO guideline recognizes the need to combine ESAs and emerging HIF-PH inhibitors to manage renal anemia safely. As oncology treatment volumes rise, supportive anemia care preserves quality of life for up to 70% of patients receiving chemotherapy, supporting steady demand in the anemia treatment market.
Regulatory Approvals and Pipeline Progress for Novel Therapeutic Classes
Gene editing and oral HIF-PH inhibitors signal a structural shift in treatment standards. FDA clearance of CASGEVY, the first CRISPR-based therapy for sickle cell disease, sets a precedent for curative approaches despite a per-patient cost above USD 3 million. Daprodustat and vadadustat confirmations validate oral modulation of hypoxia-inducible pathways, challenging ESA dominance while reinforcing innovation-led growth for the anemia treatment market.
Government Nutrition Programs for Women of Reproductive Age
Large-scale iron and folic acid supplementation under India’s Anemia Mukt Bharat reaches six priority groups and includes digital testing tools, locking in predictable procurement volumes.[2]Source: Ministry of Health and Family Welfare India, “Anemia Mukt Bharat,” nhm.gov.in Similar initiatives across Southeast Asia and parts of Africa underpin baseline demand for standard iron products, buffering market cycles tied to high-cost biologics.
Restraints Impact Analysis*
| Restraint | (~) % Impact on CAGR Forecast | Geographic Relevance | Impact Timeline |
|---|---|---|---|
| ESA & gene-therapy cost‐containment pressures | -0.8% | Global, most acute in North America and EU | Short term (≤ 2 years) |
| Safety concerns (thrombo-embolism, iron overload) curb use | -0.6% | Global, with regulatory focus in developed markets | Medium term (2-4 years) |
| Cold-chain biologic supply bottlenecks in LMICs | -0.4% | APAC, MEA, and South America | Medium term (2-4 years) |
| Low therapy adherence due to GI side-effects of orals | -0.5% | Global, particularly acute in elderly populations | Long term (≥ 4 years) |
| Source: Mordor Intelligence | |||
ESA & Gene-Therapy Cost-Containment Pressures
Payers now require step-therapy, forcing oral iron trials ahead of intravenous options, while biosimilar ESAs chip away at branded pricing. Curative gene therapies face reimbursement hurdles given their high upfront cost, limiting access even where clinical value is clear. Payer policies increasingly emphasize step therapy requirements, mandating oral iron trials before approving expensive intravenous formulations, thereby delaying optimal treatment initiation. The emergence of biosimilar ESAs further pressures originator pricing while HIF-PH inhibitors face uncertainty regarding long-term cardiovascular safety profiles.
Safety Concerns (Thrombo-embolism, Iron Overload) Curb Use
Higher hemoglobin targets with ESAs raise stroke risk and trigger tighter dosing rules. Chronic transfusion accelerates iron overload, and chelation itself can cause liver injury, prompting clinicians to balance efficacy with organ protection. Patient adherence suffers as gastrointestinal side effects from oral iron formulations affect up to 45% of users, with severity correlating with age and BMI, necessitating personalized management strategies that increase healthcare resource utilization.[3]Source: Nutrients, “Impact of Side Effects on Anemia Therapy Compliance,” mdpi.com
*Our forecasts treat driver/restraint impacts as directional, not additive. The impact forecasts reflect baseline growth, mix effects, and variable interactions.
Segment Analysis
By Disease Type: Iron Deficiency Drives Volume While Sickle Cell Accelerates Innovation
Iron deficiency anemia accounted for 44.68% of the anemia treatment market size in 2025, underlining its status as the widest clinical segment. High prevalence among women of child-bearing age and children ensures large-scale demand for low-cost iron therapy and supports volume-driven growth across both developed and emerging economies. Government procurement under mass supplementation schemes keeps standard iron products in steady circulation, maintaining leadership despite lower per-unit pricing.
Sickle cell anemia is projected to advance at an 8.15% CAGR, outpacing every other disease subtype within the anemia treatment market. Breakthrough therapies such as CASGEVY and related gene-editing candidates create premium subsegments that attract specialized funding and center-of-excellence models. Growing newborn screening in the United States and selected African countries further enlarges the addressable patient pool and accelerates diagnosis, steering attention toward curative rather than palliative care. The anemia treatment industry therefore sees value migration from high-volume, low-margin iron deficiency products to low-volume, high-margin gene therapies for hemoglobinopathies.


By Therapy Class: Intravenous Iron Leadership Challenged by HIF-PH Innovation
Intravenous iron captured 36.23% of revenue in 2025, supported by hospital protocols that favor rapid hemoglobin correction for severe cases. Products such as ferric carboxymaltose deliver single-dose convenience and reduce admission times, sustaining entrenched usage patterns among clinicians. This class continues to anchor the anemia treatment market, particularly in surgical and obstetric settings where immediate correction prevents transfusion.
HIF-PH inhibitors, forecast to grow at 7.90% through 2031, aim to close efficacy gaps in chronic kidney disease by stimulating endogenous erythropoietin under physiological limits. Oral delivery removes injection burdens, giving patients more autonomy and simplifying logistics in dialysis centers. Continued positive cardiovascular safety data could push these agents toward first-line status, gradually trimming dependence on ESAs. The anemia treatment industry thus balances a reliable intravenous iron base with an innovation pipeline that redefines long-term management.
By Route of Administration: Injectable Dominance Faces Oral Innovation Challenge
Injectables held 61.12% of 2025 revenue owing to entrenched use of ESAs, IV iron, and gene-based infusions. Hospital routines, cold-chain reliability in developed markets, and clinician familiarity secure ongoing preference for parenteral delivery. These factors safeguard current volume in the anemia treatment market even as payer pressure mounts.
Oral routes, advancing at 7.35% CAGR, receive momentum from tolerability-focused reformulations such as ACCRUFeR, which mitigates gastrointestinal distress for more than 50% of traditional ferrous-salt users. HIF-PH inhibitors exclusively rely on oral dosing, making convenience a key competitive lever. As consumer preference shifts toward home-based care, oral products are positioned to win incremental share, giving the anemia treatment market a dual-track structure of hospital-centric injectables and community-based oral regimens.
Geography Analysis
North America generated 37.05% of total sales in 2025, reflecting early adoption of premium therapies and insurance frameworks that reimburse high-cost gene editing, ESA biologics, and injectable irons. Comprehensive newborn screening and precision-medicine programs bolster uptake across rare anemia segments. Payer scrutiny, however, caps ESA growth and encourages biosimilar use, shaping a value-oriented procurement environment that still rewards innovation when strong clinical outcomes are demonstrated.
Europe presents steady but more price-sensitive expansion. Harmonized regulatory reviews permit rapid biosimilar penetration, spreading access to established biologics while containing costs. Countries such as Germany and the United Kingdom have adopted pathway funding for CRISPR therapies, yet negotiate outcomes-based contracts to align high upfront payments with long-term clinical benefit. Iron chelation combinations receive acceptance after favorable safety and efficacy evidence, reinforcing diversified therapy mixes across national health services.
Asia Pacific is the fastest-growing region at 8.02% CAGR through 2031, driven by widening insurance coverage, rising chronic disease loads, and government-led nutrition drives. China’s regulatory reforms speed approval of HIF-PH inhibitors, while domestic manufacturers scale generic IV iron, lowering average selling prices and boosting penetration. Smartphone-enabled diagnostics further lift test volumes, feeding prescription demand throughout the anemia treatment market.

Competitive Landscape
The anemia treatment market hosts a blend of diversified pharma leaders and niche biotechs, producing moderate concentration. GSK, Pfizer, Novartis, Takeda, and Amgen defend legacy franchises in ESAs and iron solutions by leveraging distribution reach and post-marketing safety data. Vertex Pharmaceuticals and CRISPR Therapeutics elevate competitive stakes with the first curative gene-editing therapy, forcing incumbents to reassess R&D strategies.
Strategic partnering accelerates pipeline depth: Takeda’s USD 1.3 billion licensing deal for rusfertide underscores appetite for mechanisms that address iron regulation disorders. Sanofi’s USD 9.5 billion acquisition of a blood-disorder specialist signals scale-up intent among big pharma to command high-value rare-disease niches. AI-driven discovery firms collaborate with established manufacturers to identify novel PHD inhibitors, cutting development time and differentiating future offerings.
Digital health integration becomes a competitive necessity. Drug makers increasingly provide connected devices that monitor hemoglobin or dosing adherence, building service ecosystems around products. Companies exploring combination therapies—for example, pairing oral iron with absorption enhancers—aim to simplify regimens and improve outcomes. Overall, competitors that combine clinical innovation, digital enablement, and localized pricing strategies capture growing influence within the anemia treatment industry.
Anemia Treatment Industry Leaders
GSK plc
Pfizer (incl. GBT)
Takeda
Amgen
Novartis
- *Disclaimer: Major Players sorted in no particular order

Recent Industry Developments
- March 2025: Ono Pharmaceutical entered a license agreement with Ionis Pharmaceuticals for sapablursen, an RNA-targeted therapy for polycythemia vera.
- January 2025: Agios Pharmaceuticals received FDA acceptance of its supplemental New Drug Application for PYRUKYND in adult alpha- or beta-thalassemia.
- April 2024: Ironic Biotech secured USD 1 million in seed funding to pursue novel treatments targeting iron deficiency anemia.


Research Methodology Framework and Report Scope
Market Definitions and Key Coverage
Our study defines the anemia treatment market as the aggregate ex-manufacturer sales of prescription drugs, biologics, and approved gene or cell therapies that raise hemoglobin or red-blood-cell counts across iron-deficiency, chronic-kidney-disease, sickle-cell, thalassemic, aplastic, and other rare anemias. Value modeling spans 17 profiled countries and extends globally through calibrated trade and price-parity factors that our analysts apply.
Scope Exclusions: diagnostic instruments, point-of-care tests, fortified foods, transfusion services, and over-the-counter vitamins do not enter the revenue pool.
Segmentation Overview
- By Disease Type
- Iron Deficiency Anemia
- CKD Anemia
- Sickle Cell Anemia
- Aplastic Anemia
- Thalassemia
- Other Rare Anemias
- By Therapy Class
- Oral Iron Supplements
- Intravenous Iron
- ESAs
- Iron Chelators
- HIF-PH Inhibitors
- Others
- By Route of Administration
- Oral
- Injectable
- By Geography
- North America
- United States
- Canada
- Mexico
- Europe
- Germany
- United Kingdom
- France
- Italy
- Spain
- Rest of Europe
- Asia Pacific
- China
- Japan
- India
- Australia
- South Korea
- Rest of Asia Pacific
- Middle East and Africa
- GCC
- South Africa
- Rest of Middle East and Africa
- South America
- Brazil
- Argentina
- Rest of South America
- North America
Detailed Research Methodology and Data Validation
Primary Research
To test desk-based assumptions, Mordor analysts spoke with hematologists, nephrologists, hospital pharmacists, and payor advisers in North America, Europe, Asia-Pacific, and emerging African hubs. Interviews clarified real-world regimen splits, upcoming formulary changes, and discount ladders, which we then integrated into the model and re-circulated for respondent confirmation.
Desk Research
We began by compiling prevalence and incidence curves, treatment algorithms, and reimbursement caps from tier-1 public datasets such as WHO Nutrition and Anemia dashboards, Global Burden of Disease, CDC NHANES, EMA and US FDA drug approval files, and clinical-practice guidelines issued by KDIGO and ASH. Company 10-Ks, investor decks, and quarterly drug-sales disclosures enriched historic revenue lines, while patent searches run through Questel mapped pipeline density and loss-of-exclusivity windows.
Further context came from peer-reviewed journals, UNICEF nutrition reports, customs shipment records accessed through Volza, and macro-economic health-spend tables published by the World Bank. This list is illustrative only; many other authoritative sources supported fact-checking and variable cross-validation.
Market-Sizing & Forecasting
We applied a top-down epidemiology-to-treated-patient construct, multiplying subtype prevalence by diagnostic rates, treatment eligibility, and therapy-specific uptake. Select bottom-up spot checks, channel audits, and sampled average selling price times volume served as sanity gates before totals were locked. Key variables tracked include: 1) iron-deficiency prevalence in women of reproductive age, 2) CKD stage 3-5 population, 3) launch timelines for HIF-PH inhibitors and gene therapies, 4) weighted average treatment cost erosion post-LOE, 5) payer guideline shifts toward IV iron, and 6) macro health-expenditure growth. Multivariate regression, updated annually, projects these drivers to 2030 and feeds scenario analysis for optimistic and conservative uptake paths. Data gaps in bottom-up rolls were bridged with median regional ASPs and therapeutic-class share proxies drawn from hospital audits.
Data Validation & Update Cycle
Results are triangulated through variance checks against external series, with anomalies escalated to a senior reviewer. Reports refresh every twelve months; material regulatory or pricing events trigger interim revisions. Before release, an analyst performs a fresh sweep so clients receive the latest calibrated view.
Why Mordor's Anemia Treatment Baseline Earns Decision-Makers' Trust
Published figures often diverge because firms pick different therapy baskets, price levels, or inflation treatments, and they refresh models on uneven schedules.
Key gap drivers include whether gene and cell therapies are captured, how diagnostics are treated, the discount depth applied to generics, and if local currencies are rolled forward at spot or PPP rates. Mordor Intelligence sets a transparent scope, applies market-specific driver weights, and updates annually, which together anchor a balanced baseline that managers can trace and replicate.
Benchmark comparison
| Market Size | Anonymized source | Primary gap driver |
|---|---|---|
| USD 12.31 Bn (2025) | Mordor Intelligence | |
| USD 11.84 Bn (2024) | Global Consultancy A | Excludes gene therapies and prices at wholesale acquisition cost only |
| USD 13.04 Bn (2024) | Regional Consultancy B | Blends diagnostic device revenues with therapeutics |
| USD 15.70 Bn (2024) | Trade Journal C | Uses uniform 7% price inflation to harmonize regional data, inflating value |
Together, these comparisons show that Mordor's disciplined variable selection and refresh cadence deliver a dependable middle-ground estimate, giving stakeholders confidence to benchmark plans without over- or under-stating opportunity.


Key Questions Answered in the Report
Which treatment approach is gaining the most clinical momentum in anemia care?
Oral hypoxia-inducible factor prolyl hydroxylase (HIF-PH) inhibitors are receiving rapid clinical uptake because they offer convenient dosing and avoid many administration-related complications seen with injectables.
How are gene-editing therapies expected to reshape the competitive landscape?
The introduction of CRISPR-based interventions for hemoglobinopathies shifts competition toward curative solutions, prompting established pharmaceutical companies to pursue licensing deals and pipeline acquisitions to retain relevance.
What diagnostic innovation is broadening access in underserved regions?
Smartphone-enabled, AI-supported hemoglobin tests are lowering the barrier to routine screening, allowing clinicians in low-resource settings to detect and treat anemia earlier than traditional lab-based methods permit.
Why are payers scrutinizing erythropoiesis-stimulating agents (ESAs) more closely?
Safety alerts regarding thromboembolic risk and the emergence of lower-cost biosimilars have motivated insurers to enforce step-therapy rules that delay or limit ESA reimbursement.
Which patient population is driving demand for iron chelation combinations?
Transfusion-dependent individuals—including those with thalassemia and myelodysplastic syndromes—are increasingly prescribed combination chelators to better control iron overload and reduce organ-related complications.
How are national nutrition programs influencing product development strategies?
Mandatory fortification and large-scale iron–folic acid supplementation initiatives are standardizing formulation requirements, encouraging manufacturers to create stable, taste-neutral products that fit public-health distribution channels.
Page last updated on:


