Hemophilia Market Size and Share
Market Overview
| Study Period | 2020 - 2031 |
|---|---|
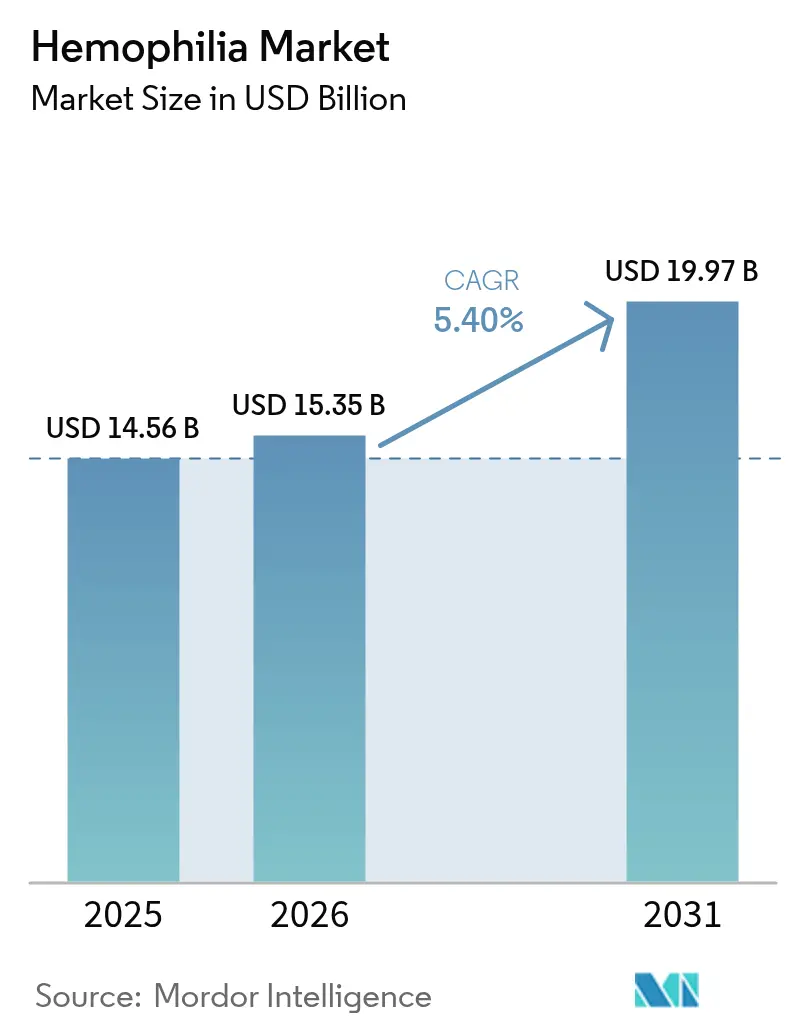
| Market Size (2026) | USD 15.35 Billion |
| Market Size (2031) | USD 19.97 Billion |
| Growth Rate (2026 - 2031) | 5.40% CAGR |
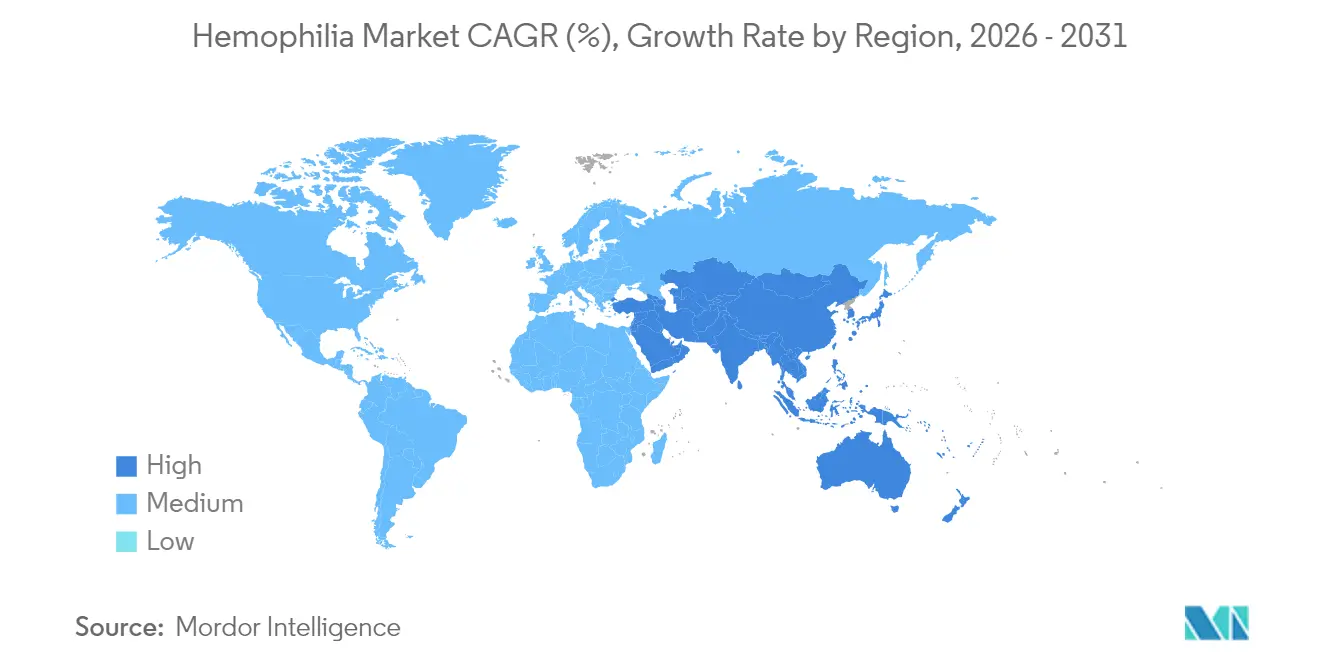
| Fastest Growing Market | Asia Pacific |
| Largest Market | North America |
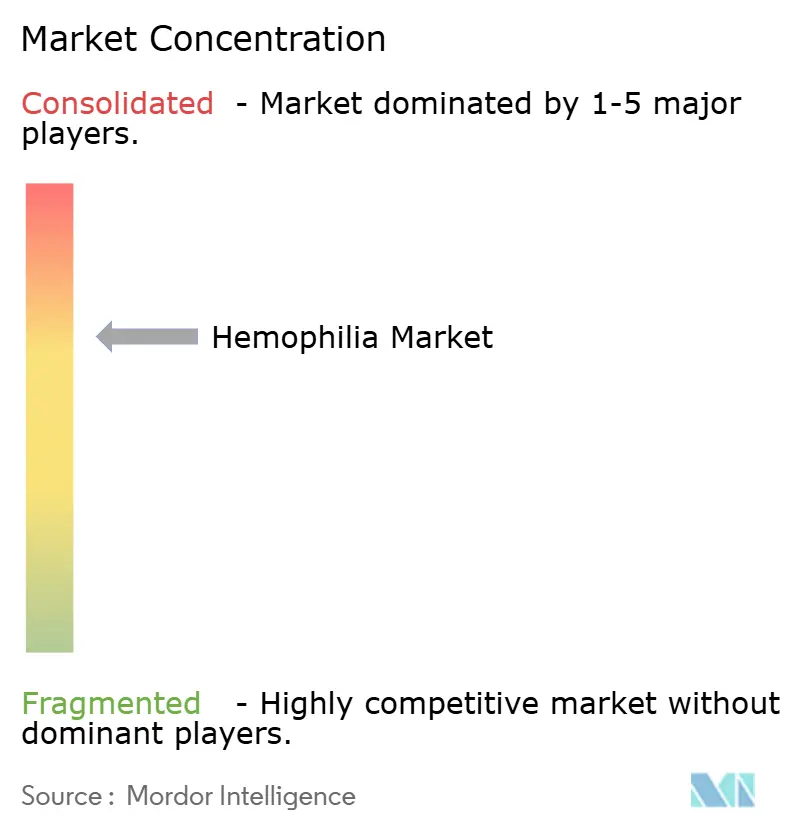
| Market Concentration | Medium |
Major Players *Disclaimer: Major Players sorted in no particular order Image © Mordor Intelligence. Reuse requires attribution under CC BY 4.0. | |
Hemophilia Market Analysis by Mordor Intelligence
Hemophilia market size in 2026 is estimated at USD 15.35 billion, growing from 2025 value of USD 14.56 billion with 2031 projections showing USD 19.97 billion, growing at 5.4% CAGR over 2026-2031. Expanding diagnosis, favorable reimbursement, and commercialization of transformative options such as extended half-life (EHL) recombinant factors and single-dose gene therapies are reshaping the hemophilia market landscape. Uptake of non-factor agents for inhibitor patients, intensifying competition among manufacturers, and broadening newborn-screening programs also contribute to sustainable demand. Headline risks stem from gene-therapy durability questions, persistent plasma-collection shortages, and payer budget constraints. Yet, overall momentum remains positive as payers increasingly recognize the long-run cost offsets offered by innovative prophylactic approaches.
Key Report Takeaways
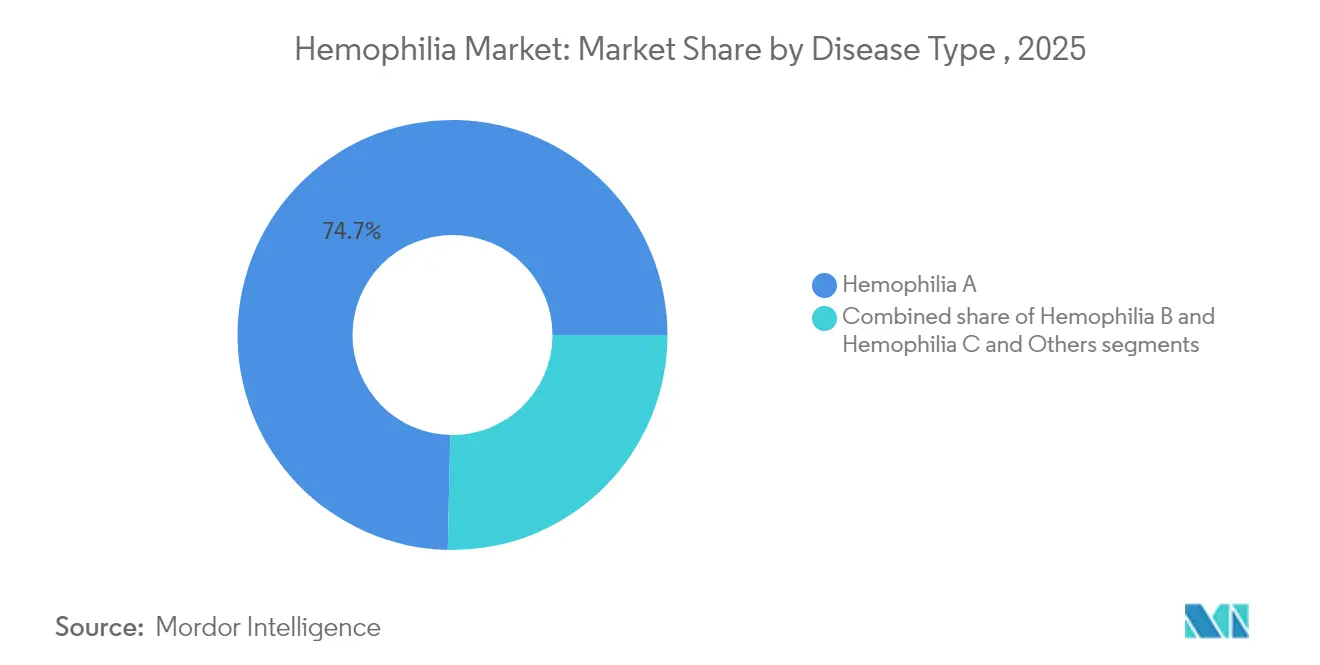
- By disease type, hemophilia A retained 74.65% of hemophilia market share in 2025, while hemophilia B is projected to post a 6.05% CAGR on the back of gene-therapy approvals.
- By therapy, replacement therapy led with 63.02% of the hemophilia market size in 2025; gene therapy registers the 6.67% forecast CAGR through 2031.
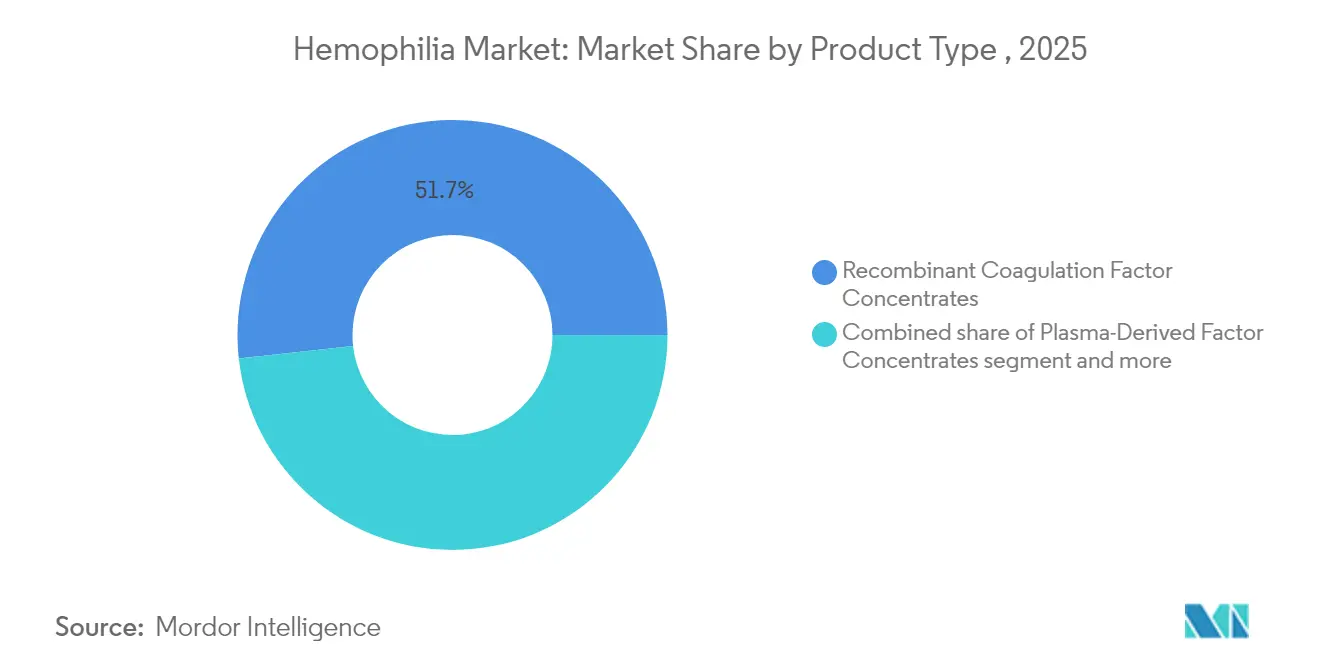
- By product type, recombinant factors captured 51.74% of the hemophilia market share in 2025 and continue to grow fastest through 2031.
- By treatment setting, on-demand led with 55.98% of the hemophilia market size in 2025; prophylaxis registers the 5.72% forecast CAGR through 2031
- By geography, North America commanded 47.12% revenue share in 2025; Asia-Pacific is expected to expand at a 6.55% CAGR between 2026-2031.
Note: Market size and forecast figures in this report are generated using Mordor Intelligence’s proprietary estimation framework, updated with the latest available data and insights as of 2026.
Global Hemophilia Market Trends and Insights
Drivers Impact Analysis*
| Driver | (~) % Impact on CAGR Forecast | Geographic Relevance | Impact Timeline |
|---|---|---|---|
| Rising diagnosed prevalence & life-expectancy improvements | +1.2% | Global, with strongest impact in APAC and MEA | Medium term (2-4 years) |
| Launch of extended half-life (EHL) recombinant factors | +1.0% | Global, led by developed markets | Short term (≤ 2 years) |
| Commercial availability of one-time gene therapies | +0.9% | North America & EU primarily | Medium term (2-4 years) |
| Favorable reimbursement & national hemophilia programs | +0.8% | North America & EU, expanding to APAC | Short term (≤ 2 years) |
| Expansion of non-factor therapies for inhibitor patients | +0.7% | Global, with emphasis on developed markets | Short term (≤ 2 years) |
| Real-world registries enabling precision dosing analytics | +0.4% | Global, concentrated in HTC networks | Long term (≥ 4 years) |
| Source: Mordor Intelligence | |||
Rising Diagnosed Prevalence & Life-Expectancy Improvements
Identification of hemophilia cases has risen sharply, taking the global diagnosed population to roughly 1.1 million in 2025 after sustained expansion of testing capacity in emerging economies. China reduced its average diagnosis lag from 13.3 years to 0.4 years between 2008 and 2018, illustrating the pace of improvement. Higher life expectancy is tied to broader prophylaxis adoption; CDC surveillance shows mortality declines in patients managed through hemophilia treatment centers. Countries with structured care networks now deliver near-normal life expectancy, reinforcing steady demand for advanced therapies.
Launch of Extended Half-Life (EHL) Recombinant Factors
ALTUVIIIO enables once-weekly dosing, reducing infusion counts by half compared with standard factors. Clinical data show 65% of users experience zero bleeds during prophylaxis, and European approval with 10-year exclusivity adds regulatory confidence. EHL factors cut cold-chain burdens, improve joint outcomes and bolster adherence, while maintaining surgical safety comparable to legacy products.
Commercial Availability of One-Time Gene Therapies
HEMGENIX eliminated routine prophylaxis in 94% of treated patients four years post-infusion, maintaining mean FIX activity of 37% and cutting bleeding events by 90%. Nonetheless, Pfizer withdrew Beqvez following limited uptake, underscoring adoption hurdles. Warranty programs that refund a portion of costs if target factor levels are not sustained ease payer concerns.
Favorable Reimbursement & National Hemophilia Programs
Medicare’s Hemophilia SNF Access Act permits separate Part B billing[1]NBDF Staff, “Medicare Federal Priorities for the Bleeding-Disorders Community,” National Bleeding Disorders Foundation, bleeding.org for clotting factors, extending coverage into skilled-nursing settings. NICE endorsed HEMGENIX for routine use, while France allows direct market entry[2]CSL Behring, “France Grants Direct Access for HEMGENIX Gene Therapy,” cslbehring.de without prior authorization. The US 340B program lets treatment centers dispense discounted drugs, supporting comprehensive care. Budget-impact studies indicate that although gene therapies cost about USD 3.5 million upfront, they can lower ten-year health-plan spending by USD 1.3 million through prophylaxis elimination.
Restraints Impact Analysis*
| Restraint | (~) % Impact on CAGR Forecast | Geographic Relevance | Impact Timeline |
|---|---|---|---|
| High treatment cost & payer budget pressure | -1.5% | Global, most acute in emerging markets | Short term (≤ 2 years) |
| Care‐access gaps in low-/middle-income countries | -0.8% | APAC, MEA, Latin America | Long term (≥ 4 years) |
| Durability-uncertainty of single-dose gene therapies | -0.6% | North America & EU primarily | Medium term (2-4 years) |
| Plasma-collection shortages disrupting PD product supply | -0.4% | Europe, Australia, with spillover to global markets | Short term (≤ 2 years) |
| Source: Mordor Intelligence | |||
High Treatment Cost & Payer Budget Pressure
Annual US costs range from USD 213,874 to USD 869,940 per patient, straining budgets. Gene therapies intensify scrutiny with list prices near USD 3.5 million. Plasma-supply shortages add further inflationary pressure in Europe, while Chinese urban patients bear out-of-pocket costs topping 30% of disposable income, limiting prophylaxis uptake. Brazil’s annual spend averages USD 450,831 per patient, totaling USD 5.19 billion nationally in 2025.
Care-Access Gaps in Low-/Middle-Income Countries
Only 8% of African hemophilia cases are diagnosed, reflecting profound infrastructure shortfalls. Asia-Pacific surveys reveal shortages of specialized staff, blocking wider prophylaxis adoption. Factor-consumption data confirm many countries use far below 1 IU of factor VIII per capita annually—well under effective treatment thresholds.
*Our forecasts treat driver/restraint impacts as directional, not additive. The impact forecasts reflect baseline growth, mix effects, and variable interactions.
Segment Analysis
By Disease Type: Hemophilia A Maintains Dominance Despite B’s Innovation Edge
Hemophilia A contributed 74.65% of hemophilia market share in 2025 due to its higher prevalence of roughly 1 in 5,000 male births. Hemophilia B is growing faster because factor IX’s longer half-life supports durable gene-therapy efficacy; HEMGENIX enabled 94% of patients to stop prophylaxis over four years. The hemophilia industry sees complementary progress in non-factor agents that address unmet needs across both subtypes.
Momentum in hemophilia A derives from EHL factors such as ALTUVIIIO and non-factor molecules like emicizumab, which together improve adherence and bleed control. Parallel breakthroughs in hemophilia B create a balanced pipeline where gene-therapy success stories stimulate investment while established factor concentrates preserve treatment flexibility. Hemophilia C and other rare factor deficiencies represent a smaller but clinically significant segment, with factor VII deficiency studies in Japan demonstrating effective management with recombinant activated factor VII, achieving 45.7% excellent and 33.6% effective hemostatic responses. Overall, the convergence of traditional and advanced modalities maintains dynamic competition within the broader hemophilia market.


By Therapy: Replacement Therapy Leadership Faces Gene-Therapy Disruption
Replacement therapy retained 63.02% of the hemophilia market size in 2025, valued at USD 9.18 billion, reflecting its entrenched role in daily care. Yet gene therapy posts the highest CAGR to 2031, propelled by single-infusion curative potential that appeals to younger cohorts. Non-factor prophylactics expand quickly as physicians shift inhibitor patients from bypassing agents to convenient subcutaneous regimens.
Replacement therapy benefits from EHL innovations that lower infusion frequency, protecting share even as gene therapy scales. Conversely, payers weigh lifetime cost offsets—gene therapy could negate annual prophylaxis bills that surpass USD 600,000, creating strong incentives for adoption once durability comfort solidifies. Non-factor molecules further diversify choices, reinforcing a multitrack approach where each modality meets distinct clinical needs
By Product Type: Recombinant Factors Consolidate Market Position
Recombinant concentrates captured 51.74% of the hemophilia market share in 2025 and will widen their lead through 2031 thanks to scalable production and minimal pathogen risk self-sufficiency. Bypassing agents will become a niche as non-factor therapies erode demand.
Recombinant platforms underpin EHL advances and support precision dosing. Domestic Chinese product SCT800 proved inhibitor-free safety across a median 332-day follow-up, emphasizing the shift toward localized recombinant manufacturing. Plasma-derived options remain critical where von Willebrand co-administration is necessary, but capacity constraints and rising immunoglobulin demand cap growth prospects.
By Treatment Setting: Prophylaxis Gains Ground Against On-Demand Paradigm
On-demand care still generated 55.98% of revenue in 2025, reflecting historic practice and cost barriers in emerging economies. Yet prophylaxis posts the fastest CAGR to 2031 as evidence accumulates; China’s pediatric data show that full-dose prophylaxis cuts bleeding significantly and elevates quality-of-life indices. PK-guided dosing protocols achieved 69% zero-bleed rates, reaffirming efficacy gains over episodic treatment.
Extended half-life and non-factor prophylactics ease adherence by trimming infusion frequency, while gene therapy targets definitive bleed protection through endogenous factor expression. Economic modeling reveals that prophylaxis avoids hospitalizations and joint damage, offsetting higher drug spend over time. Consequently, the hemophilia market is migrating steadily toward preventive care standards in both developed and select emerging regions.
Geography Analysis
North America accounted for 47.12% of global revenue in 2025, anchored by 146 federally funded hemophilia treatment centers that collectively manage more than 52,000 patients. Robust reimbursement frameworks include Medicare coverage for gene therapies and the 340B program that subsidizes drug acquisition. Data from the CDC’s Community Counts registry informs best-practice guidelines across 134,000 individuals, accelerating evidence-based adoption of novel agents. Despite available funding, CSL Behring notes slower than anticipated uptake of HEMGENIX, illustrating the nuanced decision pathways that accompany high-cost curative therapies.
Asia-Pacific is the fastest-expanding region, projected at 6.55% CAGR from 2026-2031. China cut diagnosis delays to 0.4 years and increased annual factor consumption as reimbursement broadened. Japan’s HIKOBOSHI study shows monthly factor VIII dosing climbed fivefold between 2005 and 2019, reflecting proactive prophylaxis trends. Nonetheless, only 3.2% of Chinese hemophilia A patients access prophylaxis, underscoring financial gaps. Regional working groups push for national registries and coordinated-care programs to harmonize treatment standards.
Europe enjoys mature infrastructure and progressive reimbursement but encounters plasma shortages; the bloc imports around 40% of plasma from the United States and seeks 2 million new donors to stabilize supply. Middle East & Africa and South America face pronounced access deficits; only 8% of African cases are diagnosed, and specialized staff shortages persist. Factor consumption remains well below therapeutic thresholds, sustaining unmet need and positioning these regions as future growth opportunities once infrastructure and reimbursement improve.

Competitive Landscape
Moderate consolidation characterizes the hemophilia market. Roche leads with Hemlibra, which delivered USD 2.8 billion in 2023, up 15% on the strength of non-inhibitor demand. Novo Nordisk’s Mim8 posted phase 3 data showing 86% zero-bleeds on weekly dosing, threatening Hemlibra’s share upon launch. CSL Behring dominates gene therapy with HEMGENIX, while Pfizer’s Beqvez exit illustrates commercialization risks in a high-cost, single-dose paradigm.
Strategic moves include outcome-based contracts: HEMGENIX offers durability warranties that refund part of the cost if factor levels drop below agreed thresholds. Sanofi differentiated Qfitlia with only six annual injections, targeting adherence gains. Partnerships broaden pipelines; bluebird bio aligned with Novo Nordisk on in-vivo genome-editing candidates, aiming for next-generation cures beyond AAV vectors.
Emerging entrants like Expression Therapeutics pursue bioengineered factor VIII designs that promise lower-cost manufacturing, potentially catalyzing hemophilia market expansion in price-sensitive geographies. Vertical integration strategies that encompass plasma collection, recombinant production and data analytics give established firms scale advantages, yet nimble innovators targeting specific pathway inhibitors or delivery platforms continue to fragment the field.
Hemophilia Industry Leaders
BioMarin Pharmaceutical Inc.
CSL Ltd.
F. Hoffmann-La Roche AG
Novo Nordisk A/S
Pfizer Inc.
- *Disclaimer: Major Players sorted in no particular order

Recent Industry Developments
- March 2025: Sanofi won FDA approval for Qfitlia (fitusiran), the first antithrombin-lowering prophylactic, achieving 71-73% bleed reductions with only six injections per year.
- February 2025: CSL Behring presented four-year HEMGENIX durability data; 94% of patients remained off prophylaxis and maintained 37% mean FIX activity.
- December 2024: FDA cleared Alhemo (concizumab-mtci) for inhibitor patients, granting a therapy that cut bleeds by 86%.
- November 2024: EMA approved Hympavzi (marstacimab) as the first weekly TFPI-targeting treatment for non-inhibitor hemophilia A and B.


Research Methodology Framework and Report Scope
Market Definitions and Key Coverage
Our study defines the hemophilia market as the global spending on medicinal products that restore or mimic the activity of deficient clotting factors VIII or IX, as well as next-generation non-factor and gene therapies that deliver durable hemostasis for people living with hemophilia A or B. According to Mordor Intelligence, this accounted for USD 14.56 billion in 2025.
We expressly exclude supportive wound-care dressings, over-the-counter hemostatic topicals, and acquired hemophilia treatments from the modeled value.
Segmentation Overview
- By Disease Type
- Hemophilia A
- Hemophilia B
- Hemophilia C & Others
- By Therapy
- Replacement Therapy
- Gene Therapy
- Non-Factor Therapy
- By Product Type
- Recombinant Coagulation Factor Concentrates
- Plasma-Derived Factor Concentrates
- Bypassing & Ancillary Agents
- By Treatment Setting
- Prophylaxis
- On-Demand
- By Geography
- North America
- United States
- Canada
- Mexico
- Europe
- Germany
- United Kingdom
- France
- Italy
- Spain
- Rest of Europe
- Asia-Pacific
- China
- India
- Japan
- Australia
- South Korea
- Rest of Asia-Pacific
- Middle East and Africa
- GCC
- South Africa
- Rest of Middle East and Africa
- South America
- Brazil
- Argentina
- Rest of South America
- North America
Detailed Research Methodology and Data Validation
Primary Research
We conducted structured interviews with hematologists, payers, specialty pharmacists, and patient-group advocates across North America, Europe, and key emerging Asian markets. These discussions helped us validate dosing intensity shifts, real-world prophylaxis uptake, and early gene-therapy contracting terms, filling gaps that public data left open.
Desk Research
Our analysts screened open datasets from the World Federation of Hemophilia, the US CDC, EuroBloodNet registers, and national HTA submissions to map diagnosed prevalence, inhibitor incidence, and treated patient pools. Supplemental insights were drawn from regulatory announcements at the FDA and EMA, UN Comtrade export tallies for factor concentrates, and pricing disclosures within SEC 10-K filings. We also leverage paid resources such as D&B Hoovers for manufacturer revenue splits, Dow Jones Factiva for launch timelines, and Questel patent analytics to time technology diffusion. The sources listed illustrate the breadth we cover and are not exhaustive.
Market-Sizing & Forecasting
We apply a top-down prevalence-to-treated-cohort build, starting with country-level patient counts that are then adjusted for diagnosis rates, inhibitor status, and prophylaxis penetration. Results are cross-checked through selective bottom-up roll-ups of supplier revenues and sampled average selling prices to fine-tune totals. Key variables feeding the model include median annual international units per patient, inhibitor frequency, ASP deflation or inflation by therapy class, first-year gene-therapy adoption curves, and currency movements. Multivariate regression, guided by expert consensus, projects these drivers to 2030 while scenario analysis stress-tests price and uptake swings. Data voids in smaller countries are bridged by regional analogs and physician panel feedback before finalizing numbers.
Data Validation & Update Cycle
We run multi-step variance checks that compare model outputs with shipment trends, reimbursement claims, and quarterly filings. An independent senior analyst reviews anomalies before sign-off. Reports refresh each year, and we issue interim updates whenever material events, such as major label expansions or reimbursement shifts, occur. A last-minute validation pass is completed just before client delivery to ensure currency.
Why Mordor's Hemophilia Baseline Commands Reliability
Published estimates often diverge because each publisher chooses a different therapy basket, patient capture rate, and refresh cadence.
Key gap drivers include whether emerging one-time gene therapies are counted on an accrual or cash basis, how mild cases that remain undiagnosed are handled, and the currency as well as inflation assumptions layered onto long-term price curves.
Benchmark comparison
| Market Size | Anonymized source | Primary gap driver |
|---|---|---|
| USD 14.56 bn (2025) | Mordor Intelligence | |
| USD 14.11 bn (2024) | Global Consultancy A | Broader basket adds desmopressin and adjunct bleed-care drugs, inflating base year yet omits future gene-therapy spend |
| USD 14.66 bn (2024) | Industry Journal B | Uses flat therapy prices and excludes inhibitor-management premiums, which understates medium-term growth |
The comparison shows that our disciplined scope alignment, variable selection, and annual refresh provide a balanced baseline that decision-makers can trace back to transparent patient and price drivers with confidence.


Key Questions Answered in the Report
What therapy modality is redefining prophylaxis for inhibitor patients?
Non-factor subcutaneous agents such as concizumab and fitusiran enable routine prophylaxis with only a handful of injections per year while cutting treated bleeds by more than 70%.
Why are extended half-life recombinant factors preferred over standard factors?
These molecules support once-weekly dosing, halve infusion frequency and deliver higher zero-bleed rates, which collectively improve joint outcomes and patient adherence.
How are payers coping with the high upfront cost of gene therapies?
Outcome-based contracts that include durability warranties let payers reclaim part of the price if post-infusion factor activity drops below agreed thresholds, aligning payments with realized benefit.
What supply constraint is influencing treatment choices in Europe?
Chronic plasma shortages, Europe needs about 2 million additional donors for self-sufficiency, are accelerating the shift toward recombinant concentrates that avoid dependence on donor plasma.
Which region is moving fastest from on-demand care to prophylaxis?
Asia-Pacific is making the quickest transition as wider diagnosis and expanding reimbursement encourage physicians to adopt preventive regimens despite lingering affordability gaps.
How are real-world registries improving hemophilia dosing strategies?
Programs like the CDC’s Community Counts compile pharmacokinetic data that power individualized dosing algorithms, raising bleed-free rates without increasing overall factor usage.
Page last updated on:


