Beverage Container Market Size and Share
Market Overview
| Study Period | 2020 - 2031 |
|---|---|
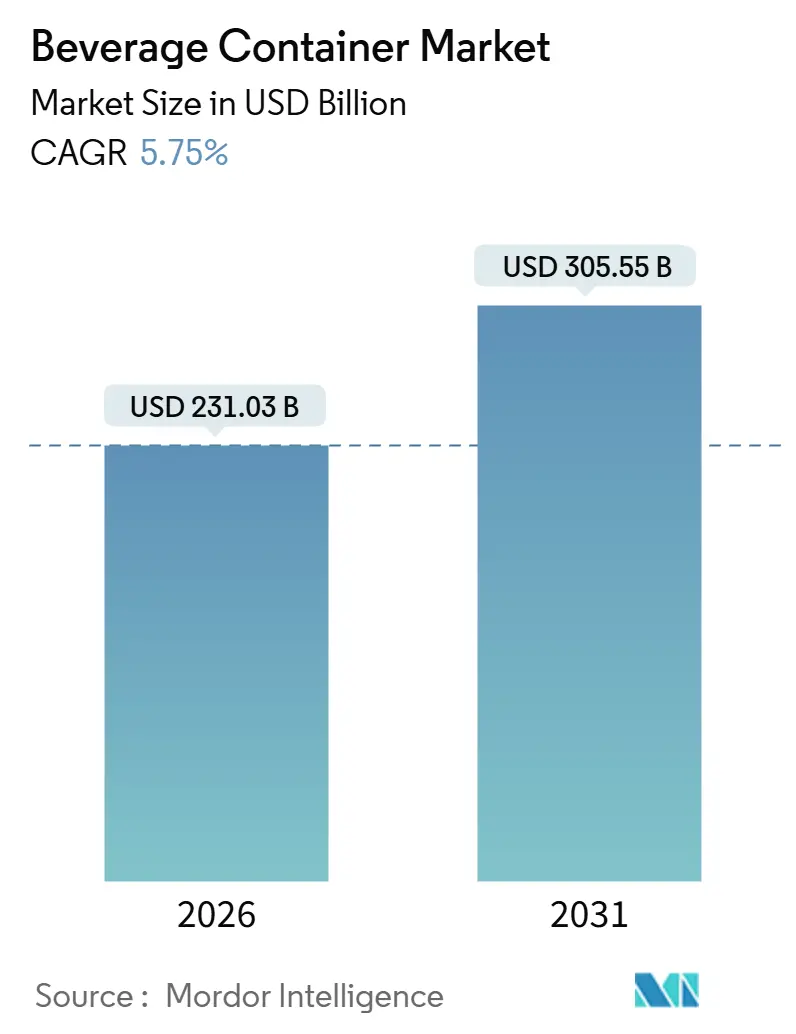
| Market Size (2026) | USD 231.03 Billion |
| Market Size (2031) | USD 305.55 Billion |
| Growth Rate (2026 - 2031) | 5.75% CAGR |
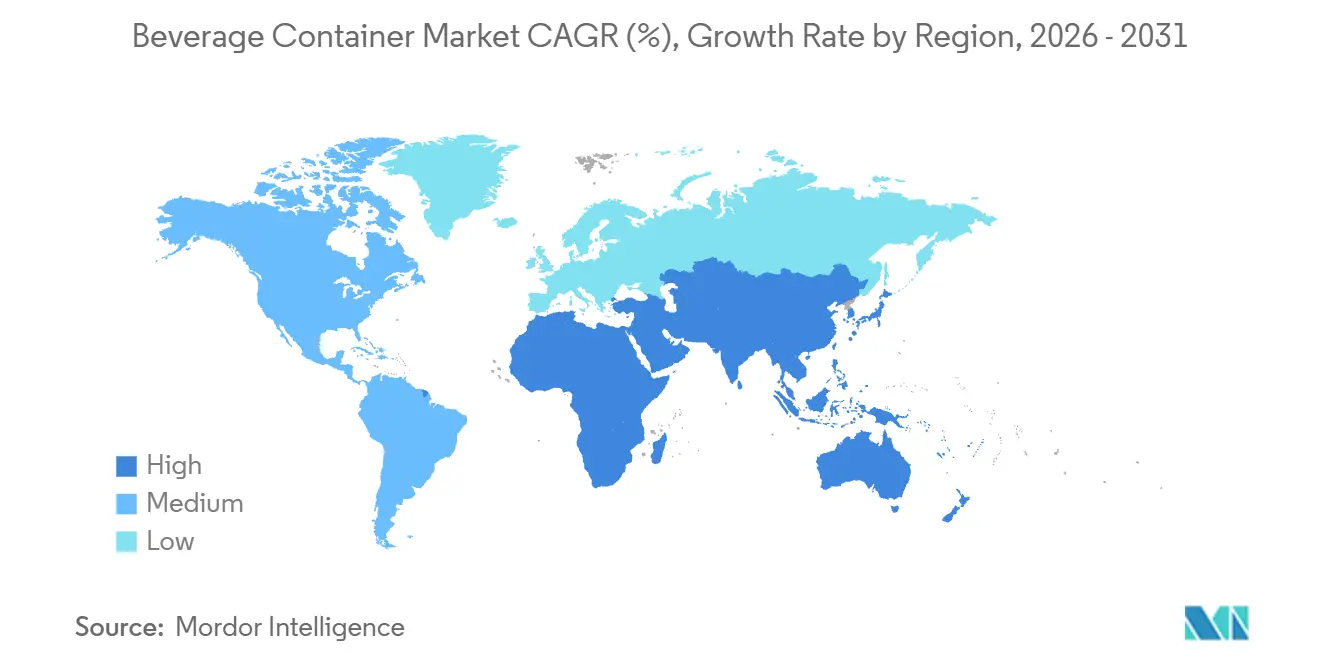
| Fastest Growing Market | Middle East and Africa |
| Largest Market | Asia Pacific |
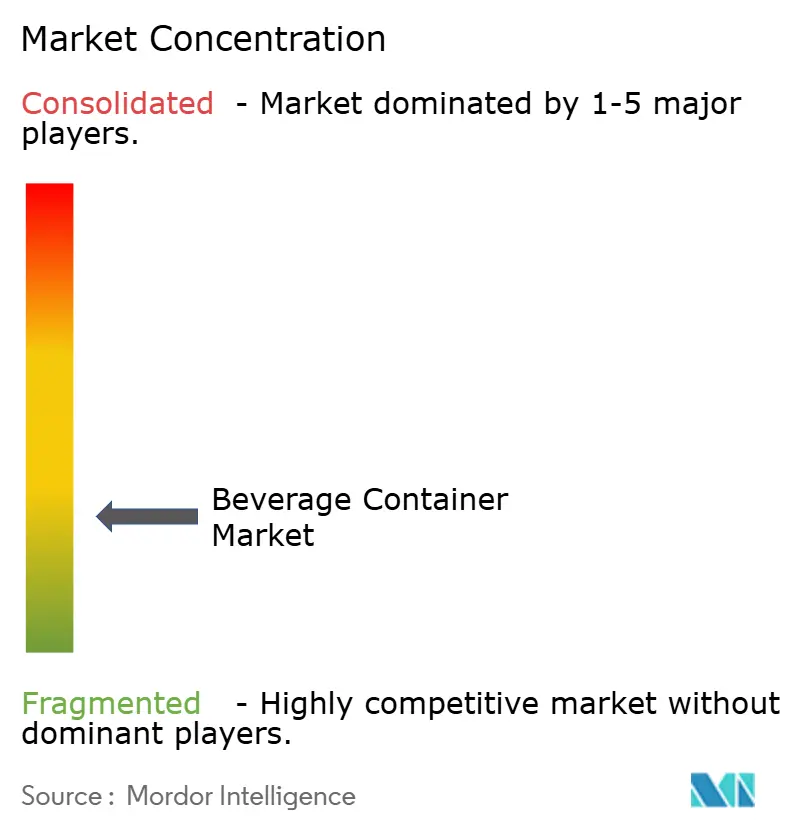
| Market Concentration | Low |
Major Players *Disclaimer: Major Players sorted in no particular order Image © Mordor Intelligence. Reuse requires attribution under CC BY 4.0. | |
Beverage Container Market Analysis by Mordor Intelligence
The beverage container market size is USD 231.03 billion in 2026 and is projected to reach USD 305.55 billion by 2031, registering a 5.75% CAGR over the period. Expanding ready-to-drink portfolios, escalating sustainability mandates, and rapid material innovation are reshaping the beverage container market. Direct-to-consumer distribution already captures more than half of global revenue as brand owners prioritize margin control and first-party data. Lightweight polyethylene terephthalate (PET) designs, closed-loop aluminum can capacity, and compostable polymers are emerging as central competitive themes. Meanwhile, supply-side cost volatility in virgin resin and primary aluminum feedstocks creates a bifurcated landscape in which scale leaders fund recycling infrastructure and niche entrants pursue biodegradable niches. Regional momentum is also shifting, with Asia-Pacific anchoring global revenue while the Middle East and Africa record the fastest growth through 2031.
Key Report Takeaways
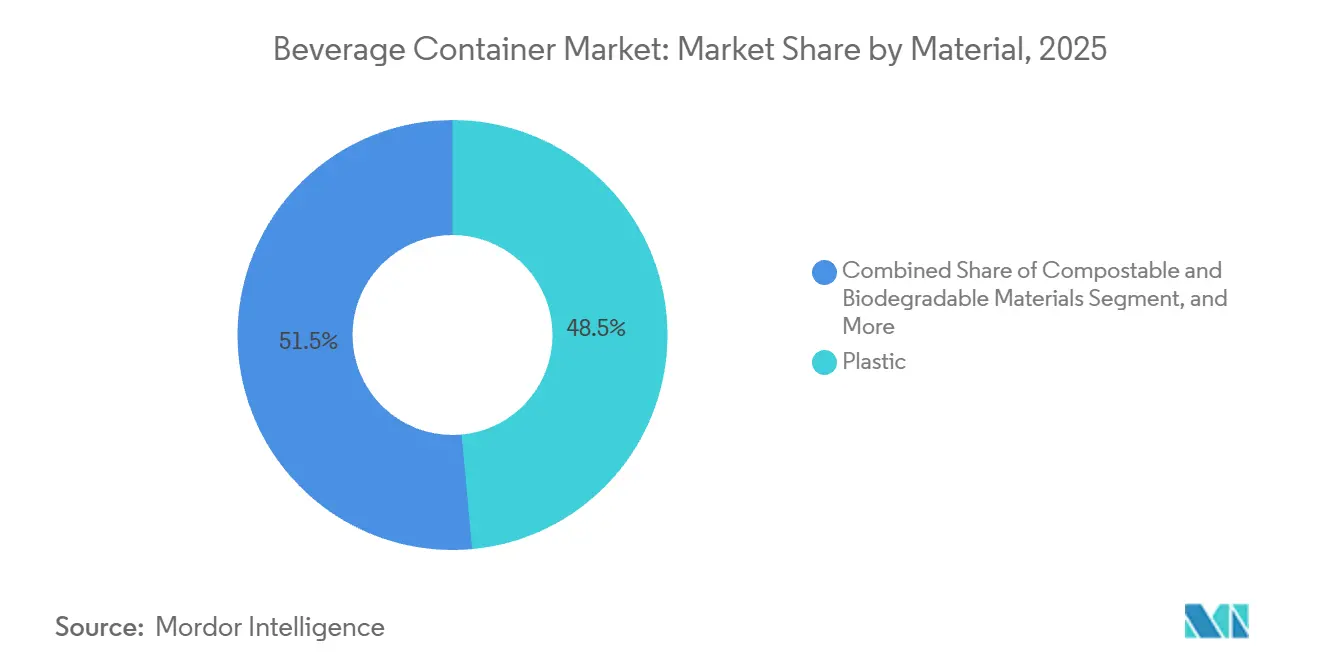
- By material, plastic led with 48.54% of the beverage container market share in 2025; compostable and biodegradable polymers are projected to expand at a 7.32% CAGR through 2031.
- By beverage type, non-alcoholic beverages accounted for 63.32% of the beverage container market share in 2025 and are advancing at a 6.64% CAGR through 2031.
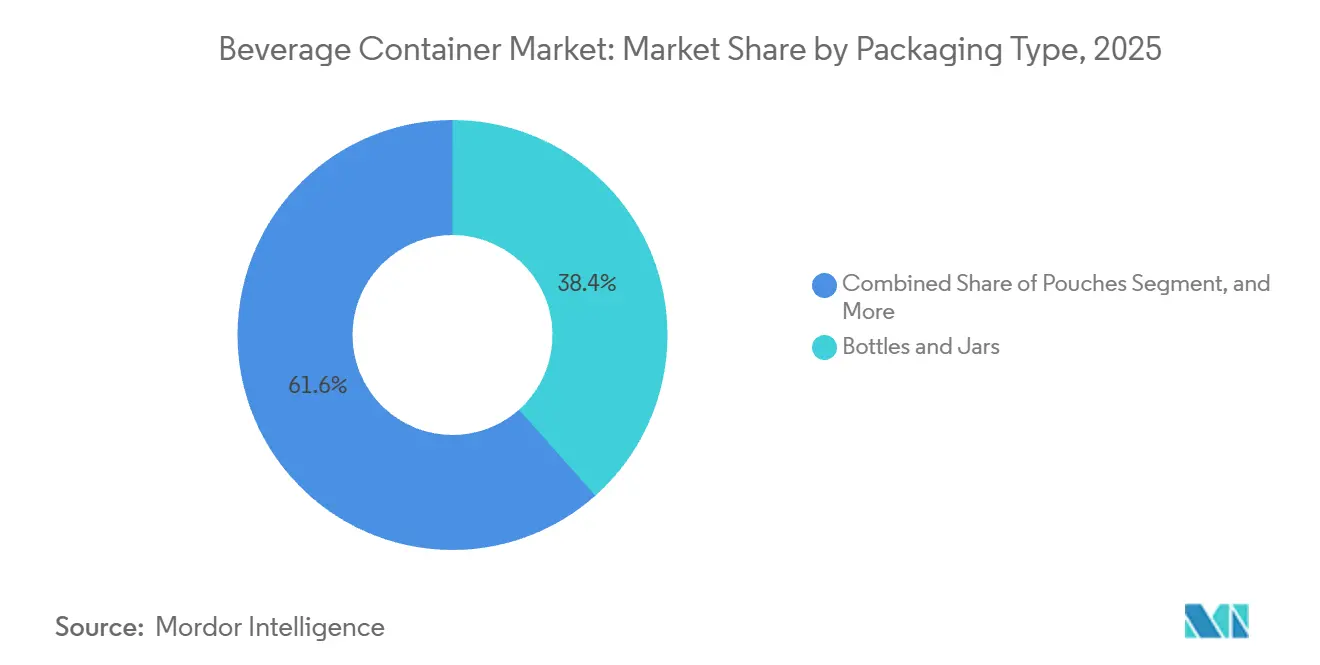
- By packaging type, bottles and jars held 38.43% share in 2025, while pouches are on track to grow at a 6.75% CAGR to 2031.
- By distribution channel, direct distribution captured 56.34% of the beverage container market share in 2025; indirect channels are forecast to post a 6.87% CAGR through 2031.
- By geography, Asia-Pacific commanded 40.23% share in 2025, yet the Middle East and Africa is set to expand at a 7.84% CAGR, outpacing all other regions.
Note: Market size and forecast figures in this report are generated using Mordor Intelligence’s proprietary estimation framework, updated with the latest available data and insights as of January 2026.
Global Beverage Container Market Trends and Insights
Drivers Impact Analysis*
| Driver | (~) % Impact on CAGR Forecast | Geographic Relevance | Impact Timeline |
|---|---|---|---|
| Surging Consumption of Ready-to-Drink Non-Alcoholic Beverages | +1.2% | Global, highest in Asia-Pacific and North America | Medium term (2-4 years) |
| Rising Demand for Convenient and Lightweight PET Bottles | +0.9% | Europe and North America | Short term (≤2 years) |
| Expansion of Middle-Class Disposable Income in Emerging Economies | +1.1% | Core Asia-Pacific, spill-over to Middle East and Africa | Long term (≥4 years) |
| Growth in Sustainable and Recyclable Packaging Mandates | +0.8% | Europe and North America, expanding to Asia-Pacific | Medium term (2-4 years) |
| Adoption of Digital Watermarking for Automated Sorting | +0.4% | Europe and North America | Long term (≥4 years) |
| Beverage Brands’ Shift Toward Direct-to-Consumer E-Commerce Formats | +0.6% | Global, led by North America and Europe | Short term (≤2 years) |
| Source: Mordor Intelligence | |||
Surging Consumption of Ready-to-Drink Non-Alcoholic Beverages
Health and convenience motives are steering consumers toward grab-and-go coffees, teas, and functional waters. Brand owners report double-digit volume gains in ready-to-drink lines, and launches featuring electrolytes or adaptogens now exceed one-fifth of all non-alcoholic introductions. This shift demands aseptic filling, advanced barrier coatings, and nitrogen-flush capabilities that safeguard nutrients without refrigeration. Thin-wall PET coupled with tamper-evident closures dominates new specifications. Converter investment is flowing into servo-driven blow-molding and inline vision systems that detect sub-50-micron wall variations, ensuring lightweight integrity at scale.
Rising Demand for Convenient and Lightweight PET Bottles
Lightweighting has moved from a cost tactic to a brand differentiator. Coca-Cola’s 13.2-gram contour bottle reduced virgin resin use by 8% while maintaining top-load performance, preventing 6,000 metric tons of material consumption annually.[1]The Coca-Cola Company, “13.2-Gram Contour Bottle Launch,” coca-colacompany.com Equipment vendors now offer stretch-blow platforms capable of 9-gram half-liter designs that withstand pallet loads exceeding 12 kilogram-force. Regulatory triggers accelerate the trend; the European Union mandates 25% recycled content in PET by 2025, amplifying the economic case for lighter walls that offset higher rPET costs. Life-cycle assessments confirm that shaving a single gram across a multi-billion-unit fleet trims thousands of metric tons of CO₂ equivalents, aligning with Science Based Targets initiative benchmarks.
Expansion of Middle-Class Disposable Income in Emerging Economies
Higher household earnings in India, Indonesia, and Saudi Arabia double beverage outlays once the USD 15-per-day threshold is crossed. Retail modernization and cold-chain investments lift accessibility for chilled juices, dairy drinks, and energy beverages. New PET lines running 72,000 to 150,000 bottles per hour are coming online in Nigeria and India to serve smaller 250-milliliter packs that suit budget-conscious but aspirational consumers. Glass and aluminum also find traction in premium tiers as shoppers equate heavier formats with quality, supporting margin accretion despite higher unit costs.
Growth in Sustainable and Recyclable Packaging Mandates
Extended producer responsibility schemes in Germany, California, and France compel brands to internalize end-of-life costs. Deposit-return systems already push plastic bottle collection above 90% in several European markets. Compliance drives investment in chemical recycling and digital watermarking that enhances sortation accuracy. Multinationals are also pivoting toward mono-material structures to meet ISO 14021 validation standards, cutting multilayer laminates that choke recycling streams.
Restraints Impact Analysis*
| Restraint | (~) % Impact on CAGR Forecast | Geographic Relevance | Impact Timeline |
|---|---|---|---|
| Stringent Global Regulations Against Single-Use Plastics | -0.7% | Europe, North America, Asia-Pacific coastal regions | Short term (≤2 years) |
| Volatility in Raw Material Prices for Aluminum and PET Resins | -0.6% | Global | Short term (≤2 years) |
| Limited Food-Grade rPET Feedstock Availability | -0.4% | Europe and North America | Medium term (2-4 years) |
| Emerging Refillable and Reuse Systems Cannibalizing Single-Use Volumes | -0.3% | Europe, pilots in North America and Asia-Pacific | Long term (≥4 years) |
| Source: Mordor Intelligence | |||
Stringent Global Regulations Against Single-Use Plastics
Policy divergence forces multinational portfolios to juggle tethered closures in Europe, refillables in British Columbia, and 30% rPET content in India.[2]Ministry of Environment, Forest and Climate Change (India), “Plastic Waste Management Amendment Rules 2024,” moef.gov.in Non-alignment inflates compliance overheads, accelerates format substitution toward aluminum and glass, and complicates global SKU harmonization. Value brands struggle most, since a 330-milliliter aluminum can can cost nearly double its PET counterpart in price-sensitive markets, limiting adoption despite better recyclability.
Volatility in Raw Material Prices for Aluminum and PET Resins
LME aluminum moved between USD 2,350 and USD 2,780 per metric ton during 2024.[3]London Metal Exchange, “Aluminum Futures Data 2024-2025,” lme.com Asian spot PET swung USD 200 per ton in the same window, compressing converter margins and sidelining long-term supply contracts. Pass-through clauses lag upturns by up to 90 days, straining working capital. The narrowing price spread between virgin and recycled PET also dulls the economic incentive to specify rPET, even as mandates rise.
*Our forecasts treat driver/restraint impacts as directional, not additive. The impact forecasts reflect baseline growth, mix effects, and variable interactions.
Segment Analysis
By Material: Compostable Polymers Challenge Plastic Dominance
Plastic retained 48.54% of the beverage container market share in 2025, powered mainly by PET’s clarity, barrier versatility, and global recycling infrastructure. The segment’s momentum, however, confronts stricter recycled-content rules that lift costs and shift innovation budgets toward weight reduction and chemical recycling. Metal holds roughly 28% share as aluminum cans gain favor in energy drinks and craft beer owing to infinite recyclability and premium shelf appeal. Glass sits near 16%, defending wine, spirits, and premium juice niches where inertness and transparency warrant higher logistics costs.
Compostable and biodegradable resins are moving from pilot scale to commercialization, expanding at a 7.32% CAGR to 2031. Seaweed-based capsules for sports drinks, FDA-approved polyhydroxyalkanoate bottles, and corn-starch films for ambient tea all speak to brands seeking end-of-life differentiation. Yet industrial composting gaps outside Western Europe and California temper broad uptake. Paper cartons and hybrid laminates round out the remainder, but face Extended Producer Responsibility penalties when multi-layer formats impede closed-loop recovery.


By Beverage Type: Non-Alcoholic Formats Drive Volume Growth
Non-alcoholic lines composed 63.32% of market share in 2025 and are on track for 6.64% CAGR through 2031, underpinning overall beverage container market growth. Carbonated soft drinks still lead units but now rely on aspartame-resistant PET to support diet variants that skirt new sugar taxes. Cold-pressed juices, plant-based milks, and protein shakes favor glass or opaque HDPE to signal freshness and nutritional integrity. Kombucha and functional waters, although smaller in absolute liters, post high-single-digit gains and typically choose amber glass or slim aluminum to shield probiotics from UV degradation.
Alcoholic beverages make up the balance with 36.68% share. Aluminum can adoption is rising in craft beer and ready-to-drink cocktails because cans chill faster, weigh less, and avoid event-venue glass bans. Bag-in-box wine now captures double-digit volume in Scandinavia and Australia by offering portion control and longer post-opening freshness. Spirits experiment with 200-milliliter aluminum bottles that suit festivals and e-commerce parcel shipping, though glass continues to dominate mainstream formats.
By Packaging Type: Pouches Gain Share Through E-Commerce Compatibility
Bottles and jars accounted for 38.43% of 2025 revenue, benefiting from established filling lines and consumer familiarity. Still, pouches are the fastest-growing, with a 6.75% CAGR, because they cut packaging weight by as much as 70% and qualify for online retailer incentives that reward damage-resistant, low-cube formats. Cans command roughly a 32% share, with aluminum outpacing steel as brands chase circularity targets.
Cartons hover near 18% of volume in shelf-stable dairy and juice. New launches featuring bio-based caps and sugarcane-derived barrier layers reduce cradle-to-gate emissions by one-third compared to petroleum equivalents. Bag-in-box systems serve fountain syrup and wine, and now pivot toward mono-material liners that sidestep recycling penalties. For carbonated drinks, reinforced pouches have emerged but remain regionally contained due to higher film costs and deposit-return exclusions.
By Distribution Channel: Indirect Channels Accelerate Under Modern Retail and E-Commerce
Direct distribution retained a 56.34% share in 2025, grounded in company-owned bottling and route-to-market networks that deliver merchandising precision plus granular sell-through data. Yet indirect channels will post the higher 6.87% CAGR, helped by the expansion of omnichannel grocery and rapid-delivery platforms. E-commerce now influences container engineering, prioritizing shatter resistance and compact multipacks. Amazon’s fulfillment fee discounts for certified frustration-free designs and Instacart’s same-day expectations have already nudged many emerging beverage brands to adopt aluminum or shatterproof PET over glass.
Traditional wholesalers remain crucial for penetrating independent trade in developing economies, where setting up direct fleets is capital-intensive. Modern retailers in Saudi Arabia and Indonesia are expanding chilled vaults, unlocking shelf space for functional drinks and premium waters that carry higher gross margins. On-demand services such as DoorDash are driving impulse beer and cider occasions previously monopolized by convenience stores, supporting further diversification in secondary packaging, such as insulated mailers and molded-pulp dividers.
Geography Analysis
Asia-Pacific generated 40.23% of market share in 2025, anchored by China’s ready-to-drink tea boom and India’s accelerating cold-chain build-out. Japanese can makers innovate with resealable tops and thermochromic inks, while Australia’s deposit-return scheme has pushed PET recovery above 85%. Local bottlers across Southeast Asia are installing high-speed lines for smaller pack sizes that mesh with rising urban commuter lifestyles.
The Middle East and Africa offer the fastest expansion path, with a 7.84% CAGR through 2031. Vision 2030 funding in Saudi Arabia underwrites beverage production hubs, and the United Arab Emirates’ premium water market is shifting from PET to lightweight glass. Egypt and Nigeria see dual drivers of population growth and import substitution, although infrastructure gaps outside tier-one cities temper immediate volume upside. Deposit-return pilots and sugar taxes are also nudging format innovation toward downsized PET and lightweight cans.
Europe holds about a 22% share, distinguished by stringent Extended Producer Responsibility fees and deposit-return mandates that drive closed-loop aluminum and high-rPET usage. Germany now recovers more than 9 out of 10 single-use plastic bottles, forming a critical feedstock pool for domestic recyclers. France and the United Kingdom impose escalating penalties for virgin plastics, catalyzing refills and mono-material pouches with certified recyclability. North America contributes close to 18% share, with California’s recycled-content law shaping nationwide sourcing strategies as producers aim for 65% recycled plastic by 2032. South America rounds out the global map, where high returnable glass penetration in Brazil keeps packaging costs low and lifts consumer loyalty to refill systems.

Regulatory Landscape
Regulation is tightening around recyclability, recycled content, and chemical safety, with Europe setting the most prescriptive framework for beverage packaging placed on the market. Regulation (EU) 2025/40 on packaging and packaging waste (PPWR) entered into force on 11 February 2025 and applies from 12 August 2026, driving beverage containers toward harmonized labeling, higher collection performance, and practical readiness for reuse and deposit-return models. Under PPWR, member states must ensure deposit-return systems for single-use plastic or metal beverage containers are established by 2029. The European Commission is also mandated to adopt implementing acts for harmonized labeling specifications by 12 August 2026, increasing the near-term compliance workload for brands, converters, and retailers operating pan-EU portfolios.
In the United States, food-contact compliance continues to influence material selection and additive packages used in cartons, bottles, cans, and closures. The US FDA determined that 35 food contact notifications related to PFAS in grease-proofing agents for paper and paperboard food packaging are no longer effective, with a compliance deadline of 30 June 2025 for existing stocks. This accelerates substitution in paper-based beverage packaging components and coatings where relevant. In parallel, the FDA continues to process Food Contact Notifications for resins, additives, and coatings used across packaging materials, reinforcing a pre-market clearance pathway that affects global suppliers serving US beverage filling lines.
Value Chain Analysis
The beverage container value chain starts with upstream feedstocks, including primary aluminum, recycled aluminum, PET and other polymers, glass batch materials, paperboard, and specialty additives or coatings. It then extends through container manufacturing, such as can sheet and end-making, blow molding and injection stretch-blow, glass forming, carton converting, and pouch film extrusion and lamination. Scale converters and integrated packaging groups such as Ball, Crown, Amcor, Tetra Pak, and SIG Group sit at the core, translating container specifications into requirements for downstream beverage producers and bottling partners, including large bottlers such as Coca-Cola Europacific Partners. These downstream customers prioritize line speed, lightweighting, shelf-life performance, and e-commerce durability.
Midstream dynamics are increasingly shaped by circularity and compliance infrastructure, with collection systems, sorting, and food-grade recycling capacity (notably rPET and recycled aluminum) acting as strategic inputs alongside virgin materials. Europe is a focal point for documentation and labeling readiness as PPWR applies from 12 August 2026; European Commission guidance and FAQs published in March 2026 and adopted in June 2026 formalized interpretations that affect declarations of conformity and technical documentation for packaging placed on the EU market. On the supply side, large manufacturers are localizing and expanding regional footprints through acquisitions and capacity clustering, illustrated by Ball Corporation acquiring an 80% stake in Benepack (January 2025) and acquiring an aluminum can facility in Winter Haven, Florida (2025). These actions help shorten lead times and reduce exposure to freight and raw-material volatility while supporting high-volume beverage customers.
Competitive Landscape
The industry structure is fragmented. Leaders pursue vertical integration to lock in recycled feedstock and hedge against Extended Producer Responsibility liabilities. Ball Corporation’s Serbian plant sources 80% of its electricity from renewable sources, demonstrating the pivot toward low-carbon operations. Amcor’s recycling investment in Germany targets food-grade high-density polyethylene, diversifying beyond PET.
Technology is a primary battlefield. Digital watermarking trials under the HolyGrail 2.0 consortium achieved 95% automated sort accuracy, a leap over legacy near-infrared systems and a potential license-to-operate factor as legislators tie fees to recyclability outcomes. Patent filings in 2024 and 2025 underscore emphasis on lightweight closures, barrier coatings, and direct-to-can digital printing that personalizes graphics without compromising line speed.
Challenger brands and specialized converters are exploiting premiumization and e-commerce. Liquid Death’s edgy canned water proposition translated into USD 263 million retail sales, proving that aluminum’s sustainability narrative resonates with Gen Z consumers and simultaneously commands double-digit price premiums. Smaller can makers like Can-Pack win speed-to-market victories with low minimum order quantities, taking share in niche formats such as 150-milliliter energy shots. Geographic expansion also intensifies competition: Crown Holdings acquired a majority stake in a Vietnamese can producer to capture Southeast Asia’s robust beverage CAGR, while Ardagh commissioned a billion-unit line in Brazil to defend share amid rising returnable glass adoption.
Beverage Container Industry Leaders
Tetra Pak International S.A.
Crown Holdings Incorporated
Amcor plc
Piramal Glass Private Limited
Mondi Group
- *Disclaimer: Major Players sorted in no particular order

Market Opportunities and Future Outlook
Regulatory-driven circularity and brand commitments are creating whitespace for high-recycled-content formats, verified feedstock sourcing, and packaging engineered for reuse and improved collection outcomes. A concrete example is Britvic Ireland (Ballygowan) completing a May 2026 trial of a circular bottle manufactured with 100% recycled PET sourced from Ireland's deposit return scheme. This shows how DRS-linked supply can support food-grade rPET claims and de-risk compliance in markets emphasizing collection and recycled content. In parallel, PPWR milestones, including the application from 12 August 2026 and the deposit-return requirements by 2029 in the EU, are lifting opportunities for packaging and technology providers that can deliver harmonized labeling execution, sortation-enabling features (including digital watermarking), and mono-material structures that help reduce EPR penalties tied to recyclability.
Capacity and material innovation investments also point to active opportunity areas across metals, glass, and bio-based polymers, particularly where beverage mix is shifting toward ready-to-drink and functional formats. Crown Holdings announced in April 2026 plans for a two-line beverage can manufacturing facility in Northern India with 2.2 billion cans annual capacity, aligning with demand growth in India and the shift toward infinitely recyclable aluminum cans across multiple beverage categories. On glass, Stoelzle Glass USA launched a USD 100 million transformation of its Monaca, Pennsylvania facility in May 2026, including a furnace rebuild to increase melting capacity to around 400 tons per day, supporting premium and specialty glass needs. In advanced materials, Avantium initiated a July 2026 collaboration with Gepack and Frubaça to pilot 100% bio-based PEF for small-format functional beverage shots, supporting barrier-oriented, bio-based containers where shelf-life and differentiation are priorities.
Recent Industry Developments
- July 2026: Avantium started a collaboration with Gepack and Frubaça to pilot 100% bio-based PEF in small-format functional beverage shot bottles. The pilot provides an alternative to conventional plastics where high barrier performance and bio-based content are being specified for premium, high-value portions, creating a new validation route for emerging polymer supply chains.
- April 2026: Crown Holdings announced plans to establish a two-line, state-of-the-art beverage can manufacturing facility in Northern India. The project expands local can supply in a high-growth market and supports beverage brands shifting volumes toward aluminum formats to align with recyclability and circularity targets.
- May 2025: Crown Holdings announced the addition of a third high-speed production line at its beverage can plant in Ponta Grossa, Brazil, with commercial production slated for the third quarter of 2026. The expansion increases regional output and helps brand owners secure supply continuity amid rising can demand and ongoing material cost volatility.


Research Methodology Framework and Report Scope
Market Definition and Coverage
This market covers the value of containers used to package beverages, measured across common formats and materials that reach end customers through direct and indirect channels, across major global regions.
Scope exclusions: We exclude secondary packaging and transport packaging, along with container-making machinery and equipment that are not sold as beverage containers.
Segmentation Overview
- By Material
- Plastic
- Metal
- Glass
- Paper
- Compostable and Biodegradable Materials (cornstarch, sugarcane, or algae)
- By Beverages Type
- Alcoholic
- Beer
- Wine
- Spirits
- Other Alcoholic Beverages
- Non-Alcoholic
- Juices
- Carbonated Soft Drinks (CSDs)
- Dairy-based Drinks
- Other Non-Alcoholic Beverages
- Alcoholic
- By Packaging Type
- Bottles and Jars
- Cans
- Pouches
- Bag-in-Box
- Cartons
- By Distribution Channel
- Direct
- Indirect
- By Geography
- North America
- United States
- Canada
- Mexico
- South America
- Brazil
- Argentina
- Rest of South America
- Europe
- Germany
- United Kingdom
- France
- Italy
- Spain
- Rest of Europe
- Asia-Pacific
- China
- India
- Japan
- South Korea
- Australia
- Rest of Asia-Pacific
- Middle East and Africa
- Middle East
- Saudi Arabia
- United Arab Emirates
- Turkey
- Rest of Middle East
- Africa
- South Africa
- Egypt
- Nigeria
- Rest of Africa
- Middle East
- North America
Data Sources, Market Sizing, and Validation
Desk Research
Desk work starts by building a clean fact base on beverage consumption, packaging demand signals, and material supply conditions, so our assumptions do not drift away from measurable inputs. We typically use public sources such as the United Nations Comtrade database for trade flows, World Bank and OECD macro indicators, and US EPA and Eurostat waste and recycling statistics to sanity check material shifts.
To add industry color, we also review company annual reports, investor decks, and public sustainability disclosures, plus packaging and beverage association publications. We use reputable press coverage of capacity additions and regulation changes to time demand and supply impacts. Where needed, we use paid subscriptions for company financials and news intelligence, a patent database for packaging innovation, and an import/export shipment level database to validate trade direction and timing. These desk sources are not exhaustive, and we also relied on other public and paid references to collect data, validate it, and clarify open questions.
Primary Interviews and Surveys
Primary work is used to pressure test what we see in public data, especially on price realization, format mix changes, and how demand differs by beverage type and channel. We interview and survey a mix of container producers, raw material participants, converters, distributors, and large beverage buyers across APAC, EMEA, and the Americas, so regional patterns are not averaged away too early.
Distribution of primary research fieldwork respondents
| Company type | Respondent position | Region |
|---|---|---|
| Top tier: 30% | CXOs: 21% | APAC: 44% |
| Mid tier: 48% | Functional/Unit leaders: 20% | EMEA: 30% |
| Smaller Players: 22% | Managers: 59% | Americas: 26% |
Market-Sizing & Forecasting
For sizing, we use top-down and bottom-up logic together, although the model is mainly built from the top using region level demand pools. In practice, beverage production and consumption indicators are translated into container demand by applying packaging intensity and format mix, and then values are formed using average selling price bands by material and pack type.
The model is guided by observable fingerprints such as beverage output growth, aluminum and PET resin price direction, recycled content adoption rates, can share versus bottle share movements, and region level trade and capacity signals for container materials. Where data is thin for a format in a smaller geography, we handle gaps using peer-region ratios and then adjust using interview inputs on local adoption and pricing.
Forecasts are built with scenario analysis, because regulations on recyclability, deposit return systems, and lightweighting can change format mix faster than a single trend line would suggest. The scenarios are anchored to macro variables, beverage volume outlook, and material price expectations. We then check the implied results with selective bottom-up approximations, such as sampled price times volume for key formats, and channel checks with distributors before final numbers are locked.
Data Validation & Update Cycle
Validation is done in layers so the final totals stay consistent with real-world signals. We compare outputs against independent markers such as trade movement, public recycling statistics, and company disclosed volume or revenue direction, then investigate variances that fall outside expected ranges.
Before sign-off, the model and assumptions go through multi-step analyst reviews, and follow-up calls are triggered when a new regulation, a material price shock, or a large capacity move changes the expected trajectory. Reports are refreshed annually, and interim updates are made when material events occur, followed by a final freshness check right before delivery so clients receive the latest updated view.
Mordor Intelligence's Beverage Container Market Size Compared With Other Published Estimates
Published market sizes for beverage containers can look far apart even when the topic sounds similar, since the boundary of what counts as a container and which years are treated as the starting point can change the calculation quickly. Differences also come from how pricing is handled across materials and how aggressively the mix shift is assumed to move from glass to cans, cartons, or pouches.
By tracking format-mix shifts and refreshing price bands by material and region, the 2026 value from Mordor Intelligence is tied to observable consumption and packaging intensity signals, which can diverge from estimates that start from older base years or fold in adjacent packaging spend. Another frequent driver is whether a study blends in secondary packaging, closures, or broader beverage packaging categories, and whether currency conversion timing is kept consistent across regions.
Benchmark comparison
| Source | Market Size | Gaps in Research Methodology |
|---|---|---|
| Mordor Intelligence | USD 231.03 B (2026) | |
| Industry Publisher A | USD 154.30 B (2024) | Uses a different base year and forecast window, and its scope is often interpreted as broader beverage containers across many sub-definitions, which can shift what is counted and how prices are averaged. |
| Advisory Group B | USD 245.40 B (2024) | Reports a current-year value that may include adjacent packaging spend or uses different constant versus current price handling, which can lift the headline number versus a container-only, format-mix based build. |
The table shows that year choice and scope boundaries explain much of the spread, and pricing treatment explains the rest. When the build is tied back to beverage demand, realistic format shares, and transparent price bands, the final number is easier to reproduce and update when conditions change next year.


Key Questions Answered in the Report
What is the current global value of the beverage container market?
The beverage container market size stands at USD 231.03 billion in 2026.
How fast is the sector expected to grow over the next five years?
The market is forecast to register a 5.75% CAGR, reaching USD 305.55 billion by 2031.
Which material segment is expanding the quickest?
Compostable and biodegradable polymers lead growth at a 7.32% CAGR through 2031.
Which region will post the highest growth rate?
The Middle East and Africa is projected to advance at a 7.84% CAGR to 2031.
What share do non-alcoholic beverages occupy in global container demand?
Non-alcoholic beverages represent 63.32% of volume and are still growing faster than alcoholic lines.
Who are the leading suppliers?
Amcor, Ball Corporation, Crown Holdings, Ardagh Group, and Owens-Illinois together capture 42% of worldwide revenue.
Page last updated on:


