Market Overview
| Study Period | 2020 - 2031 |
|---|---|
| Forecast Data Period | 2026 - 2031 |
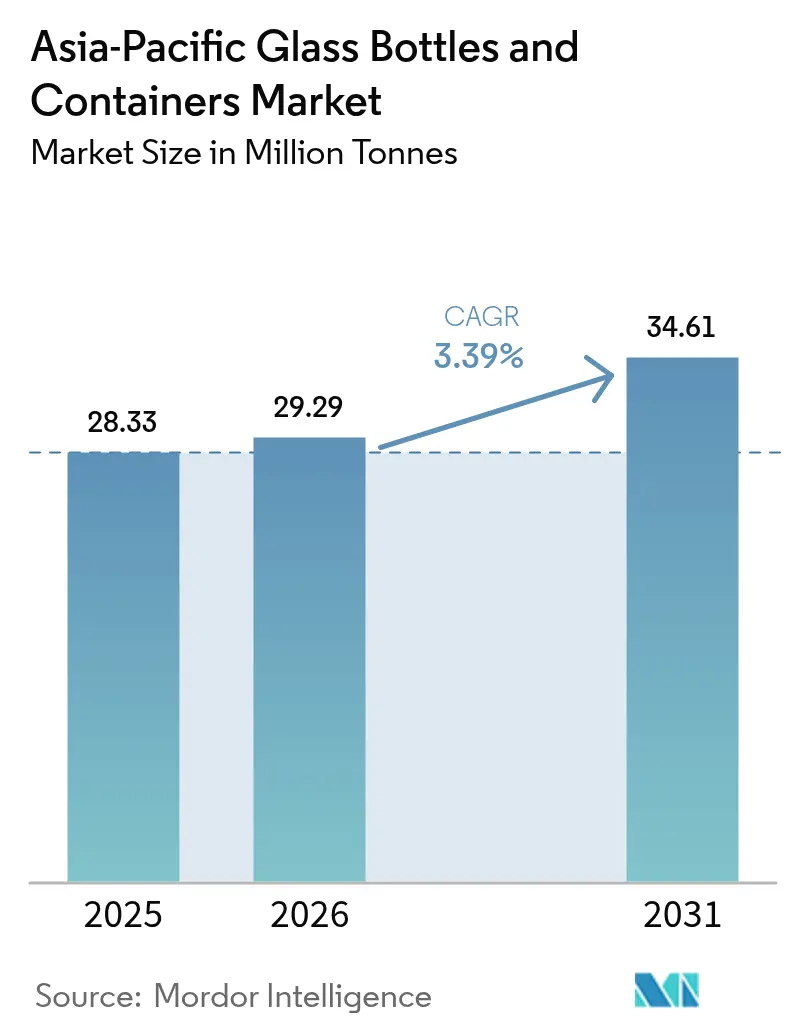
| Base Year Market Size (2025) | 28.33 Million tonnes |
| Market Volume (2026) | 29.29 Million tonnes |
| Market Volume (2031) | 34.61 Million tonnes |
| Growth Rate (2026 - 2031) | 3.39% CAGR |
| Market Concentration | Low |
Major Players *Disclaimer: Major Players sorted in no particular order Image © Mordor Intelligence. Reuse requires attribution under CC BY 4.0. | |
Asia-Pacific Glass Bottles And Containers Market Analysis by Mordor Intelligence
The Asia-Pacific Glass Bottles and Containers Market size was valued at 28.33 million tonnes in 2025 and estimated to grow from 29.29 million tonnes in 2026 to reach 34.61 million tonnes by 2031, at a CAGR of 3.39% during the forecast period (2026-2031). This growth trajectory signals a gradual shift away from purely volume-driven expansion toward value-enhancing, premium, and sustainability-focused applications that can command higher margins. The region’s beverage producers have historically underpinned baseline demand, yet alternative substrates such as lightweight metal and multilayer plastic increasingly challenge glass in mass-market segments. Counterbalancing that pressure, new regulatory incentives for recycling, rising consumer environmental awareness, and premiumization in cosmetics, specialty food, and craft beverages are opening higher-value demand pockets. Competitive strategies, therefore, revolve around operational efficiency, decarbonization technologies, and higher cullet utilization, placing technologically advanced manufacturers in a favorable position to capture incremental share within the Asia-Pacific container glass market.
Key Report Takeaways
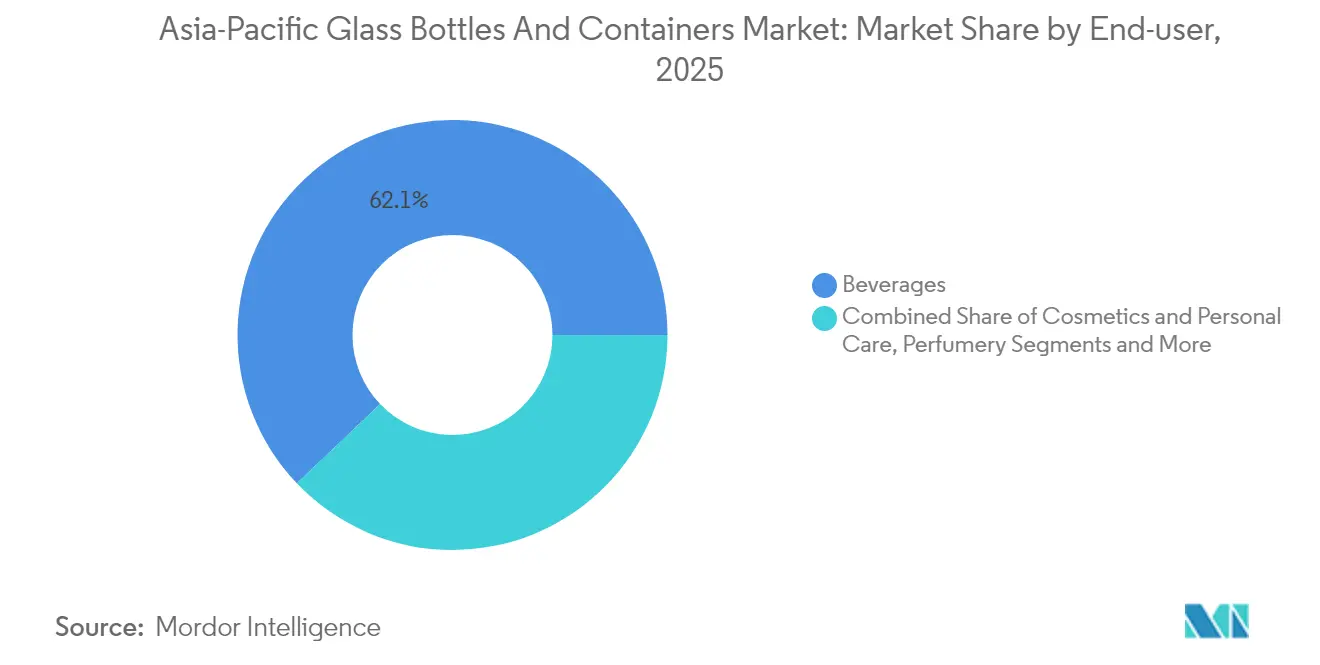
- By end-user, beverages captured 62.12% of the Asia-Pacific glass bottles and containers market share in 2025.
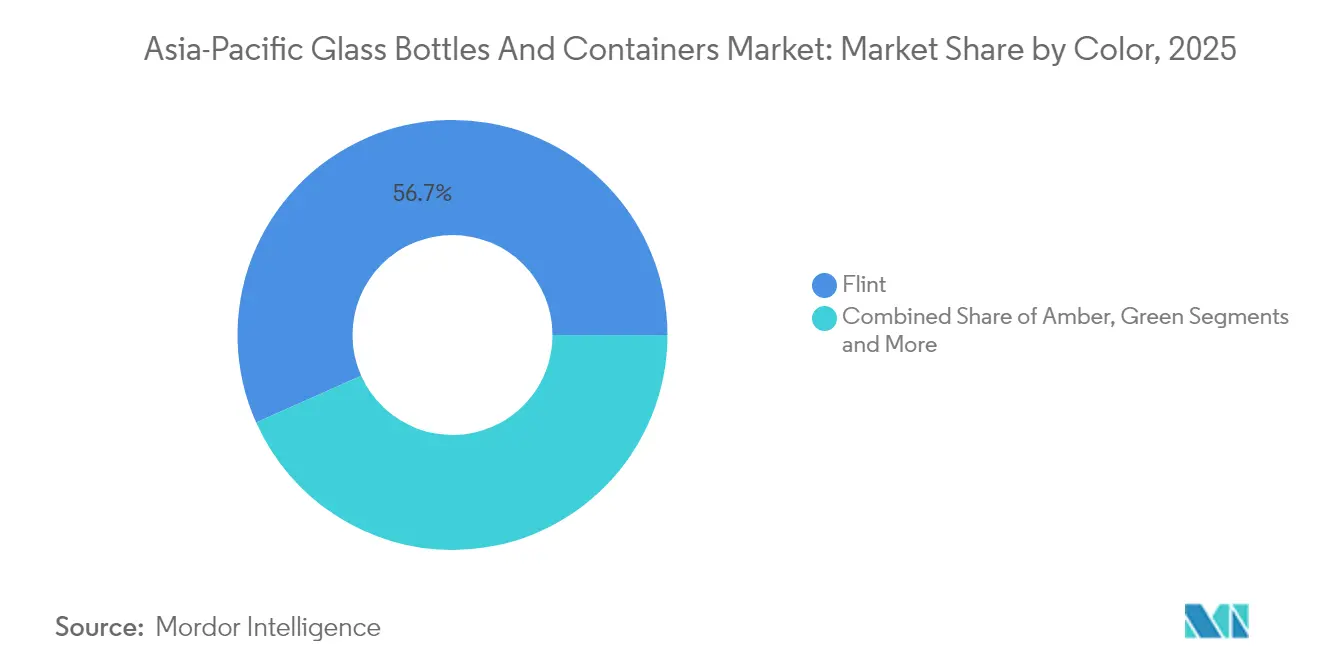
- By color, the Asia-Pacific glass bottles and containers for amber glass are projected to grow at a 4.86% CAGR between 2026-2031.
- By country, China captured 37.89% of the Asia-Pacific glass bottles and containers market share in 2025.
Note: Market size and forecast figures in this report are generated using Mordor Intelligence’s proprietary estimation framework, updated with the latest available data and insights as of 2026.
Asia-Pacific Glass Bottles And Containers Market Trends and Insights
Drivers Impact Analysis*
| Driver | (~) % Impact on CAGR Forecast | Geographic Relevance | Impact Timeline |
|---|---|---|---|
| China and India ramping up glass container exports | +0.8% | China, India, spillover to ASEAN | Medium term (2–4 years) |
| Technological advancements in glass manufacturing | +0.6% | Global; early adoption in Japan, South Korea | Long term (≥ 4 years) |
| Government regulations supporting recycling | +0.5% | Core APAC markets; led by Japan, Australia | Medium term (2–4 years) |
| Rising demand from food and beverage sector | +0.7% | Strongest in India, Vietnam, Thailand | Short term (≤ 2 years) |
| Consumer preference for premium and sustainable packaging | +0.4% | Developed APAC urban centers | Long term (≥ 4 years) |
| Expansion of recycling infrastructure in developed APAC | +0.3% | Japan, South Korea, Australia, New Zealand | Long term (≥ 4 years) |
| Source: Mordor Intelligence | |||
China and India Ramping Up Glass Container Exports
China leverages decades of large-scale furnace capacity and cost-optimized logistics to serve neighboring import-dependent ASEAN markets, while India capitalizes on lower labor costs and newer assets tailored for global quality standards. PGP Glass’s 1,600 tons-per-day capacity across India and Sri Lanka illustrates an export-oriented model that has begun diverting share away from smaller Southeast Asian producers, although the permanence of these gains hinges on maintaining energy-cost advantages and access to cullet at competitive prices. Such bilateral export momentum collectively adds roughly 0.8 percentage points to the regional CAGR by improving furnace utilization in both countries and narrowing unit costs for overseas shipments.
Technological Advancements in Glass Manufacturing
Hybrid furnaces operating on 80% renewable electricity and 20% gas combustion have moved from pilot to commercial scale, notably at facilities operated by Gerresheimer and Ardagh.[1]Ardagh Group, “AGP and CAP Glass Invest in Recycling,” ardaghgroup.com Verallia’s fully electric furnace in Cognac demonstrates the feasibility of 100% electrification, signaling a path toward drastically lower Scope 1 emissions. Coupled with Industry 4.0 controls, predictive maintenance, digital quality inspection, and real-time energy optimization, these innovations can lower energy consumption per ton by up to 30%, directly lifting margins and regulatory compliance readiness across the Asia-Pacific container glass market.
Government Regulations Supporting Recycling
Vietnam’s Extended Producer Responsibility rules, introduced in January 2024, Australia’s proposed packaging reform, and Singapore’s forthcoming container deposit system collectively raise the cost of non-recyclable substrates while making glass’s theoretically infinite recyclability economically attractive. Mandatory recycled-content targets also stimulate demand for high-quality cullet, favoring vertically integrated glassmakers that operate their own sorting and beneficiation units. As compliance deadlines tighten, brand owners gravitate toward glass in premium ranges to ensure regulatory alignment and maintain high-end aesthetics, incrementally adding 0.5 points to the Asia-Pacific container glass market’s growth rate.
Rising Demand from Food and Beverage Sector
Premium spirits, craft beer, artisanal sauces, and functional beverages are emphasizing brand story and shelf appeal, elevating glass from a commodity vessel to a key marketing asset. In India, rising disposable incomes and consumer experimentation spur volume growth, whereas in Japan and South Korea, the narrative centers on premium positioning and sustainability credentials. Glass’s inert nature and perceived health advantages resonate with consumers pivoting away from single-use plastics, underpinning a 0.7 point lift to regional CAGR. Producers able to offer low-carbon, lightweight bottles stand to capture disproportionate value within the Asia-Pacific container glass market.
Restraints Impact Analysis*
| Restraint | (~) % Impact on CAGR Forecast | Geographic Relevance | Impact Timeline |
|---|---|---|---|
| High energy consumption in glass production | −0.9% | Most severe in China, India | Short term (≤ 2 years) |
| Volatility in raw material prices | −0.6% | Global; acute in import-dependent markets | Short term (≤ 2 years) |
| Infrastructure limitations in emerging markets | −0.4% | Vietnam, Thailand, emerging ASEAN | Medium term (2–4 years) |
| Competitive pressure from plastic and metal alternatives | −0.7% | Global; strongest in price-sensitive segments | Medium term (2–4 years) |
| Source: Mordor Intelligence | |||
High Energy Consumption in Glass Production
Furnace operations can consume 60-70% of total plant energy, exposing manufacturers to elevated electricity tariffs and gas price volatility. China’s winter power-rationing episodes and India’s grid reliability challenges add immediate cost pressure, compelling operators to accelerate cullet utilization and experiment with alternative fuels such as bio-LNG and green hydrogen. O-I’s 100% biofuel trial at its Harlow plant demonstrated an 88% cullet rate and sizable CO₂ reductions, hinting at a realistic mitigation pathway even though feedstock availability remains a hurdle.[2]Glass International, “O-I CEO: Glass Market Remains Sluggish,” glass-international.com
Volatility in Raw Material Prices
Sharp swings in soda ash and silica sand prices, notably the 30–50 RMB per ton increase observed in China in early 2025, compress margins for producers unable to hedge inputs or secure long-term contracts. Vertically integrated players and those operating beneficiation plants enjoy cost buffers, while smaller firms reliant on spot purchasing face sharper profit erosion. These input gyrations can subtract roughly 0.6 percentage points from the Asia-Pacific container glass market’s potential CAGR in the near term.
*Our forecasts treat driver/restraint impacts as directional, not additive. The impact forecasts reflect baseline growth, mix effects, and variable interactions.
Segment Analysis
By End-user: Cosmetics Drives Premium Transformation
The cosmetics and personal care segment is projected to outpace all others at a 4.63% CAGR, even though beverages still commanded 62.12% of the Asia-Pacific container glass market share in 2025. Perfumery bottles yield the highest unit margins and often require complex shapes, embossing, and colored glass, pushing average selling prices well above commodity beverage containers.
Premium spirits and craft beer also specify custom flint and amber bottles that align with brand storytelling, further diversifying revenue streams within the Asia-Pacific container glass market. Although pharmaceutical demand outside vials and ampoules remains stable, regulatory integrity requirements keep glass as the substrate of choice, preserving a dependable baseline business.


By Color: Amber Gains Ground on Sustainability
Flint glass maintained 56.68% of the Asia-Pacific container glass market size in 2025 due to its versatility and product visibility advantages. Yet amber’s superior UV-blocking properties are attracting brands concerned with light-sensitive formulations, from serums and essential oils to specialty brews, resulting in a 4.86% forecast CAGR for the color segment. Green glass continues to dominate legacy beer and wine categories where heritage aesthetics remain central, while niche hues fulfill bespoke brand requirements. Economies of scale still favor flint, but tightening quality standards in high-value categories accelerate amber’s penetration across the Asia-Pacific container glass market.
Geography Analysis
China’s leadership rests on extensive capacity, integrated supply chains, and established export corridors, yet the 30-50 RMB per ton glass price hikes in early 2025 expose the vulnerability of energy-intensive plants to cost inflation. Strategic priorities now focus on value-added, lighter-weight bottles that can offset operating cost creep.
India rides urbanization and premiumization waves, yet infrastructure bottlenecks and capital constraints occasionally cap furnace utilization. Japan and South Korea showcase best-in-class recycling rates, with Japan operating 26 dedicated plants that feed cullet back into domestic furnaces, reinforcing circular supply loops.
Australia and New Zealand exhibit modest volume but high per-capita consumption of premium beverages packaged in glass, ensuring steady demand for specialty, low-carbon bottles.
Competitive Landscape
The Asia-Pacific container glass industry is moderately consolidated. Global majors O-I Glass, Verallia, and Ardagh continue optimizing furnace footprints; O-I closed 14% of capacity in 2024 and is exploring an additional 7% reduction by mid-2025 to yield USD 300 million in savings by 2027.
Decarbonization investments are escalating: the U.S. Department of Energy granted O-I USD 125 million to advance electrification and hybrid furnaces in 2024.[3]O-I, “O-I’s Sustainable Progress Towards Decarbonization,” o-i.com Ardagh and CAP Glass allocated undisclosed sums in April 2025 to bolster regional cullet processing capacity.
Technology-rich firms differentiate through higher cullet ratios. O-I’s biofuel trial achieved an 88% cullet blend and digitally enabled furnaces that reduce downtime, reinforcing a virtuous cycle of lower emissions and lower costs within the Asia-Pacific container glass market.
Asia-Pacific Glass Bottles And Containers Industry Leaders
Gerresheimer AG
PGP Glass Private Limited
Hindusthan National Glass & Industries Ltd.
O-I Glass, Inc.
Ardagh Group S.A.
- *Disclaimer: Major Players sorted in no particular order


Recent Industry Developments
- April 2025: Ardagh Group and CAP Glass disclosed a joint investment to expand recycling infrastructure across the Asia-Pacific.
- March 2025: O-I Glass completed a 100% biofuel trial at its Harlow, UK plant, hitting an 88% cullet rate and sizable CO₂ cuts.
- January 2025: O-I Glass issued a sustainability progress report outlining low-carbon technology rollouts and cullet ramp-ups.
- undefinedJun 2024: O-I Glass announced a USD 65 million electrification upgrade at its Veauche, France, site.


Asia-Pacific Glass Bottles And Containers Market Report Scope
Container glass is used in the alcoholic and non-alcoholic beverage industries due to its ability to maintain chemical inertness, sterility, and non-permeability. Glass packaging is valued for its unique properties, including its transparency, inertness, and ability to preserve the quality and integrity of its contents. It is often chosen for products where purity, safety, and environmental sustainability are paramount concerns.
The Asia-Pacific container glass market is segmented by end-user vertical (beverages [alcoholic beverages (beer, wine, spirits, and other alcoholic beverages {cider and other fermented drinks}), non-alcoholic beverages (juices, carbonated drinks (CSDs), dairy product-based drinks, other non-alcoholic beverages)], food [jam, jelly, marmalades, honey, sausages and condiments, oil, pickles], cosmetics and personal care, pharmaceuticals (excluding vials and ampoules), and perfumery), by color (green, amber, flint and other colors) and country (China, India, Japan, Thailand, Australia and New Zealand, South Korea, Vietnam, Rest of Asia Pacific). The report offers market forecasts and size in volume (kilotons) for all the above segments.
By End-user
| Beverages | Alcoholic | Beer |
| Wine | ||
| Spirits | ||
| Other Alcoholic Beverages (Cider and Other Fermented Drinks) | ||
| Non-Alcoholic | Juices | |
| Carbonated Drinks (CSDs) | ||
| Dairy Product Based Drinks | ||
| Other Non-Alcoholic Beverages | ||
| Food (Jam, Jelly, Marmalades, Honey, Sausages and Condiments, Oil, Pickles) | ||
| Cosmetics and Personal Care | ||
| Pharmaceuticals (excluding Vials and Ampoules) | ||
| Perfumery | ||
By Color
| Green |
| Amber |
| Flint |
| Other Colors |
By Country
| China |
| India |
| Japan |
| Thailand |
| Australia and New Zealand |
| South Korea |
| Vietnam |
| Rest of Asia-Pacific |
| By End-user | Beverages | Alcoholic | Beer |
| Wine | |||
| Spirits | |||
| Other Alcoholic Beverages (Cider and Other Fermented Drinks) | |||
| Non-Alcoholic | Juices | ||
| Carbonated Drinks (CSDs) | |||
| Dairy Product Based Drinks | |||
| Other Non-Alcoholic Beverages | |||
| Food (Jam, Jelly, Marmalades, Honey, Sausages and Condiments, Oil, Pickles) | |||
| Cosmetics and Personal Care | |||
| Pharmaceuticals (excluding Vials and Ampoules) | |||
| Perfumery | |||
| By Color | Green | ||
| Amber | |||
| Flint | |||
| Other Colors | |||
| By Country | China | ||
| India | |||
| Japan | |||
| Thailand | |||
| Australia and New Zealand | |||
| South Korea | |||
| Vietnam | |||
| Rest of Asia-Pacific | |||


Key Questions Answered in the Report
What is the projected CAGR for Asia-Pacific container glass demand between 2026 and 2031?
The Asia-Pacific Glass Bottles and Containers Market is forecast to register a 3.39% CAGR, rising from 29.29 million tonnes in 2026 to 34.61 million tonnes by 2031.
Which end-user segment is expected to grow the fastest through 2031?
Cosmetics and personal care packaging is anticipated to expand at a 4.63% CAGR, outpacing other segments despite beverages holding the largest share in 2025.
Why are amber bottles gaining traction in the region?
Amber glass offers superior UV protection for light-sensitive formulations, making it increasingly popular among premium cosmetics, pharmaceuticals, and craft beverage brands that emphasize product integrity and shelf life.
How are manufacturers addressing high energy costs in glass production?
Leading producers are investing in hybrid and fully electric furnaces, upping cullet ratios, and trialing alternative fuels such as bio-LNG and 100% biofuel to cut energy intensity and lower carbon footprints.
Page last updated on:


