Automotive Energy Recovery Systems Market Size and Share
Market Overview
| Study Period | 2019 - 2030 |
|---|---|
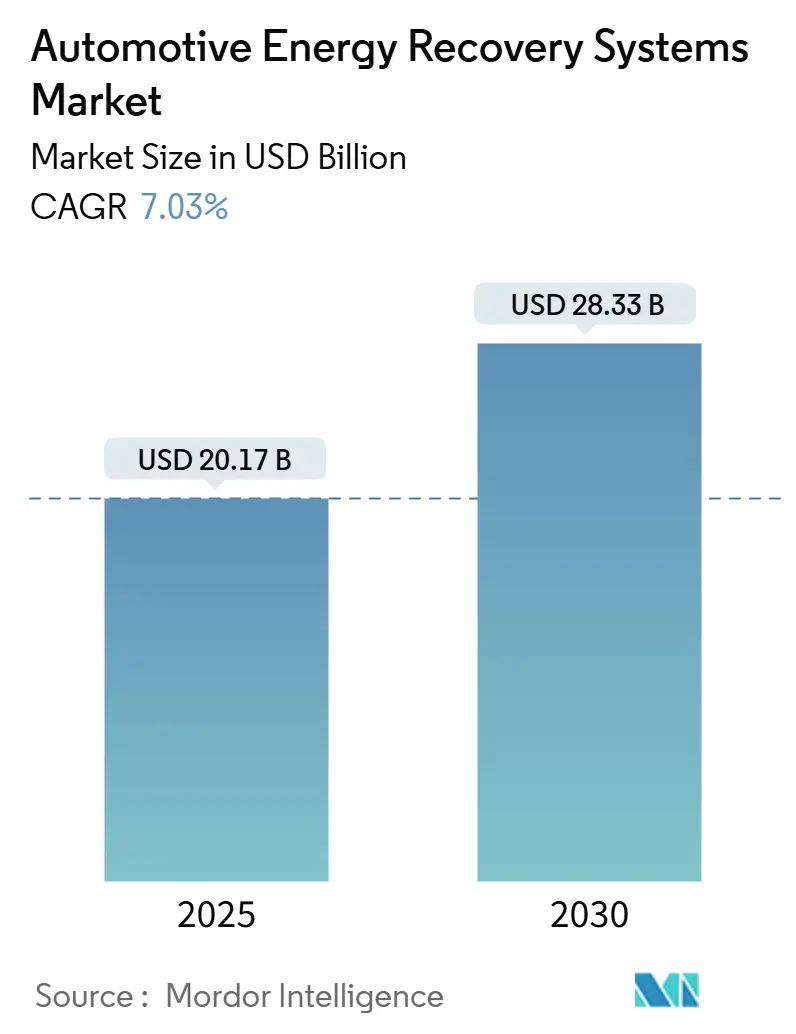
| Market Size (2025) | USD 20.17 Billion |
| Market Size (2030) | USD 28.33 Billion |
| Growth Rate (2025 - 2030) | 7.03% CAGR |
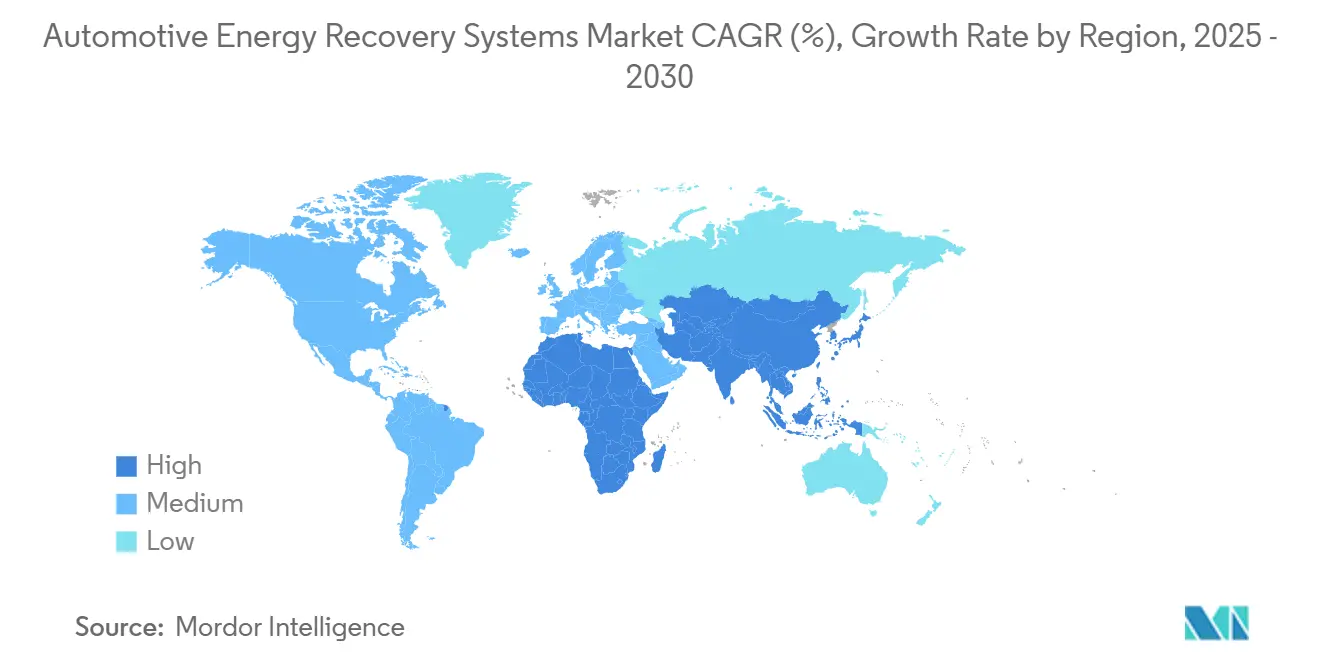
| Fastest Growing Market | Middle East and Africa |
| Largest Market | Asia Pacific |
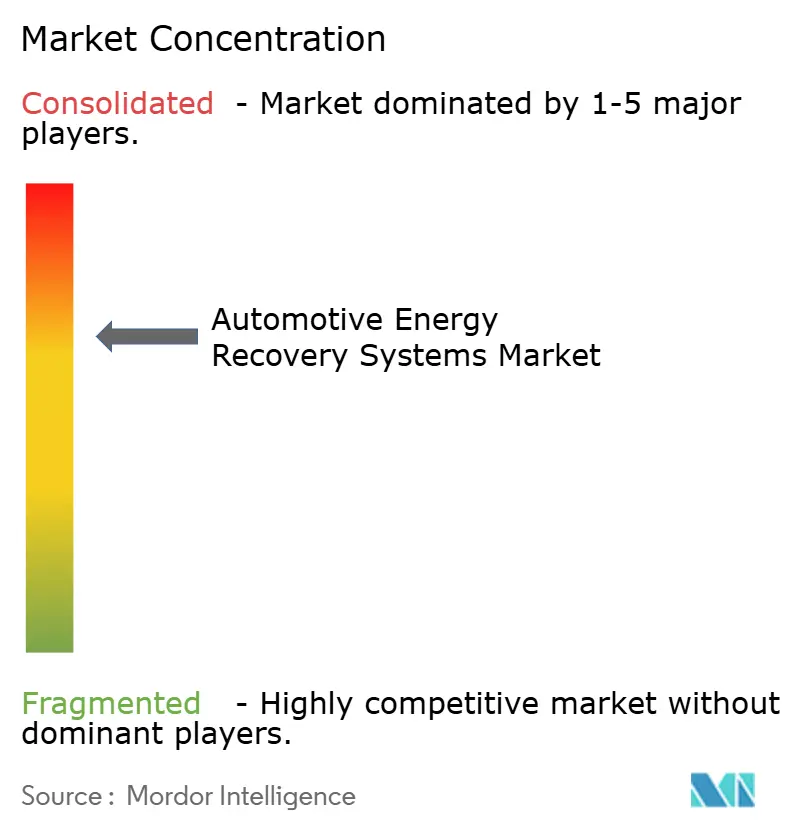
| Market Concentration | Medium |
Major Players *Disclaimer: Major Players sorted in no particular order Image © Mordor Intelligence. Reuse requires attribution under CC BY 4.0. | |
Automotive Energy Recovery Systems Market Analysis by Mordor Intelligence
The Automotive Energy Recovery Systems market size stands at USD 20.17 billion in 2025, and is set to reach USD 28.33 billion by 2030, translating into a 7.03% CAGR over 2025-2030. Persistent regulatory pressure, rapid fleet electrification, and cost-focused efficiency gains position energy recovery as a core design element rather than an accessory. Stricter global CO₂ rules led by Euro 7 in Europe and China’s dual-credit regime shorten compliance windows and push automakers to install regenerative braking, exhaust heat recovery, and 48 V mild-hybrid solutions across platforms. Rising turbo-boost demand in downsized engines, expanding V2X pilots, and brake-by-wire rollouts reinforce the commercial logic by lifting real-world fuel savings into double digits. Competitive intensity remains high as Tier-1 suppliers defend incumbency through scale and R&D depth, yet specialized players gain openings in flywheel storage, predictive software, and subsystem integration.
Key Report Takeaways
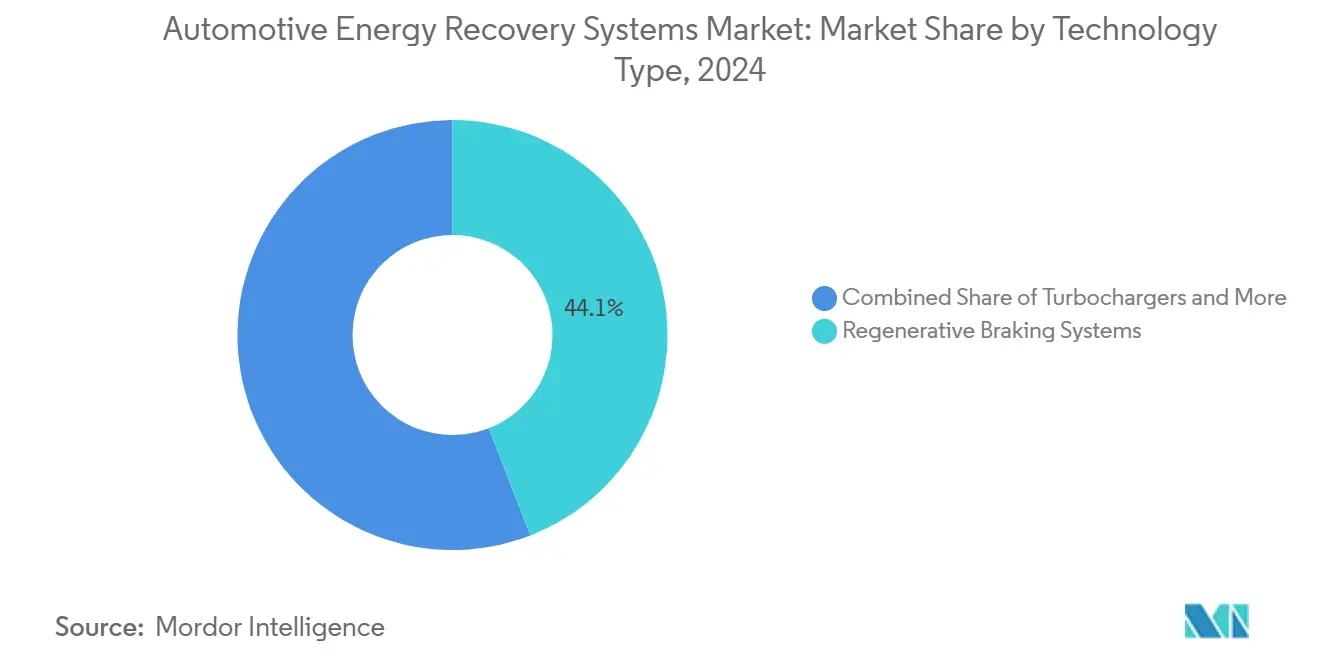
- By technology type, regenerative braking led with 44.12% of the Automotive Energy Recovery Systems market share in 2024; flywheel energy storage is forecast to expand at an 8.55% CAGR through 2030.
- By subsystem, braking systems accounted for a 49.55% share of the Automotive Energy Recovery Systems market size in 2024, while powertrain systems are projected to advance at an 8.13% CAGR between 2025-2030.
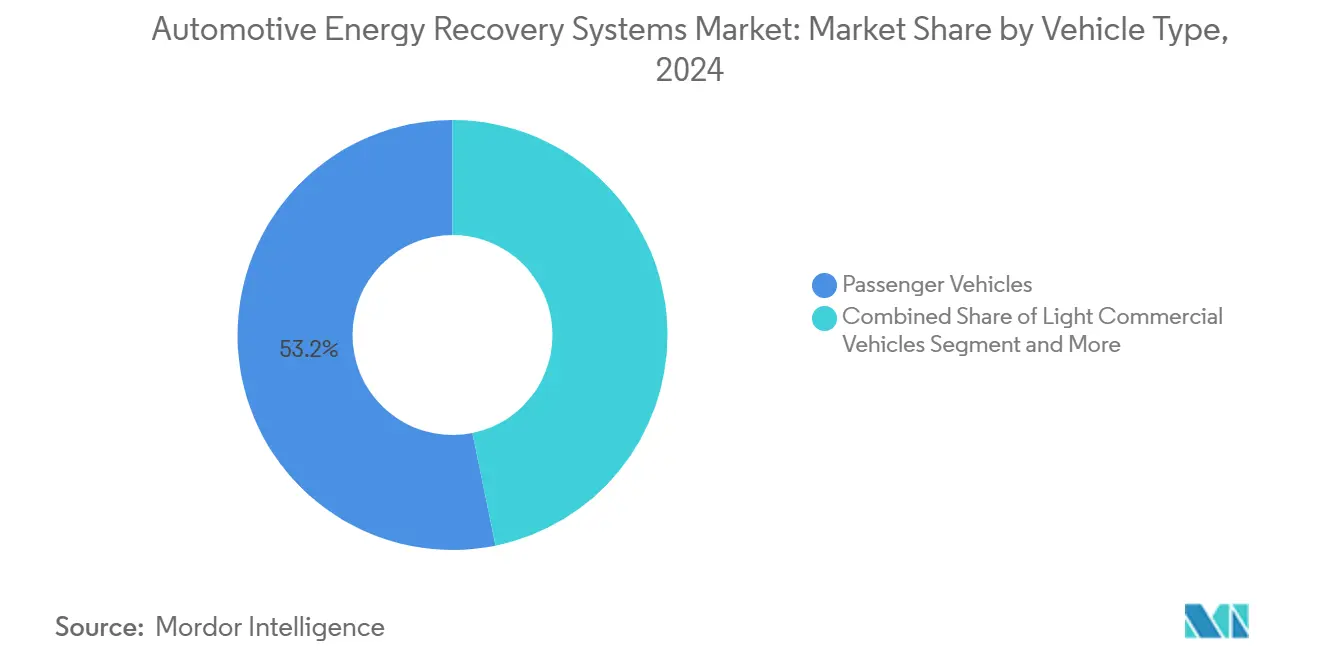
- By vehicle type, passenger vehicles held a 53.16% share of the Automotive Energy Recovery Systems market size in 2024; medium and heavy commercial vehicles are growing fastest at a 7.85% CAGR to 2030.
- By propulsion type, hybrid electric vehicles captured 47.15% share of the Automotive Energy Recovery Systems market in 2024, whereas battery electric vehicles record the highest projected CAGR at 9.14% through 2030.
- By geography, Asia-Pacific dominated with a 39.44% Automotive Energy Recovery Systems market share in 2024; the Middle East and Africa region is the fastest growing at a 7.45% CAGR to 2030.
Global Automotive Energy Recovery Systems Market Trends and Insights
Drivers Impact Analysis*
| Driver | (~) % Impact on CAGR Forecast | Geographic Relevance | Impact Timeline |
|---|---|---|---|
| Rapid Electrification of Vehicle Fleets | +2.1% | Asia-Pacific and Europe lead | Long term (≥ 4 years) |
| Stricter Global CO₂ and Fuel-Economy Rules | +1.8% | EU, China, North America, global spill-over | Medium term (2-4 years) |
| OEM Shift to Mild-Hybrid Architectures | +1.4% | Global, early uptake in premium segments | Medium term (2-4 years) |
| Brake-By-Wire Enables Higher Regen | +1.2% | Premium and commercial segments worldwide | Medium term (2-4 years) |
| Engine Downsizing with Turbo-Boost Demand | +0.9% | North America and the EU | Short term (≤ 2 years) |
| V2X Energy-Recapture Incentives | +0.6% | Asia-Pacific core, expanding to the EU and North America | Long term (≥ 4 years) |
| Source: Mordor Intelligence | |||
Rapid Electrification of Vehicle Fleets
Commercial operators accelerate electrification because the total cost of ownership gains outweigh diesel alternatives. China’s Ministry of Transport measured significant energy recovery efficiency in pilot electric buses during 2024 urban tests. Grid services in Dutch V2G trials demonstrated the potential to generate revenue per vehicle annually. Capturing kinetic energy during frequent braking extends range and trims charging downtime, reinforcing a self-sustaining adoption cycle.
Stricter Global CO₂ and Fuel-Economy Regulations
Euro 7 mandates 15% lower CO₂ from new passenger cars by 2025, while the U.S. CAFE standard moves to 40.4 mpg fleet average in 2026 [1]“Euro 7 Vehicle Emission Standards,” European Commission, europa.eu. China’s dual-credit system imposes penalties up to CNY 50,000 per non-compliant vehicle, and the 2026 Carbon Border Adjustment Mechanism puts tariffs on high-carbon automotive imports. Automakers now treat energy recovery as mandatory, securing up to 12% fuel savings by coupling regenerative braking with exhaust heat capture. Compliance deadlines clustered in 2025-2027 compress decision cycles, spurring rapid platform-wide deployments across the Automotive Energy Recovery Systems market.
OEM Shift to 48 V Mild-Hybrid Architectures
A 48 V backbone supports stronger regenerative braking and efficient electric assist. Continental’s 2024 mild-hybrid modules show notable real-world fuel cuts on multi-OEM platforms. SEG Automotive’s starter-generators repurpose traditional components into power-dense recovery devices. Standardized voltage simplifies integration, lowers cost, and broadens adoption across vehicle classes.
Brake-by-Wire Enabling Higher Regen Efficiency
Bosch plans a Q4 2025 brake-by-wire launch and estimated that more than 5.5 million vehicles worldwide will be equipped with brake-by-wire by 2030[2]“Brake-by-Wire System Launch Details,” Bosch Mobility, bosch-mobility.com. Electronic actuation decouples pedal feel from hydraulic circuits, allowing smoother regen blending and up to 70% kinetic energy capture, especially in premium and light commercial segments.
Restraints Impact Analysis*
| Restraint | (~) % Impact on CAGR Forecast | Geographic Relevance | Impact Timeline |
|---|---|---|---|
| Added System Cost, Weight | -1.1% | Global, most acute in price-sensitive regions | Short term (≤ 2 years) |
| Raw Material Supply Chain Risks | -0.8% | Highest in APAC manufacturing hubs | Medium term (2-4 years) |
| Thermal and Durability Limits | -0.6% | Commercial vehicle applications worldwide | Medium term (2-4 years) |
| Lack of Battery Recycling Standards | -0.4% | Emerging markets lag on regulation | Long term (≥ 4 years) |
| Source: Mordor Intelligence | |||
Added System Cost and Weight Penalties
Regenerative braking currently adds USD 800-1,200 and 15-25 kg weight per vehicle. Entry-level segments struggle to justify upfront premiums when consumers focus on sticker price. Extra mass can negate efficiency gains, especially in small cars. Lightweight materials and compact packaging are advancing, yet a near-term cost gap persists, slowing uptake in the Automotive Energy Recovery Systems market.
Raw-Material Supply-Chain Risks for Key Components
Permanent-magnet motors depend on neodymium, and lithium supplies underpin battery modules. China refines 85% of rare earths, exposing producers to geopolitical volatility. Neodymium prices swung significantly during 2024, rattling component budgets. Europe’s 2024 Critical Raw Materials Act mandates strategic stockpiles, lifting short-term procurement costs.
*Our forecasts treat driver/restraint impacts as directional, not additive. The impact forecasts reflect baseline growth, mix effects, and variable interactions.
Segment Analysis
By Technology Type: Regenerative Braking Dominates Innovation Pipeline
Regenerative braking captured 44.12% of the automotive energy recovery systems market share in 2024, underscoring maturity and plug-and-play compatibility with electrified drivetrains. Flywheel storage, while niche, advances at an 8.55% CAGR as high-power, fast-cycling needs rise in delivery fleets and performance cars. Exhaust energy recovery via turbochargers and EGR modules sustains demand among downsized ICE platforms, where BorgWarner and Rheinmetall secure multi-year contracts.
Integrated solutions now merge brake-by-wire, e-turbo, and power electronics to harvest kinetic and thermal energy under varied load conditions. Electro-hydraulic hybrids expand regenerative reach in heavy-duty sectors where hydraulic reliability is paramount. Punch Flybrid and Revterra prove flywheel resilience across millions of cycles, widening commercial arguments for chemical-free storage.


By Subsystem: Braking Systems Lead Integration Complexity
Braking subsystems accounted for 49.55% of the automotive energy recovery systems market share in 2024, owing to straightforward retrofit paths and familiarity among OEM engineers. Powertrain-level recovery outpaces at 8.13% CAGR as software harmonizes e-motors, EGR valves, and turbo-generators. Suspension-based harvesters remain nascent but entice premium brands seeking ride comfort paired with energy gains.
Continental’s Future Brake System roadmap envisions one electronic control unit coordinating stopping power, energy recapture, and predictive torque distribution. Powertrain focus fuels algorithm development that balances driver demand with energy opportunity. Meanwhile, suspension innovators like Tenneco harness road-induced motion for auxiliary power, forecast to shift from pilot to scale late in the decade.
By Vehicle Type: Commercial Vehicles Drive Technology Advancement
Passenger vehicles still formed 53.16% of the automotive energy recovery systems market share in 2024, propelled by a large base volume and emissions mandates. Medium and heavy trucks experience the sharpest 7.85% CAGR through 2030 as fleet managers chase fuel savings, uptime, and budding V2G revenue. Light commercial units bridge consumer and duty-cycle needs, adopting brake-by-wire and 48 V regen to stretch range.
Accelera’s iBCR illustrates heavy-duty engineering that withstands extreme brake temperatures while recapturing sizable kinetic loads. Workhorse’s W56 step van proves last-mile electric fleets can extend route length when regenerative algorithms adapt to predictable urban stop-start patterns. Economic payback timelines under 36 months spark procurement across postal, parcel, and municipal sectors.
By Propulsion Type: BEVs Accelerate Energy Recovery Innovation
Hybrid electric vehicles commanded a 47.15% of the automotive energy recovery systems market share in 2024 by blending ICE waste-heat sources with electric drivetrain regen. Battery electric vehicles post a 9.14% CAGR as pure-electric platforms fine-tune energy capture for every watt-hour of range. Conventional ICE models linger as retrofit opportunities but decline proportionally.
BEV pilots on Spain’s Balearic Islands let parked cars feed the grid via bidirectional chargers, effectively monetizing stored regen power [3]“Balearic Islands V2G Pilot Results,” ACCIONA Energía, acciona-energia.com. HEVs remain complexity champions, coordinating multi-source regeneration to maintain drivability. Pure electrics push beyond braking into thermal loops that precondition battery packs using harvested waste heat.
Geography Analysis
Asia-Pacific held 39.44% of the automotive energy recovery systems market share in 2024, fueled by China's aim for new-energy vehicles to make up 45% of all new auto sales by 2027, while India ramps up its production of electrified platforms. China’s dual-credit rules penalize non-compliance, compelling OEMs to bundle regenerative braking and EGR into mainstream models. Japan’s suppliers refine hybrid-centric recovery tech, while South Korea scales e-turbo and brake-by-wire exports.
The Middle East and Africa register the quickest 7.45% CAGR through 2030. South Africa embeds regenerative systems in export sedans, and GCC nations prioritize heat-tolerant components for desert climates. Public-sector electrification programs, notably in UAE bus fleets, demand regenerative solutions that thrive in 50 °C ambient conditions and sand exposure.
Europe and North America continue to see large volumes under policy push from Euro 7 and strengthened CAFE. V2G pilots in Denmark and the Netherlands show commercial viability, with annual grid-service revenues offsetting system costs. High fuel prices and carbon levies extend payback to three years or less, anchoring sustained demand across both continents.

Competitive Landscape
The Automotive Energy Recovery Systems market remains concentrated: Bosch, Continental, and ZF possess long-standing OEM contracts, vertically integrated factories, and hundreds of energy-recovery patents. Collective share sits well above a significant share of global revenues, reflecting entry barriers in safety certification and capital intensity.
Yet disruption looms from niche specialists. Punch Flybrid and Revterra advance mechanical flywheels immune to lithium price swings. Software start-ups craft predictive control stacks that retrofit into fleets without major hardware swaps, stealing mindshare within data-centric electrification programs.
Incumbents hedge by acquiring complementary tech: Bosch invests in silicon-carbide power electronics, Continental pairs brake-by-wire with cybersecurity suites, and ZF rolls out cloud portals that harvest vehicle data for algorithm improvement. Cooperative patents on V2X protocols illustrate how alliances temper rivalry as energy recovery bridges into grid and smart-city ecosystems.
Automotive Energy Recovery Systems Industry Leaders
Robert Bosch GmbH
Continental AG
ZF Friedrichshafen AG
DENSO Corporation
BorgWarner Inc.
- *Disclaimer: Major Players sorted in no particular order

Recent Industry Developments
- May 2025: BorgWarner won four long-term contracts to supply EGR valves, coolers, and modules to a major North American OEM, extending production through 2029.
- February 2025: Cummins unveiled a turbocharger optimized for hydrogen ICE trucks and secured its first European supply deal.
- May 2024: Porsche launched the 911 992.2 GTS hybrid featuring a 40 kW transmission motor and turbo-mounted energy recovery.


Global Automotive Energy Recovery Systems Market Report Scope
| Regenerative Braking Systems |
| Turbochargers |
| Exhaust Gas Recirculation (EGR) |
| Flywheel Energy Storage |
| Electro-Hydraulic Systems |
| Braking System |
| Powertrain System |
| Suspension System |
| Passenger Vehicles |
| Light Commercial Vehicles |
| Medium and Heavy Commercial Vehicles |
| Internal Combustion Engine (ICE) |
| Hybrid Electric Vehicle (HEV) |
| Battery Electric Vehicle (BEV) |
| North America | United States |
| Canada | |
| Rest of North America | |
| South America | Brazil |
| Argentina | |
| Rest of South America | |
| Europe | United Kingdom |
| Germany | |
| Spain | |
| Italy | |
| France | |
| Russia | |
| Rest of Europe | |
| Asia-Pacific | India |
| China | |
| Japan | |
| South Korea | |
| Rest of Asia-Pacific | |
| Middle East and Africa | United Arab Emirates |
| Saudi Arabia | |
| Turkey | |
| Egypt | |
| South Africa | |
| Rest of Middle East and Africa |
| By Technology Type | Regenerative Braking Systems | |
| Turbochargers | ||
| Exhaust Gas Recirculation (EGR) | ||
| Flywheel Energy Storage | ||
| Electro-Hydraulic Systems | ||
| By Subsystem | Braking System | |
| Powertrain System | ||
| Suspension System | ||
| By Vehicle Type | Passenger Vehicles | |
| Light Commercial Vehicles | ||
| Medium and Heavy Commercial Vehicles | ||
| By Propulsion Type | Internal Combustion Engine (ICE) | |
| Hybrid Electric Vehicle (HEV) | ||
| Battery Electric Vehicle (BEV) | ||
| By Geography | North America | United States |
| Canada | ||
| Rest of North America | ||
| South America | Brazil | |
| Argentina | ||
| Rest of South America | ||
| Europe | United Kingdom | |
| Germany | ||
| Spain | ||
| Italy | ||
| France | ||
| Russia | ||
| Rest of Europe | ||
| Asia-Pacific | India | |
| China | ||
| Japan | ||
| South Korea | ||
| Rest of Asia-Pacific | ||
| Middle East and Africa | United Arab Emirates | |
| Saudi Arabia | ||
| Turkey | ||
| Egypt | ||
| South Africa | ||
| Rest of Middle East and Africa | ||


Key Questions Answered in the Report
How large is the Automotive Energy Recovery Systems market in 2025 and how fast will it grow?
The Automotive Energy Recovery Systems market size reaches USD 20.17 billion in 2025 and is forecast to expand at a 7.03% CAGR through 2030.
Which technology leads current adoption?
Regenerative braking systems command 44.12% 2024 share due to ease of integration and proven efficiency gains.
Why are commercial fleets adopting energy recovery faster than passenger cars?
Fleets gain direct fuel-cost savings and can monetize bidirectional charging, achieving payback in under three years for many urban duty cycles.
What regions will see the fastest growth through 2030?
The Middle East and Africa region posts the quickest 7.45% CAGR, driven by infrastructure projects and harsh-climate efficiency demands.
Page last updated on:


