
Automotive Fuel Delivery System Market Size and Share
Market Overview
| Study Period | 2020 - 2031 |
|---|---|
| Market Size (2026) | USD 5.41 Billion |
| Market Size (2031) | USD 7.09 Billion |
| Growth Rate (2026 - 2031) | 5.55 % |
| Fastest Growing Market | Asia Pacific |
| Largest Market | Asia Pacific |
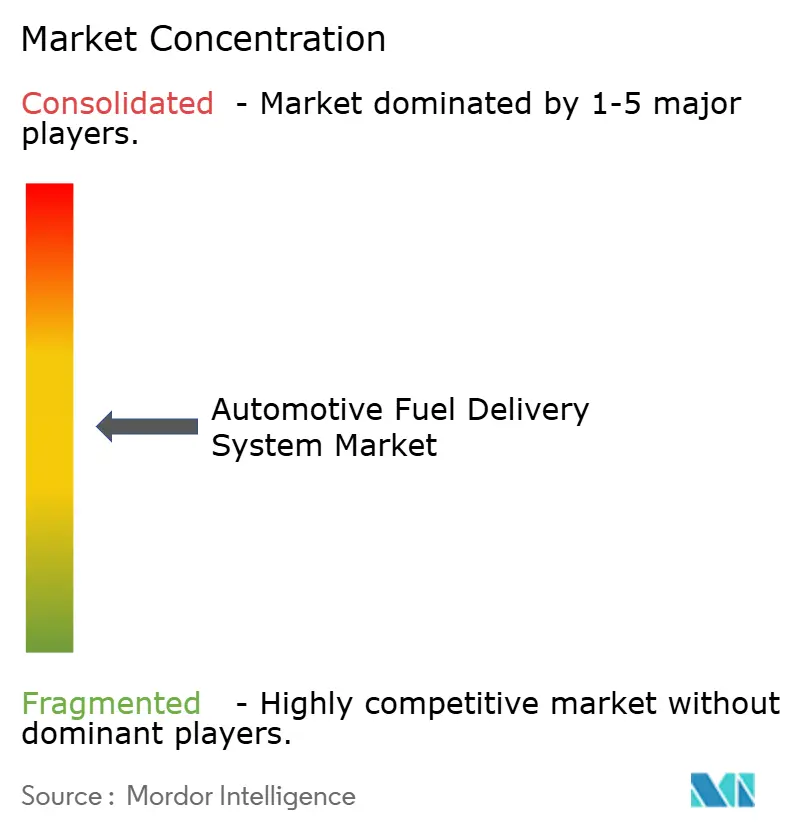
| Market Concentration | Medium |
Major Players *Disclaimer: Major Players sorted in no particular order Image © Mordor Intelligence. Reuse requires attribution under CC BY 4.0. | |
Automotive Fuel Delivery System Market Analysis by Mordor Intelligence
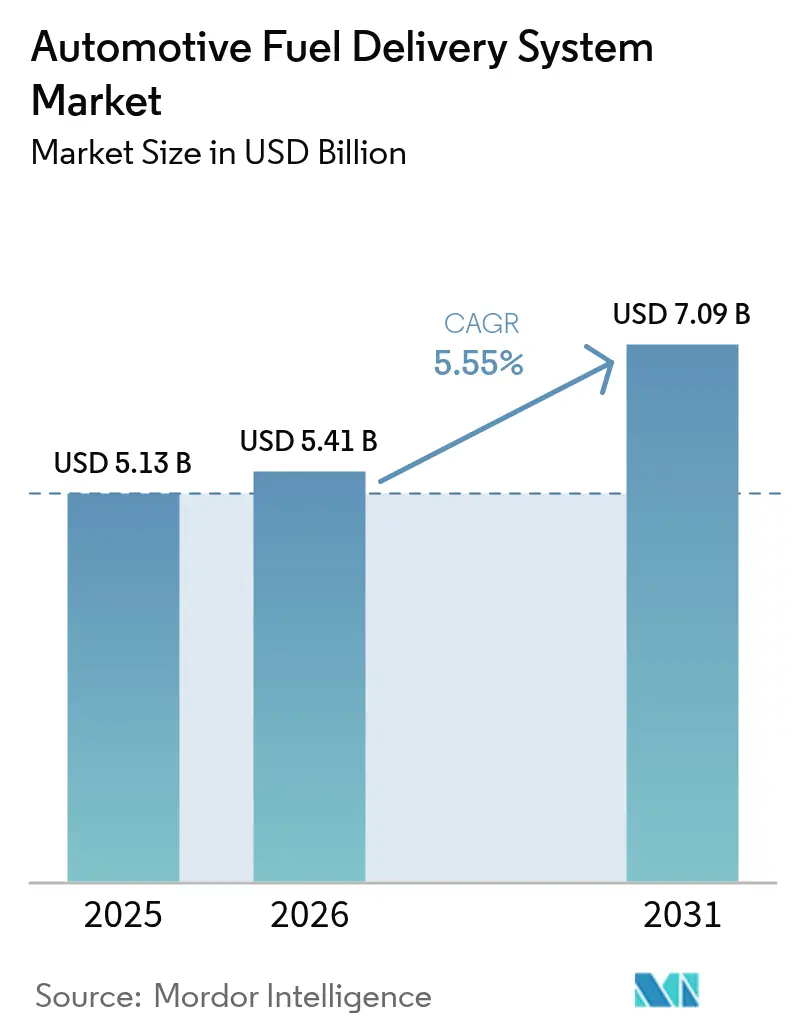
The automotive fuel delivery system market size was valued at USD 5.13 billion in 2025 and estimated to grow from USD 5.41 billion in 2026 to reach USD 7.09 billion by 2031, at a CAGR of 5.55% during the forecast period (2026-2031). The growth trajectory reflects the sector’s ability to meet tougher emission limits while staying relevant in an era of rising electrification. Euro 7 rules that apply from July 2025 and the EPA Phase 3 standards, effective 2027, are pushing automakers toward high-precision injection modules and corrosion-resistant lines, sustaining capital expenditure on modern internal-combustion (ICE) architectures. Suppliers adopt “technology-neutral” portfolios that keep ICE value streams alive yet prepare for plug-in and fuel-cell demand shifts, limiting downside risk for the automotive fuel delivery system market.
Key Report Takeaways
- By component, fuel pumps led with 37.22% of the automotive fuel delivery system market share in 2025; fuel injectors are projected to expand at 7.06% CAGR to 2031.
- By vehicle type, passenger cars dominated with 63.62% revenue of the automotive fuel delivery system market in 2025, while light commercial vehicles are poised for a 6.15% CAGR through 2031.
- By fuel type, gasoline systems accounted for 48.56% of the automotive fuel delivery system market size in 2025; hydrogen systems will climb at 12.01% CAGR over the same period.
- By delivery method, gasoline direct injection captured 45.78% revenue of the automotive fuel delivery system market and will grow fastest at 6.36% CAGR to 2031.
- By distribution channel, OEM (factory-fitted) fuel delivery systems led with 80.35% revenue of the automotive fuel delivery system market in 2025, while aftermarket (replacement) is poised for a 7.55% CAGR through 2031.
- By geography, Asia Pacific commanded 38.12% of the automotive fuel delivery system market 2025 sales and is forecast to register a 6.82% CAGR to 2031.
Note: Market size and forecast figures in this report are generated using Mordor Intelligence’s proprietary estimation framework, updated with the latest available data and insights as of 2026.
Global Automotive Fuel Delivery System Market Trends and Insights
Drivers Impact Analysis*
| Driver | ( ~ ) % Impact on CAGR Forecast | Geographic Relevance | Impact Timeline |
|---|---|---|---|
| Stringent Emission Norms Driving Advanced Modules | +1.8% | North America and EU, expanding to APAC | Long term (≥ 4 years) |
| Rising Global Vehicle Production and Parc Rejuvenation | +1.2% | Global (APAC focus) | Medium term (2-4 years) |
| Growing Demand for Gasoline Direct-Injection Engines | +1.1% | Global, led by developed markets | Medium term (2-4 years) |
| Increasing Sales of Light Commercial Vehicles | +0.7% | APAC core, MEA and South America spill-over | Long term (≥ 4 years) |
| Integration of Smart Diagnostics within Electric Fuel Pumps | +0.5% | North America and EU, gradual APAC adoption | Medium term (2-4 years) |
| Surge in Synthetic/Bio-fuel Blends requiring Corrosion-Resistant Lines | +0.4% | Global, early EU and select US adoption | Long term (≥ 4 years) |
| Source: Mordor Intelligence | |||
Stringent Emission Norms Driving Advanced Fuel-Delivery Modules
Euro 7 tightens particulate and NOx thresholds for all light-duty engines from November 2026, while EPA Phase 3 slashes NOx to 35 mg/hp-hr for heavy trucks in 2027 [1] “Impacts of Euro 7,” International Council on Clean Transportation, theicct.org. Automakers are therefore standardizing high-pressure pumps and gasoline particulate filters across global platforms. Durability requirements rise to 160,000 km, pushing suppliers to develop long-life injectors and corrosion-proof rails, factors that underpin the automotive fuel delivery system market through 2030.
Rising Global Vehicle Production and Parc Rejuvenation
Light-vehicle output rebounded in 2025, and replacement cycles shortened as average fleet age passed 12 years in Europe, reinforcing component demand for the automotive fuel delivery system market. Vehicle-makers localize plants in India, Indonesia, and Mexico, creating regional sourcing pull for tier-1 suppliers. Fleet operators refresh hardware to meet fuel-economy benchmarks, prolonging ICE relevance despite EV penetration.
Growing Demand for Gasoline Direct-Injection Engines in Passenger Cars
Direct injection equipped 73% of 2023 light-duty builds and now operates at idle pressures near 300 psi and peak loads above 2,200 psi [2] “Fact of the Week 1286: GDI Adoption,” U.S. Department of Energy, energy.gov . The architecture enables downsized turbo engines that satisfy U.S. CAFE targets, climbing 2% annually. Aftermarket opportunities broaden as OE warranties expire, helping the automotive fuel delivery system market retain service revenues beyond the initial sale.
Increasing Sales of Light Commercial Vehicles
Urbanization and e-commerce raise last-mile delivery mileage, and LCV fleets in Southeast Asia, Africa, and South America demand rugged, easily serviceable fuel hardware. Lower regulatory pressure on commercial NOx means ICE drivetrains persist longer than in passenger segments, buffering revenue for the automotive fuel delivery system market.
Restraints Impact Analysis*
| Restraint | ( ~ ) % Impact on CAGR Forecast | Geographic Relevance | Impact Timeline |
|---|---|---|---|
| Rapid Growth of Electric Vehicles Reducing ICE Share | -1.5% | China, EU, California | Long term (≥ 4 years) |
| Volatility in Raw-Material Prices | -0.8% | Global | Short term (≤ 2 years) |
| Tightening Evaporative-Emission Norms Raising System Cost | -0.6% | North America and EU, expanding globally | Medium term (2-4 years) |
| Semiconductor Shortages Disrupting Electronic Pump Controllers | -0.4% | Global, high-tech auto hubs | Short term (≤ 2 years) |
| Source: Mordor Intelligence | |||
Rapid Growth of Electric Vehicles Reducing ICE Share
China and California are accelerating toward full zero-emission mandates by 2035. EV momentum is cutting ICE-linked profit pools by an anticipated 50% this decade. Fuel pumps and injectors are absent from battery platforms, creating long-run headwinds, yet regional differences keep the automotive fuel delivery system market relevant in heavy-duty, rural, and developing-country segments.
Volatility in Raw-Material Prices for Fuel-System Components
Steel drifted between USD 800-1,000/ton in 2024 while copper surpassed USD 10,500/ton, compressing margins for fuel-system machining and stamping. Suppliers hedge through multi-year contracts and substitution, but smaller firms face liquidity strain, promoting mergers that could reshape the automotive fuel delivery system market.
*Our forecasts treat driver/restraint impacts as directional, not additive. The impact forecasts reflect baseline growth, mix effects, and variable interactions.
Segment Analysis
By Component: Fuel Pumps Lead, Injectors Accelerate
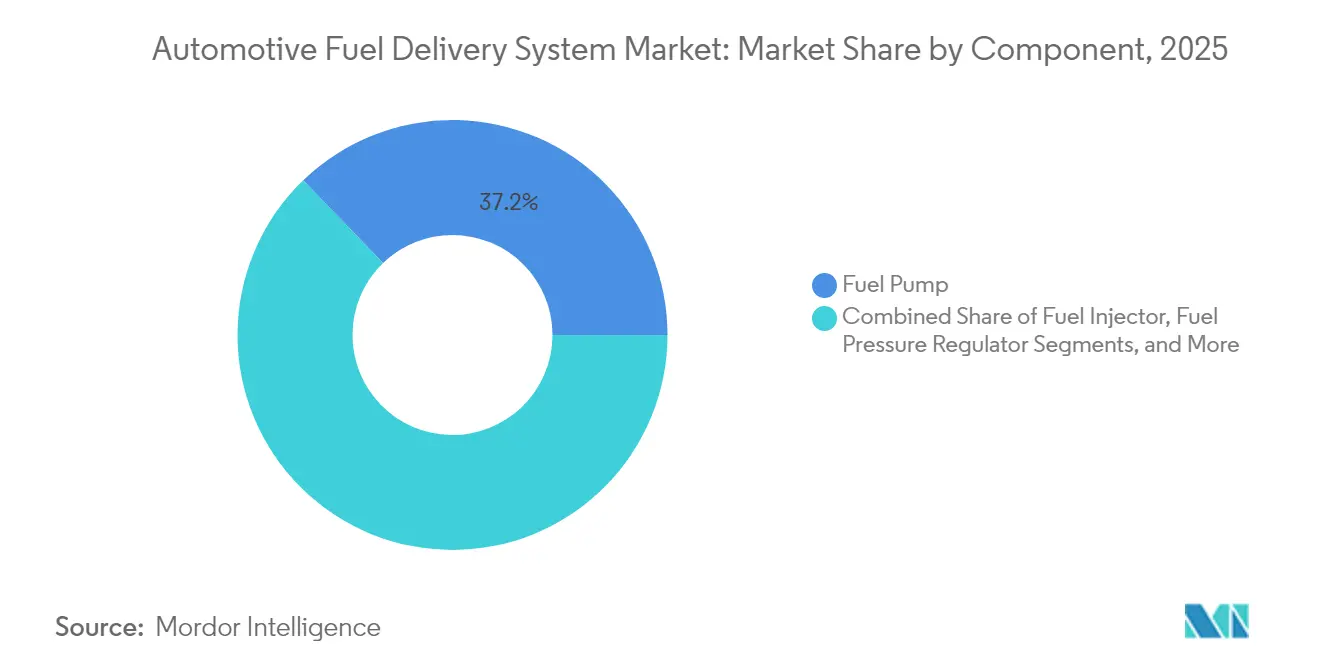
Fuel pumps generated 37.22% revenue of the automotive fuel delivery system market in 2025 and remain indispensable across all engine sizes, anchoring the automotive fuel delivery system market. Their ubiquity provides steady volumes even as electrification advances. Accelerating fastest, injectors will rise at 7.06% CAGR to 2031 on the back of 2,200 psi GDI requirements, pushing “smart” tip designs and stainless-steel rails for ethanol blends.Component upgrades now emphasize on-board diagnostics, remote pressure sensing, and over-the-air firmware that cuts unplanned downtime. Biofuel growth lifts demand for corrosion-resistant lines and filters, while vapor-recovery valves and tank-mounted sensors add incremental electronics value. Together, these shifts keep the automotive fuel delivery system market size for components on an upward curve despite future EV displacement threats.



By Vehicle Type: Passenger Cars Dominate, LCVs Drive Growth
Passenger cars delivered 63.62% of the automotive fuel delivery system market revenue in 2025. Hatchbacks and sedans require cost-efficient returnless pumps, whereas SUVs integrate higher-pressure rails because of increased torque loads. Light commercial vehicles, forecast at 6.15% CAGR, prefer robustness over efficiency, sustaining steel-braid hoses and replaceable filters, a pattern that enlarges the automotive fuel delivery system market share commanded by commercial platforms.Longer daily mileage and fleet telematics open retrofitting business, while medium and heavy trucks, though smaller in volume, retain high-flow diesel injection rails that stabilize volumes until battery densities permit long-haul substitution. As such, the automotive fuel delivery system market remains diversified across duty cycles.
By Fuel Type: Gasoline Leads, Hydrogen Surges
Gasoline represented 48.56% of the automotive fuel delivery system market's 2025 revenue, but hydrogen is staging the strongest advance at 12.01% CAGR. The push toward national hydrogen corridors beginning in 2027 will spur high-pressure storage and valve assemblies, lifting the automotive fuel delivery system market size for advanced materials.Diesel persists in European LCV fleets; flex-fuel systems flourish where E85 grants tax incentives. CNG/LPG retains fleet economics in South Asia and South America. This blend of traditional and emerging fuels ensures continued multipronged demand within the global automotive fuel delivery system market.
By Delivery Method: GDI Dominates and Accelerates
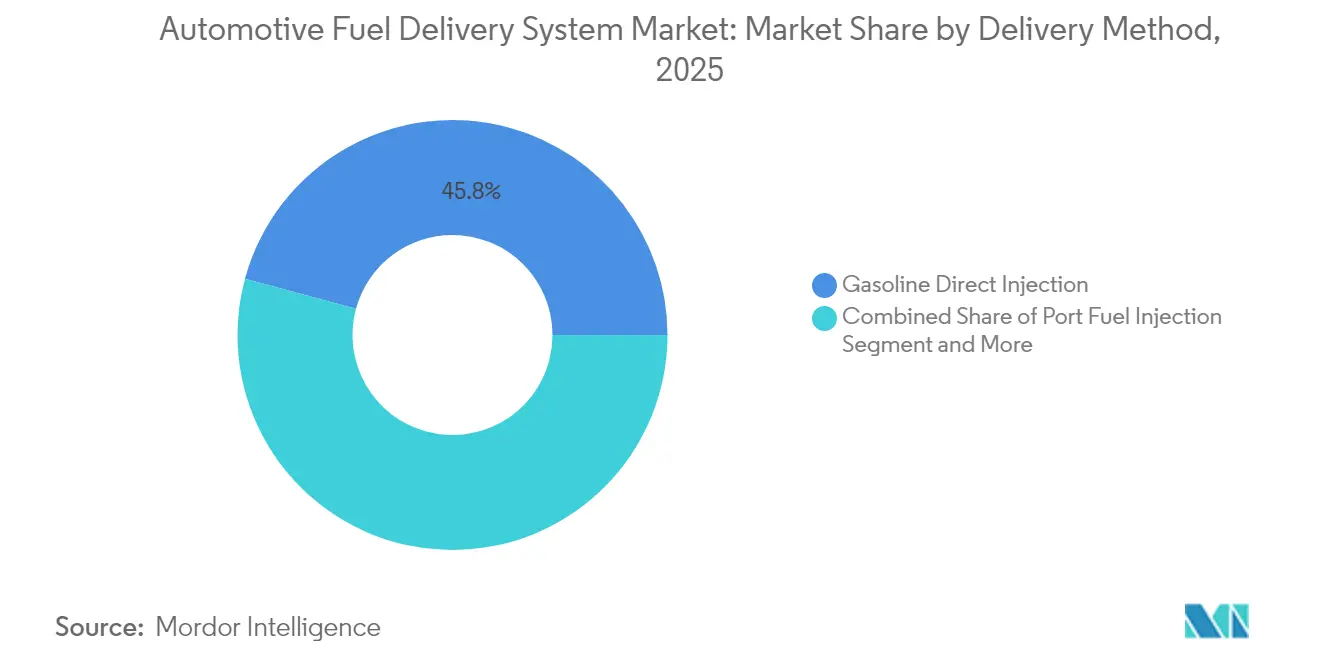
Gasoline Direct Injection (GDI) held 45.78% sales of the automotive fuel delivery system market in 2025, and will also be the fastest-expanding delivery method at 6.36% CAGR, showing dual leadership in the automotive fuel delivery system market. Increasing cylinder pressures enhance combustion but elevate particulate levels, driving upgrades in pump stiffness and multi-pulse injectors.Port injection stays viable for cost-sensitive entry cars, while common-rail diesel gains pressure refinements to meet EPA 2027 heavy-duty NOx cuts. Hybrid systems blending port and direct injection emerge to balance cost and compliance, supporting incremental pump and sensor shipments and widening the automotive fuel delivery system market footprint.
By Distribution Channel: OEM Dominance, Aftermarket Acceleration
Factory-installed lines delivered 80.35% of the automotive fuel delivery system market's 2025 revenue, reflecting tight integration with engine development. Yet the replacement segment will record a 7.55% CAGR as fleet age rises and digital commerce simplifies part sourcing. Continental’s 700-part expansion illustrates how brand-name suppliers are monetizing late-cycle demand, ensuring the automotive fuel delivery system market maintains a resilient tail of spares and upgrade kits.Cloud-enabled diagnostics feed predictive parts sales, while regional warehouse automation curtails lead times. Together, these moves position replacements as a durable earnings stream even when new-vehicle ICE output softens.
Geography Analysis
Asia Pacific captured 38.12% of the automotive fuel delivery system market's 2025 turnover and will outpace all other regions with a 6.82% CAGR to 2031, owing to China’s outsized production, India’s highway expansion, and ASEAN’s localized assembly clusters. Chinese OEMs are building fuel-system subsystems in Thailand and Indonesia to bypass tariffs and shorten logistics chains, strengthening the automotive fuel delivery system market across Southeast Asia. Semiconductor joint ventures in Japan also secure microcontroller flow for high-pressure pumps, buffering regional supply risk.
North America remains technology-rich, driven by EPA regulations that mandate 0.035 g/b-hp-hr NOx by 2027. Investments such as the USDA’s USD 26 million E15 infrastructure program expand biofuel uptake, creating niche demand for ethanol-ready rails and seals that enlarge the automotive fuel delivery system market. Mexico’s attractively priced labor and USMCA trade benefits encourage tier-1s to add capacity in Ramos Arizpe and Aguascalientes.
Europe faces the twin pressures of Euro 7 and accelerated carbon-neutrality pledges. OEMs are retrofitting particulate filters and vapor-containment hardware ahead of 2026, raising per-vehicle bill-of-materials but sustaining supplier order books. Eastern European plants offer lower costs for line assemblies, ensuring competitiveness even as Western European factories pivot to electric modules. Hydrogen corridor pilots from Spain to Germany are also giving the automotive fuel delivery system market an early foothold in fuel-cell applications.


Regulatory Landscape
In the European Union, Regulation (EU) 2024/1257 (Euro 7) updates type-approval and market-surveillance requirements and tightens evaporative-emissions performance for gasoline-fueled M1 and N1 vehicles (including a 1.5 g/test limit under the Euro 7 framework versus 2.0 g/test under Euro 6). The changes reinforce demand for improved vapor containment, seals, and canister-related fuel system interfaces. Separately, UN Regulation No. 83 (09 series of amendments) enters into force in September 2026, adding technical requirements around crankcase and low-temperature emissions and in-service conformity elements that link back to fuel metering stability and evaporative control robustness.
In the United States, EPA rulemaking activity in 2026 points to a more phased compliance path for light- and medium-duty criteria-pollutant programs, with a proposal to extend Tier 3 through MY 2027 and MY 2028 and shift the Tier 4 transition to MY 2029. For heavy-duty applications, refueling emissions requirements are implemented on a phase-in basis, moving from 40% of vehicles covered in MY 2026 and MY 2027 to 80% in MY 2028 and MY 2029, and reaching 100% in MY 2030. This creates a rolling schedule for OEM validation of refueling-related fuel system components.
Value Chain Analysis
The value chain runs from raw-material and chemical inputs (steel, aluminum, copper, polymers, elastomers) to precision machining and molding (pump housings, rails, regulators, quick-connects), then to electronic sub-assemblies (motor drives, pressure and temperature sensors, connectors), and finally to system integration and validation with OEM powertrain programs. Tier-1 suppliers typically assemble modules (in-tank pump units, high-pressure GDI/CRDI pumps, rails, and injector sets) for factory fitment at OEM plants, while aftermarket distribution is supported through regional warehouses and e-commerce-driven parts channels.
In 2026, supply-side fragility shows up in both component availability and operating utilities. Hyundai Motor Group reported production disruptions tied to an engine valve shortage after a supplier incident, illustrating how single-point failures can halt downstream vehicle output and shift demand timing for fuel-delivery modules. In India, SIAM flagged technical grade urea supply uncertainty affecting diesel fleet operations, and ACMA noted disruptions to energy-intensive processes (castings, forging, heat treatment) amid industrial gas and fuel shortages. At the same time, the chain is broadening toward alternative-fuel readiness through OEM and supplier collaborations, including Westport Fuel Systems and Volvo Group (via Cespira) advancing HPDI-based hydrogen-fueled engine commercialization work and multi-party pilots that validate renewable liquid fuels in existing vehicles.
Competitive Landscape
Incumbents- Bosch, Continental, and DENSO, hold multi-decade OE relationships, global footprints, and control of core patents. Bosch’s USD 1.9 billion silicon-carbide fab in Roseville, California, will secure high-temperature chips for smart pump controllers, reinforcing its edge in the automotive fuel delivery system market [3]“Bosch Invests in Roseville SiC Fab,”Robert Bosch GmbH, bosch.com. Continental is bundling cloud analytics with 700 new aftermarket pump SKUs, turning data services into margin enhancers.
Consolidation is accelerating: ABC Technologies bought TI Fluid Systems for USD 1.83 billion in April 2025 to form a vertically integrated fluid-handling specialist. Smaller firms such as Carter focus on racing-grade pumps, while Walbro courts power sports OEMs. New entrants from the IoT realm partner with pump makers to embed real-time diagnostics, adding software revenues atop mechanical volumes and reshaping value definitions within the automotive fuel delivery system market.
Patent filings cluster around high-pressure GDI valves, vapor recovery, and hydrogen leak detection. Suppliers that balance ICE optimization with e-powertrain bets are best positioned; those relying solely on legacy hardware face gradual erosion as EV shares climb.
Automotive Fuel Delivery System Industry Leaders
DENSO Corporation
Robert Bosch GmbH
Continental AG
Delphi Technologies (BorgWarner)
Hitachi Astemo Ltd.
- *Disclaimer: Major Players sorted in no particular order

Market Opportunities and Future Outlook
Compliance-driven hardware upgrades remain a key whitespace for suppliers that can reduce evaporative losses and improve refueling emission performance without adding excessive complexity. Euro 7 implementation, along with related type-approval and in-service conformity requirements, lifts the value of vapor management, corrosion-resistant lines and fittings, and diagnostic-capable modules. In parallel, US heavy-duty refueling standards phase in from MY 2026 toward full coverage by MY 2030, creating a multi-year retrofit and new-build cadence for refueling-related components across truck platforms.
Alternative-fuel ICE and hybrid architectures also open a second opportunity pocket around high-pressure injection, materials, and validation capability. In July 2026, Toyota Motor Europe, BMW Group, Bosch, and Repsol started a real-world pilot in Spain using 100% renewable gasoline (Nexa 95), supported by Bosch digital fuel tracking, demonstrating how fuel-delivery and monitoring technologies can support low-carbon liquid-fuel pathways in the existing vehicle parc. Hydrogen-capable fuel-system R&D is similarly moving toward commercialization in heavy-duty applications, supported by initiatives such as Westport and Volvo Group working on HPDI-based hydrogen engine development and OEM programs exploring hydrogen combustion. That direction increases demand for specialized injectors, sealing strategies, and leak-detection-oriented system design.
Recent Industry Developments
- July 2026: Robert Bosch GmbH, Toyota Motor Europe, BMW Group, and Repsol launched a six-month real-world pilot in Spain with vehicles running on 100% renewable gasoline (Nexa 95), supported by Bosch digital fuel tracking. The project puts measurement and verification tools alongside conventional liquid-fuel hardware, strengthening an upgrade pathway for fuel-delivery and sensing components in the existing ICE parc.
- April 2025: ABC Technologies completed the acquisition of TI Fluid Systems for about USD 1.83 billion, consolidating fuel-tank and fluid-handling capabilities under a single supplier group. The combination increases vertical integration across lines, connectors, and system assemblies, influencing sourcing leverage and platform-level supply agreements for OEM fuel systems.
- June 2024: DENSO Corporation expanded its European aftermarket offering by adding eight common-rail diesel injectors covering about 725,000 vehicles. The broadened catalog supports replacement demand as fleets age and keeps diesel injection service activity anchored in the aftermarket channel.


Research Methodology Framework and Report Scope
Market Definition and Coverage
For this methodology, the automotive fuel delivery system market covers the value of components that store, condition, and deliver fuel from the tank to the engine at the required pressure and flow, across passenger and commercial vehicles, and across major regions.
Scope exclusions: It excludes broader engine systems outside fuel supply (such as ignition, full powertrain assemblies, and vehicle exhaust aftertreatment).
Segmentation Overview
- By Component
- Fuel Pump
- Fuel Injector
- Fuel Rail
- Fuel Pressure Regulator
- Fuel Filter
- Fuel Line and Hoses
- Others
- By Vehicle Type
- Passenger Cars
- Hatchback
- Sedan
- Sports Car and Coupe
- SUV and Crossover
- Commercial Vehicles
- Light Commercial Vehicles (LCV)
- Medium and Heavy Commercial Vehicles (MCV and HCV)
- Passenger Cars
- By Fuel Type
- Gasoline
- Diesel
- Flex Fuel (E10-E85)
- CNG and LPG
- Biofuel and Synthetic Fuel
- Hydrogen
- By Delivery Method
- Port Fuel Injection
- Gasoline Direct Injection
- Returnless Fuel Systems
- Common-Rail Diesel Injection
- By Distribution Channel
- OEM (Factory-fitted)
- Aftermarket (Replacement)
- By Geography
- North America
- United States
- Canada
- Rest of North America
- South America
- Brazil
- Argentina
- Chile
- Rest of South America
- Europe
- Germany
- United Kingdom
- France
- Italy
- Spain
- Russia
- Rest of Europe
- Asia Pacific
- China
- Japan
- India
- South Korea
- Australia and New Zealand
- Rest of APAC
- Middle East and Africa
- Saudi Arabia
- UAE
- Turkey
- South Africa
- Nigeria
- Egypt
- Rest of Middle East and Africa
- North America
Data Sources, Market Sizing, and Validation
Desk Research
We start by building a clean fact base on vehicle production, parc direction, and emissions and fuel economy rules that influence injection and fuel pressure choices. Public sources used for these checks include OICA vehicle production statistics, U.S. EPA program documents, European Commission regulatory releases, and UNECE vehicle regulation updates.
To anchor the supply side, company annual reports, regulatory filings, investor presentations, and earnings call transcripts are reviewed to understand product mix and exposure to gasoline, diesel, and alternative fuels. We also use, where relevant, patent databases to track activity around direct injection, pumps, injectors, and modules, and an import/export shipment-level database is referenced selectively to sanity check cross-border component flows. The desk sources listed above are illustrative only, since many other sources were also used for data collection, validation, and research clarification.
Primary Interviews and Surveys
Next, we validate the model through expert interviews and structured surveys with OEM ecosystem participants, component manufacturers, distributors, and service channel stakeholders. This input helps confirm adoption curves for key fuel delivery technologies and how suppliers describe pricing behavior during OEM program transitions. Since this is a global market, inputs are balanced across key automotive production hubs and mature replacement markets, and then used to close gaps that desk research does not fully explain.
Distribution of primary research fieldwork respondents
| Company type | Respondent position | Region |
|---|---|---|
| Top tier: 31% | CXOs: 15% | APAC: 41% |
| Mid tier: 52% | Functional/Unit leaders: 34% | EMEA: 36% |
| Smaller Players: 17% | Managers: 51% | Americas: 23% |
Market-Sizing & Forecasting
Sizing is built using a top-down and bottom-up combined logic. We reconstruct vehicle production by region and powertrain mix first, then translate it into fuel system demand through technology penetration and per-vehicle content assumptions. Totals are corroborated with selective bottom-up approximations, including sampled ASP x fitted volume checks for pumps, injectors, rails, and modules, followed by channel conversations on OEM versus aftermarket splits.
Key inputs used in the model include global light and commercial vehicle production trends, gasoline versus diesel mix changes, direct injection penetration versus port injection, average system content per vehicle (especially for higher-pressure applications), and replacement demand signals tied to vehicle parc age. For forecasting, scenario analysis is used so shifts such as tighter emissions norms, changing electrification pace by region, and fuel type availability can be reflected without forcing a single straight-line outcome. Where supplier disclosures are incomplete, gaps are handled using proxy mix from comparable product lines and then validated through interview feedback before finalizing.
Data Validation & Update Cycle
Outputs are checked through triangulation against independent signals, including vehicle build numbers, technology penetration markers, and implied component spend per vehicle, and then variances are investigated until they can be explained. If a data point looks off, we recheck currency timing, unit conversions, and whether an adjacent category was accidentally included, then review the related assumption with another analyst before sign-off.
The report is refreshed annually, and interim updates are made when material events occur, such as major regulatory changes or sharp production swings. Before delivery, a final fresh pass is completed so clients receive the most current view that can be traced back to the model inputs and validation notes.
Mordor Intelligence's Automotive Fuel Delivery System Market Size Measured Against Other Published Estimates
Published market sizes for automotive fuel delivery systems often do not match because each study draws the coverage line differently and then uses its own demand proxy. Differences also come from what is counted as a fuel delivery component, how OEM and aftermarket values are treated, and how currency timing is handled across regions.
By tracking direct injection penetration, regional vehicle production, and periodic ASP refresh points, Mordor Intelligence keeps the 2026 value anchored to counted fuel delivery components, instead of mixing in adjacent engine electronics and control items that can lift totals.
Benchmark comparison
| Source | Market Size | Gaps in Research Methodology |
|---|---|---|
| Mordor Intelligence | USD 5.41 B (2026) | |
| Industry Publisher A | USD 4.13 B (2024) | Uses an earlier base year and a narrower component interpretation in parts of the scope, which can understate value when higher-pressure direct injection content rises later in the cycle. |
| Industry Publisher B | USD 1.62 B (2023) | Applies a tighter definition with partial subsystem counting and an earlier historical window, which can miss full system value across OEM fitment and replacement demand. |
The spread across sources is largely explained by year selection and what each estimate treats as in-scope for the fuel delivery system. Our approach stays consistent on what is counted, then uses production, penetration, and pricing checks to keep the final number repeatable and easier to audit.


Key Questions Answered in the Report
What is the current size of the automotive fuel delivery system market?
The market generated USD 5.41 billion in 2026 and is projected to reach USD 7.09 billion by 2031.
Which component category holds the largest market share?
Fuel pumps led with 37.22% of the automotive fuel delivery system market share in 2025 due to their universal role across all ICE platforms.
Why is gasoline direct injection growing so fast?
GDI supports tighter fuel-economy and emission targets, already present in 73% of 2023 builds, driving a 6.36% CAGR for related delivery modules through 2031.
Which region offers the strongest growth outlook?
Asia Pacific is forecast to register a 6.82% CAGR to 2031 on the back of robust vehicle output, supply-chain localization, and rising consumption.
Page last updated on:





