Automotive Aftermarket Market Size and Share
Market Overview
| Study Period | 2019 - 2030 |
|---|---|
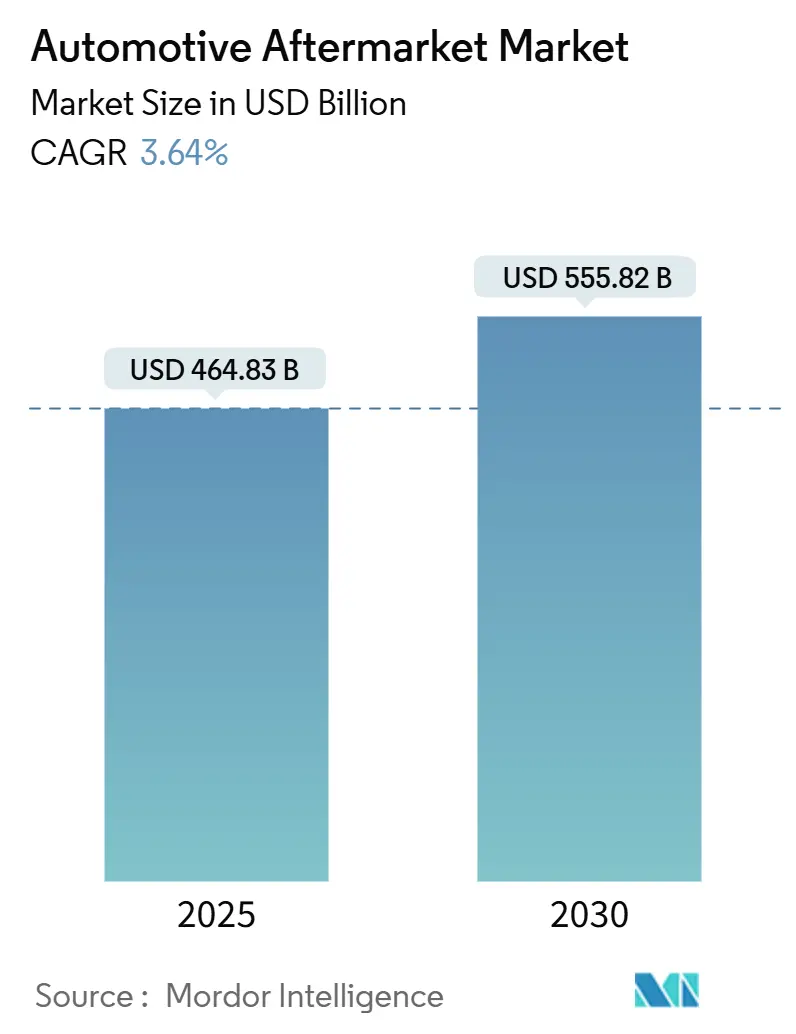
| Market Size (2025) | USD 464.83 Billion |
| Market Size (2030) | USD 555.82 Billion |
| Growth Rate (2025 - 2030) | 3.64% CAGR |
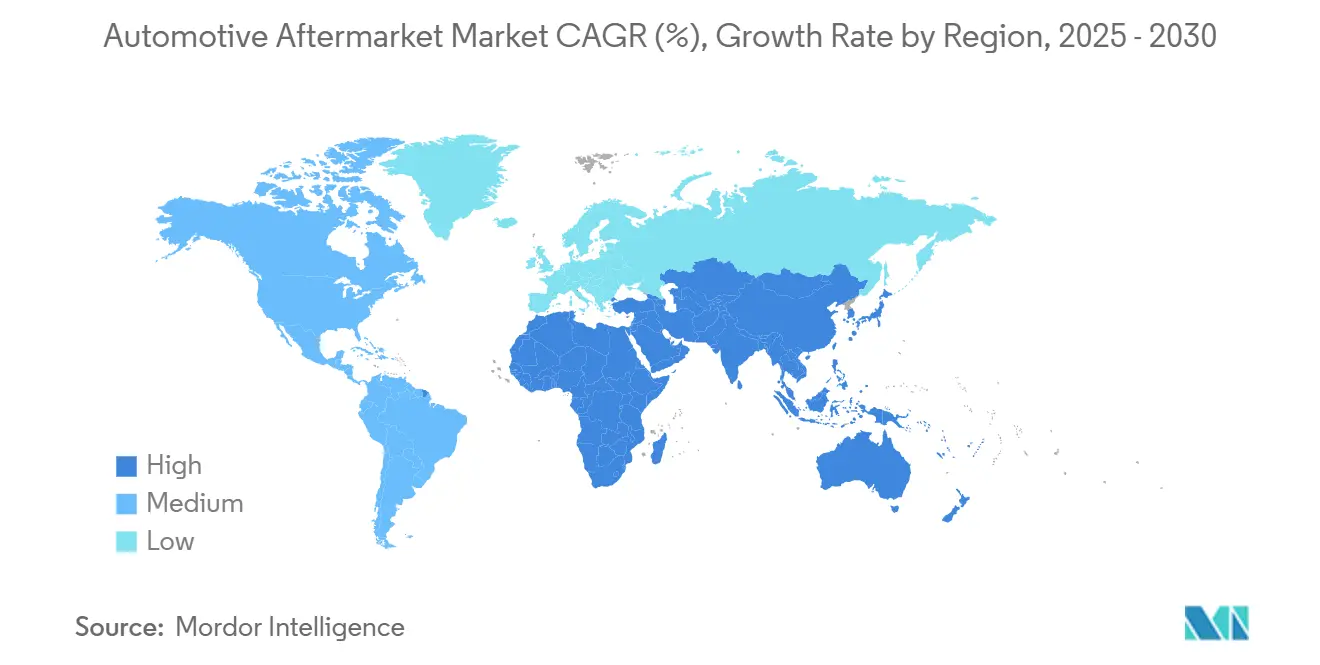
| Fastest Growing Market | Asia Pacific |
| Largest Market | Asia Pacific |
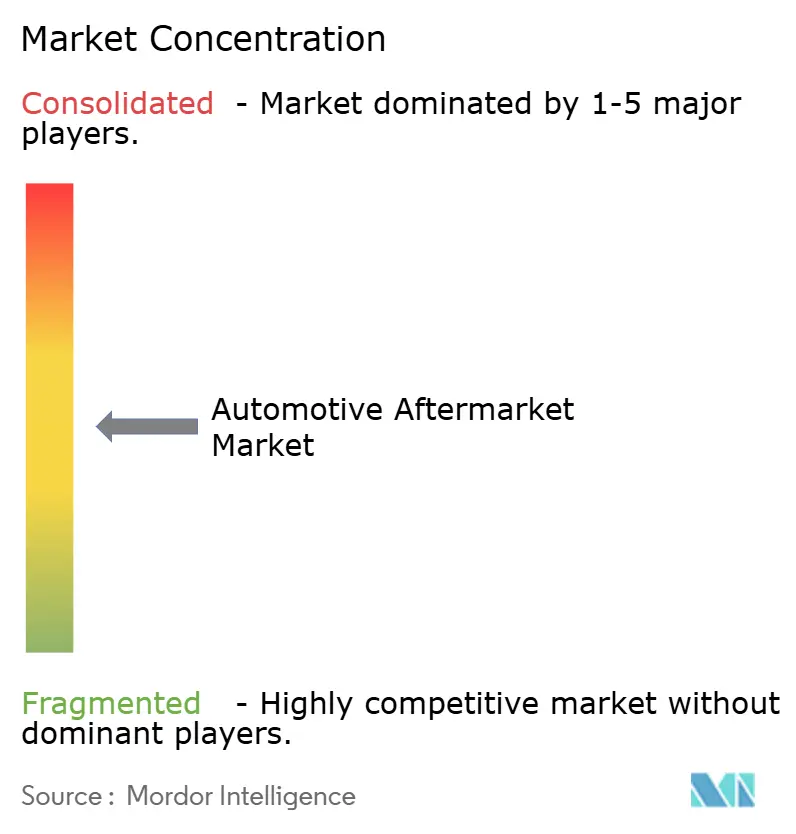
| Market Concentration | Medium |
Major Players *Disclaimer: Major Players sorted in no particular order Image © Mordor Intelligence. Reuse requires attribution under CC BY 4.0. | |
Automotive Aftermarket Market Analysis by Mordor Intelligence
The Automotive Aftermarket Market size is estimated at USD 464.83 billion in 2025, and is expected to reach USD 555.82 billion by 2030, at a CAGR of 3.64% during the forecast period (2025-2030). Solid replacement‐part demand from an aging global vehicle parc, fast-growing digital sales channels, and technology-driven service models underpin this momentum. Independent garages still capture the largest service share, yet fleet maintenance providers and online parts platforms are advancing the fastest as predictive analytics and e-procurement scale. Electrification and ADAS adoption compress some legacy revenue pools but simultaneously open specialized opportunities in battery, thermal, and sensor domains. Strategic consolidation, especially among tier-one suppliers and regional distributors, continues to reshape competitive intensity while circular-economy programs reinforce profit margins through certified remanufacturing.
Key Report Takeaways
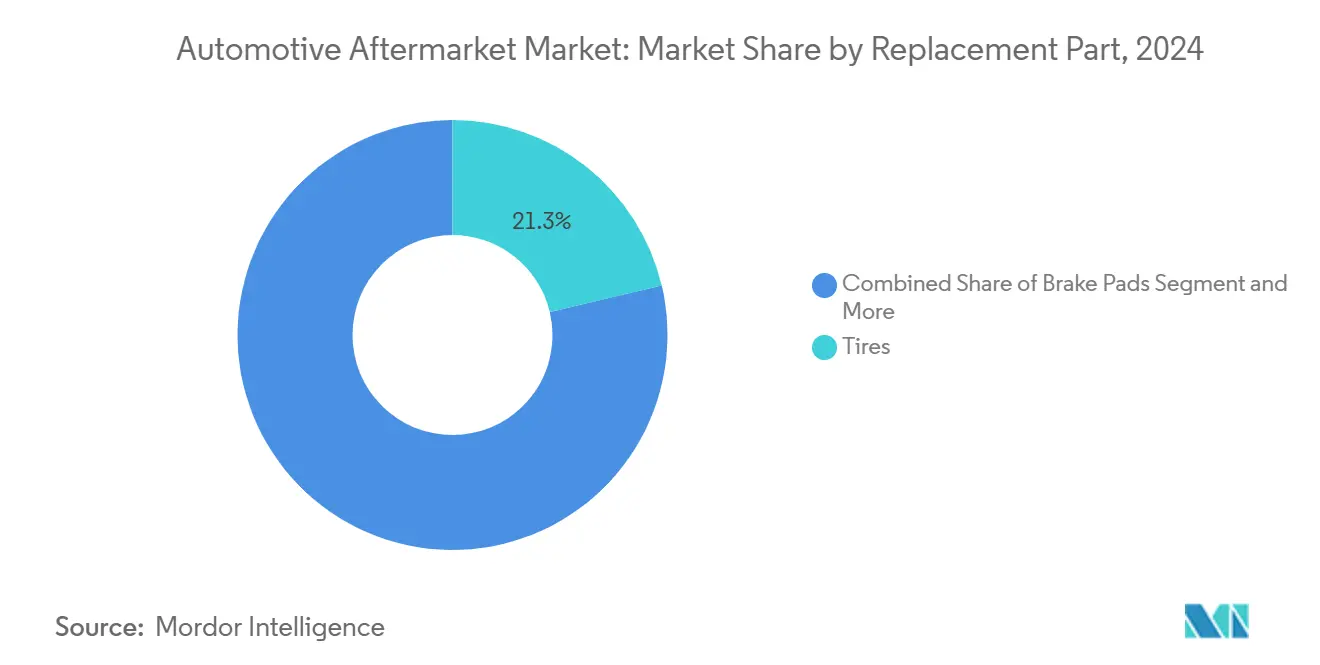
- By replacement part, tires led with a 21.27% of the automotive aftermarket market share in 2024, while electronics are projected to expand at a 3.67% CAGR through 2030.
- By service channel, independent garages held 43.42% of the automotive aftermarket market share in 2024; fleet maintenance providers record the highest projected CAGR at 3.76% through 2030.
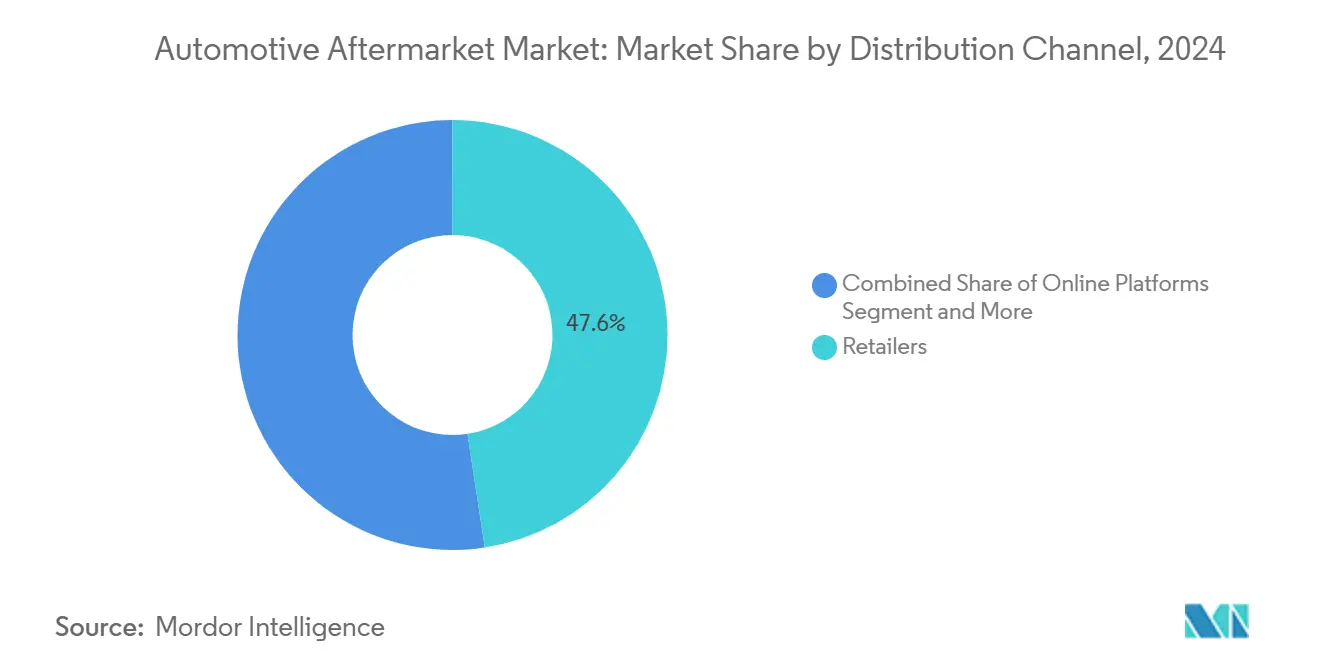
- By distribution channel, retailers captured 47.61% of the automotive aftermarket market share in 2024, yet online platforms are advancing at a 3.71% CAGR to 2030.
- By vehicle type, passenger cars commanded 51.25% of the automotive aftermarket market share in 2024, whereas two-wheelers are forecast to grow the quickest at a 3.73% CAGR through 2030.
- By geography, Asia-Pacific accounted for 37.71% of the automotive aftermarket market share in 2024 and is poised to grow at a 3.69% CAGR, the fastest among all regions.
Global Automotive Aftermarket Market Trends and Insights
Drivers Impact Analysis*
| Driver | (~) % Impact on CAGR Forecast | Geographic Relevance | Impact Timeline |
|---|---|---|---|
| Ageing Global Vehicle Parc | +1.2% | Global, with highest impact in North America and Europe | Long term (≥ 4 years) |
| Expansion Of E-Commerce | +0.8% | Global, led by Europe and North America | Medium term (2-4 years) |
| Rising VMT (Vehicle-Miles-Travelled) | +0.7% | Asia-Pacific core, spill-over to MEA | Medium term (2-4 years) |
| Fleet Adoption Of Predictive Maintenance Analytics | +0.5% | North America and EU, expanding to Asia Pacific | Short term (≤ 2 years) |
| Monetisation Of OEM Repair-Procedure Data | +0.3% | North America and EU regulatory focus | Long term (≥ 4 years) |
| Circular-Economy Demand | +0.2% | Europe leading, North America following | Long term (≥ 4 years) |
| Source: Mordor Intelligence | |||
Ageing Global Vehicle Parc Drives Sustained Aftermarket Demand
The average vehicle age reached 12.8 years in the United States in 2024, the highest on record, reflecting longer ownership cycles and improved mechanical durability[1]“Average Vehicle Age of U.S. Light Vehicles Reaches Record High 12.8 Years,” IHS Markit, ihsmarkit.com . Mature European fleets hover around 12 years as well, while Asia-Pacific’s rapidly expanding parc is set to age into service-intensive years during the forecast window. Older vehicles require more frequent tire, brake, and suspension replacements, holding the automotive aftermarket market on a stable growth trajectory. Independent garages benefit from out-of-warranty repairs, and parts suppliers gain predictable demand visibility. Government stimulus programs to keep older vehicles roadworthy in developing economies further reinforce replacement-part pull.
E-Commerce Transformation Reshapes Distribution Economics
Online platforms accelerate share gains by combining SKU breadth, real-time inventory visibility, and transparent pricing that traditional wholesalers struggle to match. In Europe, e-commerce penetration across DIY channels is expected to rise exponentially by 2035[2]“Digital Aftermarket Outlook 2035,” CLEPA, clepa.eu . Workshop e-procurement will exceed three-fifths adoption in the same horizon, driving omnichannel fulfillment requirements. Digital marketplaces exploit data-driven recommendation engines to improve part-number accuracy, lowering return rates and elevating customer satisfaction. For suppliers, direct-to-consumer storefronts compress distributor margins yet unlock richer customer insights and upsell opportunities. Physical retailers respond by enhancing click-and-collect services and deploying advanced parts-lookup kiosks.
Rising Vehicle-Miles-Travelled in Emerging Economies Bolsters Parts Demand
Greater economic activity and improving road infrastructure across India, Indonesia, and Vietnam propel annual vehicle miles traveled. India’s mobility sector is forecast to double by 2030, with vehicle ownership expanding by a huge margin over 24 years. Higher utilization accelerates wear on tires, filters, and suspension components, pushing steady orders through wholesale and retail channels. Intensifying logistics flows in Southeast Asia further amplify demand for commercial vehicle maintenance services. Regional governments promoting road safety inspections indirectly support periodic replacement cycles, sustaining an incremental tailwind.
Fleet Digitalization Enables Predictive Maintenance Revenue Streams
Telematics devices now relay real-time engine, brake, and battery health data, letting fleets execute condition-based service plans rather than miles-based intervals. Predictive maintenance reduces unplanned downtime by as much as two-fifths, saving fleets USD 2,000-3,000 per truck annually[3]“Predictive Maintenance ROI for Commercial Fleets,” Geotab, geotab.com . Aftermarket providers monetize subscription dashboards, sell sensor packs, and deliver just-in-time parts kits, anchoring higher-margin revenue. The model drives at a robust CAGR forecast for fleet maintenance providers, who bundle analytics with nationwide workshop networks. Parts producers benefit as data pinpoints exact replacement timing, smoothing production cycles and lowering inventory buffers.
Restraints Impact Analysis*
| Restraint | (~) % Impact on CAGR Forecast | Geographic Relevance | Impact Timeline |
|---|---|---|---|
| Proliferation Of Counterfeit Parts And Quality Concerns | -0.6% | Global, with highest impact in emerging markets | Medium term (2-4 years) |
| EV Power-Train Shift | -0.4% | Europe and China leading, North America following | Long term (≥ 4 years) |
| OEMs' Direct‐To-Consumer Parts Subscriptions | -0.3% | North America and Europe focus | Medium term (2-4 years) |
| ADAS-Driven Decline In Collision Frequencies | -0.2% | North America and Europe, expanding globally | Long term (≥ 4 years) |
| Source: Mordor Intelligence | |||
Counterfeit Parts Proliferation Threatens Market Integrity
U.S. Customs and Border Protection recorded a rise in counterfeit automotive seizures, with brake pads and airbags dominating recent confiscations. Low-quality fakes jeopardize vehicle safety, increase liability risk for independent garages, and erode consumer trust. Online marketplaces struggle to police third-party listings, letting counterfeiters infiltrate legitimate platforms. Regulatory agencies tighten penalties, yet enforcement gaps persist in price-sensitive regions. Brands respond with QR-code authentication labels and blockchain-based traceability to reassure buyers and protect revenue.
EV Power-Train Shift Reduces Wear Components
With no oil changes and fewer moving parts, EVs curtail repeat service visits that historically sustained workshop revenue. Continental estimates 35 fewer serviceable parts per vehicle, slashing traditional replacement cycles. While high-voltage component failure can be costly, event frequency remains low, leading to elongated service intervals. Workshops must upskill technicians and invest in insulated tooling, elevating cost structures before new revenue streams mature. Over the next decade, the conversion of additional passenger-car share to battery propulsion will gradually drag on the overall automotive aftermarket market growth rate.
*Our forecasts treat driver/restraint impacts as directional, not additive. The impact forecasts reflect baseline growth, mix effects, and variable interactions.
Segment Analysis
By Replacement Part: Electronics Drive Technology Integration
By replacement part, the tires segment accounted for the largest allocation of the automotive aftermarket market size in 2024, with a 21.27% share, and electronics advancing at a 3.67% CAGR. Electronics growth reflects telematics control units, parking cameras, and sensor retrofits that align with rising connectivity expectations. Circular-economy programs accelerate remanufactured ECU uptake, offering three-fifths cost savings and up to four-fifths CO₂ reductions.
Aging ICE fleets keep spark-plug and filter demand stable, yet lithium-ion battery pack replacement and thermal management loops emerge as premium ticket jobs. Regulatory frameworks such as WEEE and ISO 14001 boost scrap-part recovery, underscoring sustainability’s strategic importance. Substantial SKU complexity in electronics prompts distributors to refine inventory analytics, curbing obsolescence risk and improving fill rates. Component miniaturization and modular design simplify field replacement, encouraging do-it-yourself enthusiasts to upgrade infotainment displays and driver-assistance kits, feeding online sales channels.


By Service Channel: Independent Garages Face Digital Transformation Pressure
Independent garages captured the largest automotive aftermarket market share at 43.42% in 2024, reinforcing their enduring relevance for out-of-warranty vehicles. Cost-competitive labor rates, community reputation, and flexible parts sourcing underpin this position. Yet, the 3.76% CAGR outlook for fleet maintenance providers reveals how data-driven service contracts are tilting growth toward enterprise accounts. Subscription analytics let fleet workshops predict brake or tire failures one week ahead, translating into superior uptime and loyalty.
Independent operators increasingly adopt cloud-based management systems to compete, integrating parts catalogs, repair-time standards, and mobile payment options. National franchising models are also gaining traction, bringing standardized branding and training to mom-and-pop workshops. Meanwhile, OEM-authorized centers rely on proprietary repair-procedure data under right-to-repair mandates to maintain a technical edge. The net effect is a gradual convergence of service quality, forcing differentiation through customer experience and warranty terms rather than pure technical access.
By Distribution Channel: Online Platforms Accelerate Market Share Gains
Retail stores still controlled 47.61% of the automotive aftermarket market share in 2024, but online platforms' 3.71% CAGR forecast signals a channel power shift. Digital players use AI search filters and VIN-based lookup tools to slash mis-ordering rates below 3%, half the brick-and-mortar average. Lower return logistics and higher inventory turn drive attractive unit economics that lure new entrants into the automotive aftermarket market.
Traditional wholesalers are not standing still; many now hybridize operations with click-and-collect lockers and same-day van delivery for workshops. Marketplace sellers, however, face intensifying counterfeit monitoring obligations that elevate compliance overhead. OEMs experiment with direct-to-consumer portals offering subscription consumables and accessory bundles, disintermediating incumbent distributors. Competitive advantage will increasingly flow to those who own deep customer data and last-mile logistics capabilities rather than pure inventory breadth.
By Vehicle Type: Two-Wheelers Capitalize on Emerging Market Growth
Passenger cars represented 51.25% of the automotive aftermarket market share in 2024, but two-wheelers will post the highest 3.73% CAGR to 2030, supported by Southeast Asia’s urban mobility patterns. High-replacement components such as chain sprockets, clutch plates, and brake shoes drive recurring spend. The global motorcycle chain sprocket aftermarket alone is projected to grow exponentially by 2034.
In contrast, light commercial vehicle maintenance sees steadier trajectories tightly linked to e-commerce logistics growth that extends vehicle utilization hours. Electrification remains minimal in two-wheelers outside China, preserving ICE service revenue. Customization culture also fuels performance exhausts and cosmetic accessory sales through online channels. As disposable incomes climb, riders increasingly opt for premium synthetic lubricants and branded safety gear, lifting average basket values and brand loyalty.
Geography Analysis
Asia-Pacific commanded the most significant slice of the automotive aftermarket market in 2024 at 37.71% and is expected to grow at a 3.69% CAGR. China’s strong EV sales penetration expands high-voltage parts demand, while India’s vehicle fleet surge adds sizable conventional maintenance volume. Government scrappage schemes and right-to-repair debates will further shape regional workflows.
North America remains a technology vanguard, with ADAS calibration and remanufactured electronics gaining traction amid a 12.8-year average vehicle age. Right-to-repair laws in the United States boost independent workshop access to OEM data, protecting competition. Canada’s harsh climate extends demand for winter tires and underbody rust-proofing products, adding seasonality to parts sales.
Europe balances regulatory stringency and environmental priorities, driving certified remanufacturing adoption under ISO 14001 and WEEE. EV share growth limits oil-filter volumes but unlocks battery thermal management retrofits. Eastern European aftermarket hubs attract contract manufacturing for cost optimization, positioning the bloc as both a consumption and supply region. The Middle East, Africa, and Latin America trail in digital penetration but show upside through fleet investment tied to mining, construction, and cross-border logistics upgrades.

Competitive Landscape
The automotive aftermarket market exhibits moderate fragmentation; the top five suppliers capture notable cumulative revenue. Major tire producers such as Bridgestone, Michelin, and Goodyear dominate their niche, whereas the electronics, filtration, and brake segments have a wider array of regional specialists.
Recent consolidation underscores a scale-seeking agenda. Tata AutoComp’s 2025 purchase of Artifex Interior Systems expands its European plastics footprint. Huaxiang’s takeover of IAC China assets in 2024 strengthens vertical integration in cockpit modules. These moves allow acquirers to negotiate better raw-material contracts and accelerate platform-wide technology diffusion.
Digital capabilities separate performance leaders. Continental, DENSO, and ZF embed cloud analytics into aftermarket diagnostics, providing over-the-air updates and predictive service alerts. Remanufacturing programs now cover ECUs, alternators, and turbochargers, slashing emissions up to four-fifths while boosting gross margins. Sustainability credentials are becoming bid qualifiers for fleet tenders and insurance-linked repair networks, reinforcing the competitive relevance of circular-economy investments.
Automotive Aftermarket Industry Leaders
AutoZone Inc.
O’Reilly Automotive
Genuine Parts (NAPA)
Advance Auto Parts
LKQ Corporation
- *Disclaimer: Major Players sorted in no particular order

Recent Industry Developments
- March 2025: Tata AutoComp Systems acquired an 80% stake in Artifex Interior Systems for GBP 77 million (USD 96.3 million), adding plastic molding and lamination capabilities for luxury OEM platforms.
- March 2025: Central Trading Company partnered with NEXUS Automotive International to build aftermarket distribution services in the UAE, leveraging NEXUS’s global parts network.
- July 2024: Impel purchased customer-engagement vendor Outsell in a transaction exceeding USD 100 million, augmenting digital CRM solutions for dealership and service-lane operators.


Global Automotive Aftermarket Market Report Scope
| Tires |
| Batteries |
| Brake Pads |
| Filters (Air, Oil, Cabin) |
| Lighting Components |
| Gaskets & Seals |
| Body Parts |
| Electronics |
| Others |
| OE / Authorized Service Centers |
| Independent Garages |
| Fleet Maintenance Providers |
| Others |
| Retailers |
| Wholesalers & Distributors |
| Online Platforms |
| Two-Wheelers |
| Passenger Cars |
| Light Commercial Vehicles |
| Heavy Commercial Vehicles |
| Off-Highway Vehicles |
| North America | United States |
| Canada | |
| Rest of North America | |
| South America | Brazil |
| Argentina | |
| Rest of South America | |
| Europe | United Kingdom |
| Germany | |
| Spain | |
| Italy | |
| France | |
| Russia | |
| Rest of Europe | |
| Asia-Pacific | India |
| China | |
| Japan | |
| South Korea | |
| Rest of Asia-Pacific | |
| Middle East and Africa | United Arab Emirates |
| Saudi Arabia | |
| Turkey | |
| Egypt | |
| South Africa | |
| Rest of Middle East and Africa |
| By Replacement Part | Tires | |
| Batteries | ||
| Brake Pads | ||
| Filters (Air, Oil, Cabin) | ||
| Lighting Components | ||
| Gaskets & Seals | ||
| Body Parts | ||
| Electronics | ||
| Others | ||
| By Service Channel | OE / Authorized Service Centers | |
| Independent Garages | ||
| Fleet Maintenance Providers | ||
| Others | ||
| By Distribution Channel | Retailers | |
| Wholesalers & Distributors | ||
| Online Platforms | ||
| By Vehicle Type | Two-Wheelers | |
| Passenger Cars | ||
| Light Commercial Vehicles | ||
| Heavy Commercial Vehicles | ||
| Off-Highway Vehicles | ||
| By Geography | North America | United States |
| Canada | ||
| Rest of North America | ||
| South America | Brazil | |
| Argentina | ||
| Rest of South America | ||
| Europe | United Kingdom | |
| Germany | ||
| Spain | ||
| Italy | ||
| France | ||
| Russia | ||
| Rest of Europe | ||
| Asia-Pacific | India | |
| China | ||
| Japan | ||
| South Korea | ||
| Rest of Asia-Pacific | ||
| Middle East and Africa | United Arab Emirates | |
| Saudi Arabia | ||
| Turkey | ||
| Egypt | ||
| South Africa | ||
| Rest of Middle East and Africa | ||


Key Questions Answered in the Report
What is the current global value of the automotive aftermarket?
The automotive aftermarket market size reached USD 464.83 billion in 2025 and is projected to hit USD 555.82 billion by 2030.
Which region leads aftermarket revenue?
Asia-Pacific held 37.71% of 2024 revenue and shows the fastest 3.69% CAGR outlook.
Which replacement part category grows fastest?
Electronics' top growth is at a 3.67% CAGR thanks to rising connectivity and sensor retrofits.
How are online sales channels performing?
Online platforms are advancing at a 3.71% CAGR, eroding traditional wholesaler share through 2030.
What impact do EVs have on service demand?
EV powertrains remove many routine wear parts, potentially trimming 30-40% lifetime service revenue per vehicle, though they create high-voltage component opportunities.
Which service channel shows the highest growth?
Fleet maintenance providers are expanding at a 3.76% CAGR as predictive analytics adoption accelerates.
Page last updated on:


