E-commerce Automotive Aftermarket Market Size and Share
Market Overview
| Study Period | 2019 - 2031 |
|---|---|
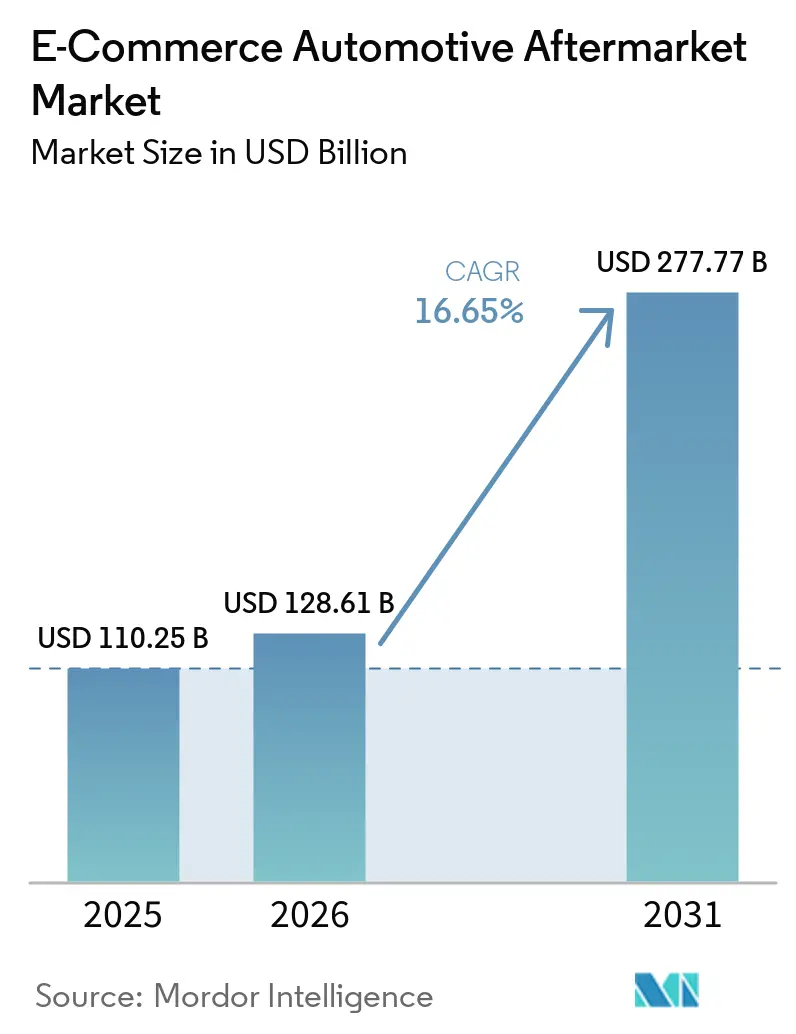
| Market Size (2026) | USD 128.61 Billion |
| Market Size (2031) | USD 277.77 Billion |
| Growth Rate (2026 - 2031) | 16.65% CAGR |
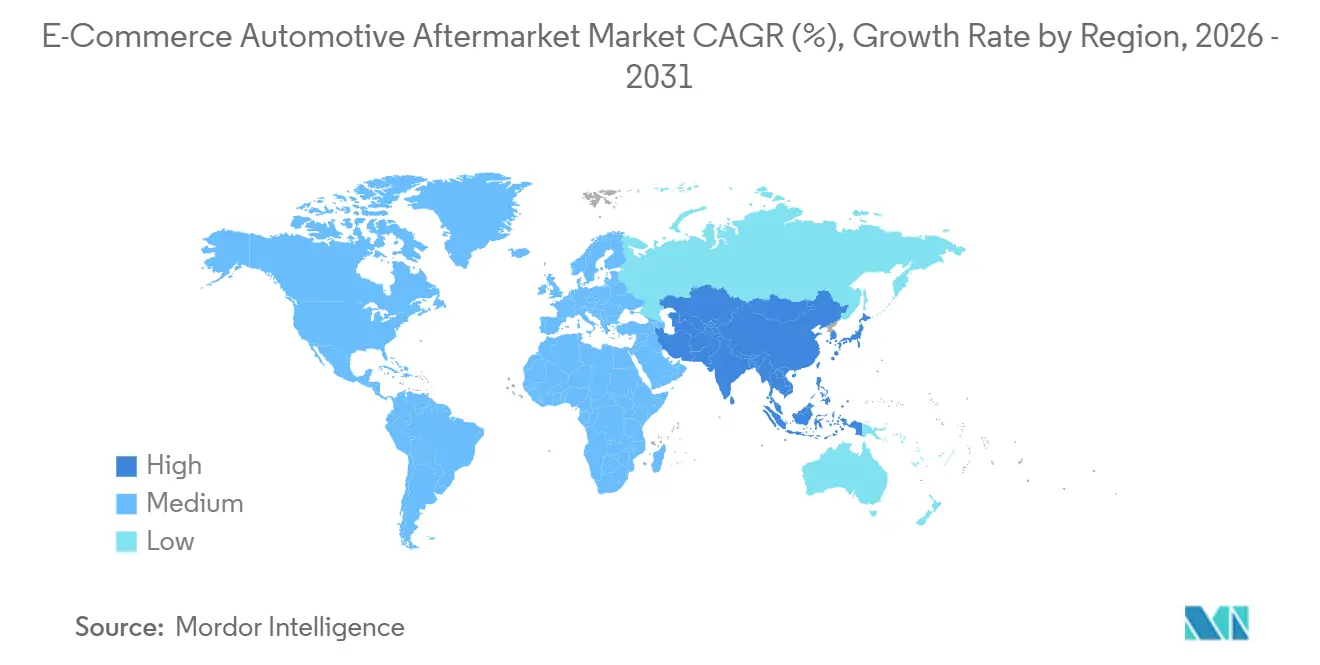
| Fastest Growing Market | Asia Pacific |
| Largest Market | North America |
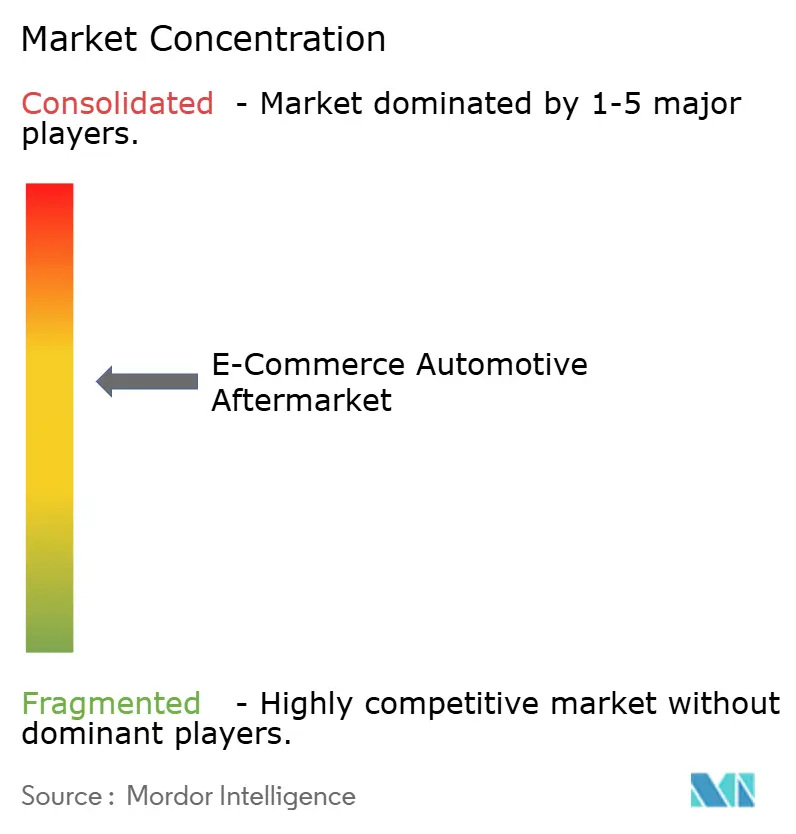
| Market Concentration | Medium |
Major Players *Disclaimer: Major Players sorted in no particular order Image © Mordor Intelligence. Reuse requires attribution under CC BY 4.0. | |
E-commerce Automotive Aftermarket Market Analysis by Mordor Intelligence
The E-commerce Automotive Aftermarket Market size is expected to increase from USD 110.25 billion in 2025 to USD 128.61 billion in 2026 to USD 277.77 billion by 2031, growing at a CAGR of 16.65% over 2026-2031. Demand is accelerating as aging vehicle fleets push replacement parts online, smartphone penetration shortens the research-to-checkout cycle, and same-day logistics networks erode the speed advantage of brick-and-mortar outlets. Original-equipment manufacturers (OEMs) now sell genuine components directly to drivers, compressing distributor margins and forcing independents to compete on artificial-intelligence fitment accuracy, warehouse proximity, and trusted brand partnerships. Electronic components are the fastest-expanding category because advanced driver-assistance systems, infotainment upgrades, and powertrain electrification multiply sensor, camera, and wiring-harness requirements. Counterfeit parts risk and global semiconductor constraints remain structural headwinds, yet investment in blockchain authentication and diversified chip sourcing is partially offsetting these pressures.
Key Report Takeaways
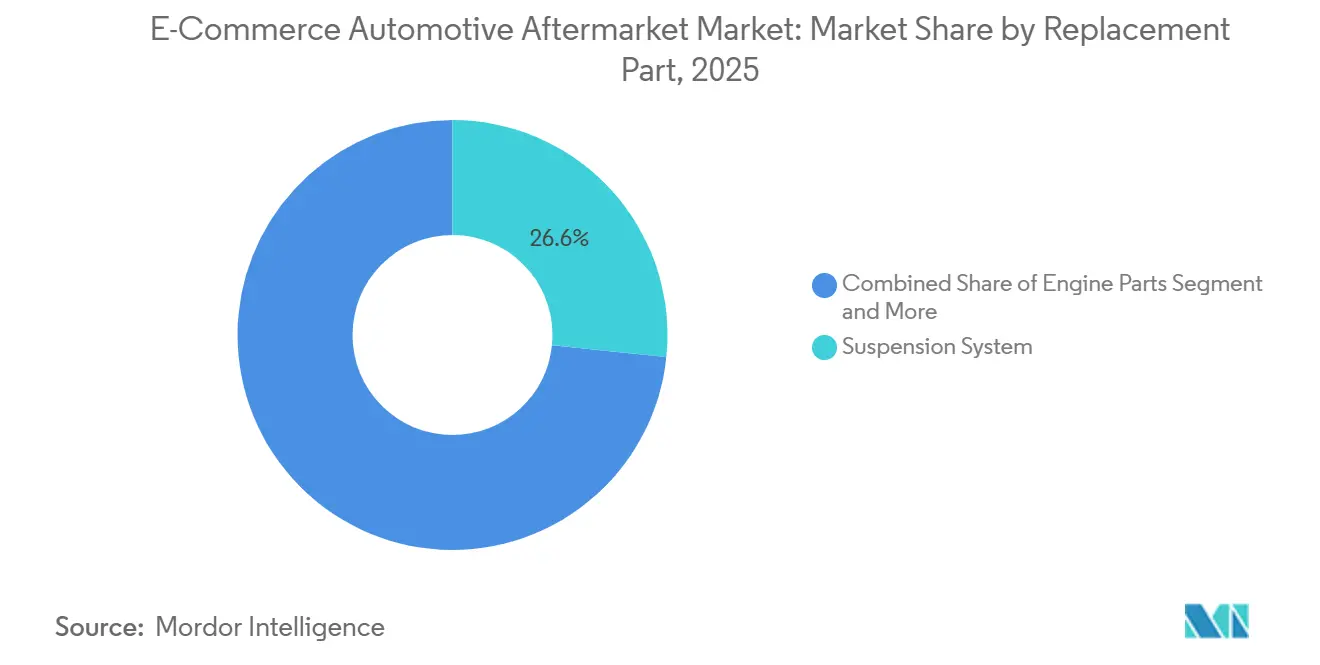
- By replacement part, suspension systems held 26.64% of the E-commerce Automotive Aftermarket Market share in 2025, while electrical components are projected to expand at a 17.66% CAGR through 2031.
- By sales channel, business-to-consumer transactions accounted for 66.59% of 2025 revenue, and business-to-business is forecast to grow at a 22.70% CAGR between 2026 and 2031.
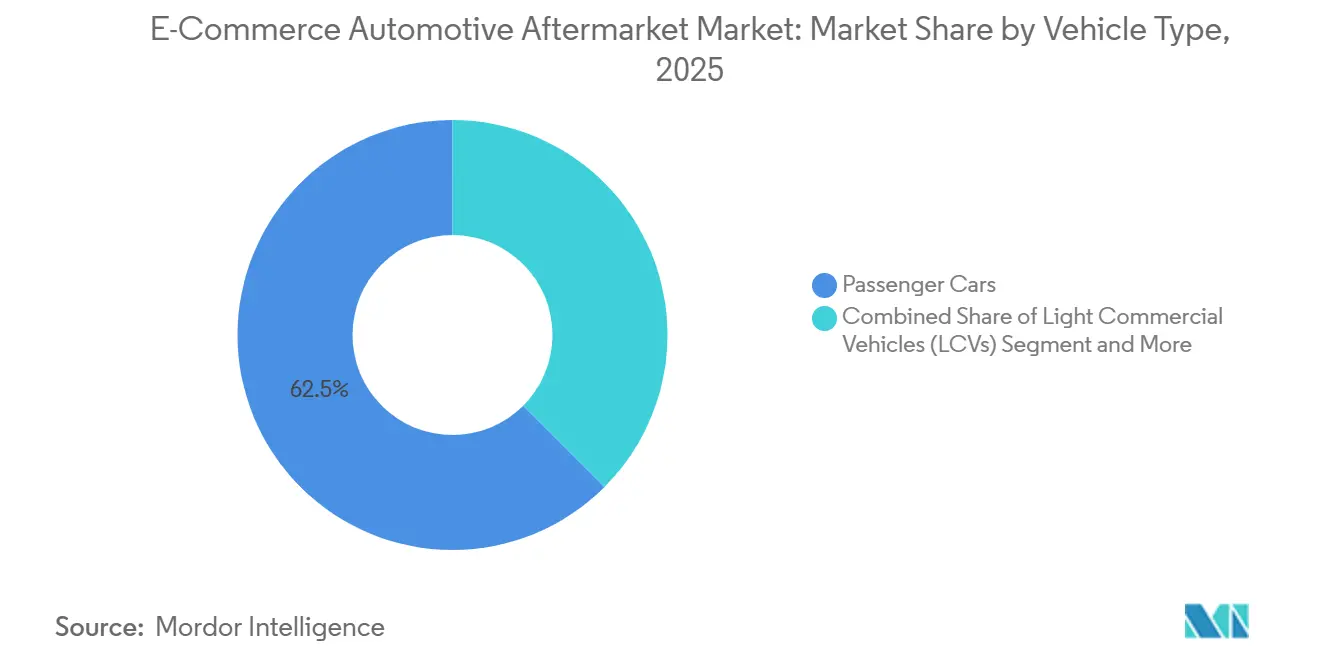
- By vehicle type, passenger cars accounted for 62.49% of 2025 revenue and are advancing at a 29.17% CAGR through 2031.
- By propulsion, internal-combustion vehicles dominated with 84.01% of 2025 revenue, whereas electric vehicles are set to grow at a 25.10% CAGR over the forecast period.
- By region, North America accounted for 38.45% of 2025 revenue, and Asia-Pacific is projected to register the fastest expansion at a 24.70% CAGR through 2031.
Note: Market size and forecast figures in this report are generated using Mordor Intelligence’s proprietary estimation framework, updated with the latest available data and insights as of January 2026.
Global E-commerce Automotive Aftermarket Market Trends and Insights
Drivers Impact Analysis*
| Driver | (~) % Impact on CAGR Forecast | Geographic Relevance | Impact Timeline |
|---|---|---|---|
| Rising Average Vehicle Age | +3.2% | Global, with concentration in North America and Europe | Long term (≥ 4 years) |
| Smartphone And Internet Penetration | +2.8% | Asia-Pacific core, spill-over to South America and Africa | Medium term (2-4 years) |
| Last-Mile Logistics and Same-Day Delivery | +2.1% | North America and EU, expanding to urban Asia-Pacific | Short term (≤ 2 years) |
| OEM-Managed E-commerce Channels | +1.9% | Global, led by premium brands in developed markets | Medium term (2-4 years) |
| AI-Powered Parts-Fitment | +1.6% | North America and Europe, early adoption in China | Short term (≤ 2 years) |
| Subscription-Based Replenishment Models | +1.4% | North America and Europe, commercial fleet focus | Long term (≥ 4 years) |
| Source: Mordor Intelligence | |||
Rising Average Vehicle Age Boosts Replacement Part Demand
The average United States vehicle age reached 12.8 years in 2025, with 85% of cars older than four years, a pattern replicated across developed markets. This structural aging drives more frequent maintenance cycles and higher-ticket repairs, channeling incremental demand toward digital retailers that offer deep catalogs and transparent pricing. Online search algorithms ease sourcing for complex components, giving e-commerce a decisive edge over brick-and-mortar stores. Economic pressure to keep vehicles longer instead of purchasing new models further magnifies this long-run tailwind for the E-commerce Automotive Aftermarket Market.[1]“AutoNation Expands Footprint with the Acquisition of Two Stores in Colorado,” AutoNation, Inc., AutoNation.com
Rapid Smartphone and Internet Penetration Accelerates Online Purchases
South America has achieved significant internet penetration and a large base of e-commerce users, supported by instant-payment systems such as Brazil’s Pix. In India, electric vehicle registrations have grown substantially, and mobile-first platforms with local-language support are simplifying the process for first-time buyers. Social-commerce features on WhatsApp and WeChat are fostering group buying. Additionally, DIY enthusiasts are increasingly relying on video tutorials for installation guidance. These behavioral changes are driving parts traffic away from traditional storefronts and toward the e-commerce automotive aftermarket.
Expansion of Last-Mile Logistics and Same-Day Delivery Networks
Walmart's GoLocal, in collaboration with Roadie, enables retailers to guarantee same-day delivery of batteries and alternators across major United States cities. O'Reilly Automotive notes an increasing percentage of orders reaching customers within hours, thanks to regional hubs that bridge the gap between inventory and customers' driveways. A higher order volume reduces shipping costs per unit, and the urgency of roadside emergencies strengthens customer loyalty to platforms that promptly address these replacement needs [2]“GoLocal Delivery Solutions,”, Walmart Inc., corporate.walmart.com.
OEMs Launching Official E-commerce Channels
General Motors expanded its ACDelco part offerings on its direct-to-consumer portal, integrating VIN lookup to ensure accurate fitment. Amazon introduced an OEM parts store with augmented-reality visualization, significantly reducing return rates. These OEM strategies push independent dealers to prioritize faster delivery and installation partnerships while also normalizing online parts purchasing and driving growth in the e-commerce automotive aftermarket landscape.
Restraints Impact Analysis*
| Restraint | (~) % Impact on CAGR Forecast | Geographic Relevance | Impact Timeline |
|---|---|---|---|
| Counterfeit Parts Concerns | -2.8% | Global, particularly acute in developing markets | Medium term (2-4 years) |
| Complex Cross-Border Part Regulations | -1.9% | Global, especially EU-US-Asia trade corridors | Long term (≥ 4 years) |
| Right-To-Repair Laws | -1.2% | North America and Europe, expanding globally | Long term (≥ 4 years) |
| Semiconductor Shortages | -0.7% | Global, concentrated in automotive electronics | Short term (≤ 2 years) |
| Source: Mordor Intelligence | |||
Counterfeit Parts Concerns Erode Consumer Trust
An EU study found that the majority of counterfeit parts seized originated in China, underscoring potential safety hazards to critical components such as airbags, brake pads, and oil filters. To combat this, marketplaces are leveraging machine-learning tools to identify and flag dubious sellers. Concurrently, brand owners are embedding QR codes and blockchain IDs to enable end-user verification. Yet, despite rising authentication rates, illicit operators swiftly rotate their storefronts. Moreover, in price-sensitive regions, consumers continue to prioritize cost, which diminishes the effectiveness of these protective measures in the E-commerce automotive aftermarket[3]“Counterfeit Vehicle Parts Seizures 2024,”, European Union Intellectual Property Office, europa.eu.
Complex Cross-Border Hazardous-Part Regulations
Under the United Nations Model Regulations, lithium-ion batteries, brake fluids, and refrigerants are deemed dangerous goods. This classification mandates stringent packaging, labeling, and carrier-certification protocols, leading to a surge in logistics costs. The United States PHMSA imposed stricter air-cargo regulations on lithium batteries, curtailing expedited shipping options. Consequently, retailers are compelled to diversify their stock across various regions and uphold catalogs tailored to specific jurisdictions. This not only increases operational complexity but also heightens working capital requirements in the E-commerce automotive aftermarket sector.
*Our forecasts treat driver/restraint impacts as directional, not additive. The impact forecasts reflect baseline growth, mix effects, and variable interactions.
Segment Analysis
By Replacement Part: Tires Lead, Electrical Parts Accelerate
Suspension items accounted for 26.64% of 2025 revenue in the E-commerce Automotive Aftermarket Market, confirming their status as high-frequency wear components. Electrical parts are expanding at a 17.66% CAGR as sensors, control units, and high-voltage harnesses proliferate in driver-assistance and electrified platforms. Lighting is migrating from halogen to LED arrays, unlocking premium upgrades, while wipers and filters drive repeat traffic despite slim margins.
Demand for electrical SKUs also reflects rising control-unit prices that can exceed USD 1,000, often software-locked to a unique VIN. Suspension parts remain commoditized yet stable volume anchors, with OEM-equivalent, performance, and budget tiers competing on warranty and price. The maturity of the suspension market keeps gross margins modest, but order predictability supports efficient fulfillment networks across the E-commerce automotive aftermarket.


By Sales Channel: B2C Dominates, B2B Gains Momentum
In 2025, DIY owners' preference for doorstep delivery propelled business-to-consumer orders to account for 66.59% of total revenue. Meanwhile, API-based procurement is gaining traction among fleet operators, workshops, and dealers, fueling a surge in business-to-business (B2B) transactions. B2B is projected to expand at a robust 22.70% CAGR from 2026 to 2031. Platforms serving both B2C and B2B segments strategically leverage distinct price lists, credit terms, and dedicated customer success teams, while optimizing a shared central inventory.
Fleets are increasingly adopting subscription replenishment models, spurred by telematics alerts that streamline orders for oil, brakes, and filters. With pricing set at USD 15–75 per vehicle per month, these models are establishing consistent revenue streams in the E-commerce automotive aftermarket. While retail-consumer demand fluctuates with discretionary income and seasonal maintenance trends, fleet demand remains anchored to uptime metrics and service-level agreements.
By Vehicle Type: Passenger Cars Dominate the Electric Shift
Passenger cars accounted for 62.49% of 2025 revenue and are projected to grow at a 29.17% CAGR, reflecting the massive aging base of sedans, hatchbacks, and crossovers. Light commercial vehicles rely on rapid fulfillment and flexible credit to minimize downtime. Medium- and heavy-duty commercial trucks, though lower in unit count, place orders exceeding USD 5,000 when engines or transmissions fail.
Electrified light vans gain share in Europe and China to comply with zero-emission zones, yet certified technicians for high-voltage work are scarce. Medium trucks remain diesel-dominant due to payload and charging infrastructure constraints. Passenger-car traffic also comes from ride-hailing and car-sharing fleets, whose high annual mileage accelerates component wear, thereby expanding the E-commerce Automotive Aftermarket Market opportunity.
By Propulsion: Internal Combustion Engine Still Commands Volume, Electric Vehicles Drive Growth
Internal-combustion models accounted for 84.01% of 2025 revenue because the global parc is still predominantly gasoline- or diesel-powered. Electric vehicles grow at 25.10% as battery-pack replacements, thermal-management parts, and high-voltage contactors reach end-of-warranty. Hybrid vehicles straddle both worlds, requiring spark plugs and inverters alike, complicating catalogs.
Electric aftermarket spend centers today on tires, brake pads, cabin filters, and wiper blades, yet battery diagnostics will unlock larger ticket sizes as first-generation EVs age. OEM control over battery software narrows independent participation. ICE parts will dominate absolute dollars through 2031, but electrification alters the mix and spurs new specializations in the E-commerce automotive aftermarket.
Geography Analysis
North America held 38.45% of 2025 revenue in the E-commerce Automotive Aftermarket Market, supported by high vehicle ownership, omnichannel pure-plays, and a favorable regulatory push for data access under the REPAIR Act. Canadian demand mirrors United States trends but spikes in winter, when batteries, suspension systems, and heating systems fail more often.
Asia-Pacific is the fastest-growing region, with 24.70% growth through 2031. India has a significant electric vehicle parc, while China leads in sales. Platforms like Alibaba’s Tmall Auto in China are streamlining operations by integrating payments and warehouses to minimize friction. ASEAN markets have seen growth in light-vehicle sales, with a notable percentage being electrified. This surge is propelling parts orders, increasingly driven by smartphone apps and cashless wallets.
Europe is swiftly pivoting to online parts sourcing, spurred by right-to-repair regulations mandating long-term availability of spare parts. Countries like Germany, the United Kingdom, France, and Italy are at the forefront, reaping the revenue benefits. Meanwhile, efficient cross-border logistics within Europe's single market ensure competitive shipping times. Latin America's automotive scene is still in its infancy, yet it's reaping rewards from instant-payment systems like Pix. In contrast, the Middle East and Africa grapple with challenges, hindered by fragmented regulations and infrastructure.

Competitive Landscape
The competitive field is moderately concentrated. Amazon has a significant hold on global aftermarket e-commerce sales through its Prime delivery promise and extensive seller ecosystem. Alibaba’s cross-border storefronts contribute significantly to its market share, supported by direct relationships with Asian manufacturers. Traditional auto-parts chains respond with buy-online-pick-up-in-store models and investments in same-day courier partnerships to defend core customer bases.
Technology adoption differentiates front-runners. Fitment engines powered by artificial intelligence deliver vehicle-specific accuracy, shrinking costly returns and improving conversion rates. Subscription-based fleet replenishment programs drive predictable recurring revenue and higher lifetime value. Security layers such as serialization, QR code tracking, and supplier rating systems help trusted platforms combat counterfeits, reinforcing brand equity and widening moats within the E-commerce Automotive Aftermarket Market.
Strategic alliances proliferate. An automaker recently opened a branded storefront on a leading marketplace, enabling customers to configure, finance, and schedule delivery of new vehicles entirely online. Major platforms have also purchased fitment-software providers and last-mile delivery startups to own critical capabilities. Consolidation is likely as scale synergies in procurement, logistics, and IT raise the bar for participation.
E-commerce Automotive Aftermarket Industry Leaders
Amazon.com
Alibaba Group
Advance Auto Parts
AutoZone
O’Reilly Auto Parts
- *Disclaimer: Major Players sorted in no particular order

Recent Industry Developments
- April 2025: AutoNation has acquired Groove Ford and Groove Mazda, marking a strategic expansion of its dealership network. The acquired dealerships have been rebranded to AutoNation Ford Arapahoe and AutoNation Mazda Arapahoe, reflecting the company's branding and operational standards.
- January 2025: eBay closed the purchase of Caramel to streamline paperwork, financing and title transfer for online vehicle transactions.


Global E-commerce Automotive Aftermarket Market Report Scope
The E-commerce Automotive Aftermarket Market report is segmented by replacement part (engine parts, transmission and steering, brake system, lighting, electrical parts, suspension system, wipers, others), sales channel (business-to-business (B2B) and business-to-consumer (B2C)), vehicle type (passenger cars, light commercial vehicles (LCVs), and medium and heavy commercial vehicles (MHCVs)), propulsion (internal combustion engine (ICE) vehicles, electric vehicles (EVs), and hybrid vehicles), and geography (North America, South America, Europe, Asia-Pacific, and Middle East and Africa). The Market Forecasts are Provided in Value (USD).
| Engine Parts |
| Transmission and Steering |
| Brake System |
| Lighting |
| Electrical Parts |
| Suspension System |
| Wipers |
| Others |
| Business-to-Business (B2B) |
| Business-to-Consumer (B2C) |
| Passenger Cars |
| Light Commercial Vehicles (LCVs) |
| Medium and Heavy Commercial Vehicles (MHCVs) |
| Internal Combustion Engine (ICE) Vehicles |
| Electric Vehicles (EVs) |
| Hybrid Vehicles |
| North America | United States |
| Canada | |
| Rest of North America | |
| South America | Brazil |
| Argentina | |
| Rest of South America | |
| Europe | United Kingdom |
| Germany | |
| France | |
| Spain | |
| Italy | |
| Netherlands | |
| Russia | |
| Rest of Europe | |
| Asia-Pacific | China |
| India | |
| Japan | |
| South Korea | |
| Australia | |
| Rest of Asia-Pacific | |
| Middle East and Africa | United Arab Emirates |
| Saudi Arabia | |
| South Africa | |
| Rest of Middle-East and Africa |
| By Replacement Part | Engine Parts | |
| Transmission and Steering | ||
| Brake System | ||
| Lighting | ||
| Electrical Parts | ||
| Suspension System | ||
| Wipers | ||
| Others | ||
| By Sales Channel | Business-to-Business (B2B) | |
| Business-to-Consumer (B2C) | ||
| By Vehicle Type | Passenger Cars | |
| Light Commercial Vehicles (LCVs) | ||
| Medium and Heavy Commercial Vehicles (MHCVs) | ||
| By Propulsion | Internal Combustion Engine (ICE) Vehicles | |
| Electric Vehicles (EVs) | ||
| Hybrid Vehicles | ||
| Geography | North America | United States |
| Canada | ||
| Rest of North America | ||
| South America | Brazil | |
| Argentina | ||
| Rest of South America | ||
| Europe | United Kingdom | |
| Germany | ||
| France | ||
| Spain | ||
| Italy | ||
| Netherlands | ||
| Russia | ||
| Rest of Europe | ||
| Asia-Pacific | China | |
| India | ||
| Japan | ||
| South Korea | ||
| Australia | ||
| Rest of Asia-Pacific | ||
| Middle East and Africa | United Arab Emirates | |
| Saudi Arabia | ||
| South Africa | ||
| Rest of Middle-East and Africa | ||


Key Questions Answered in the Report
What is the projected value of global e-commerce automotive parts sales by 2031?
The E-commerce Automotive Aftermarket Market size is forecast to reach USD 277.77 billion by 2031.
Which replacement-part category is expected to grow the fastest?
Electrical components are advancing at a 17.66% CAGR through 2031 due to rapid ADAS and EV adoption.
How quickly is Asia-Pacific expanding in online automotive parts?
Asia-Pacific revenue is projected to rise at a 24.70% CAGR between 2026 and 2031, the quickest among regions.
Why are OEM portals significant for digital parts retailing?
OEM portals integrate VIN lookup, guarantee genuine parts, and cut return rates, directly challenging independent distributors.
What is driving business-to-business e-commerce adoption among fleets?
Telematics integration enables automated parts orders that minimize downtime and support predictable maintenance budgets.
Page last updated on:


