Market Overview
| Study Period | 2020 - 2031 |
|---|---|
| Forecast Data Period | 2026 - 2031 |
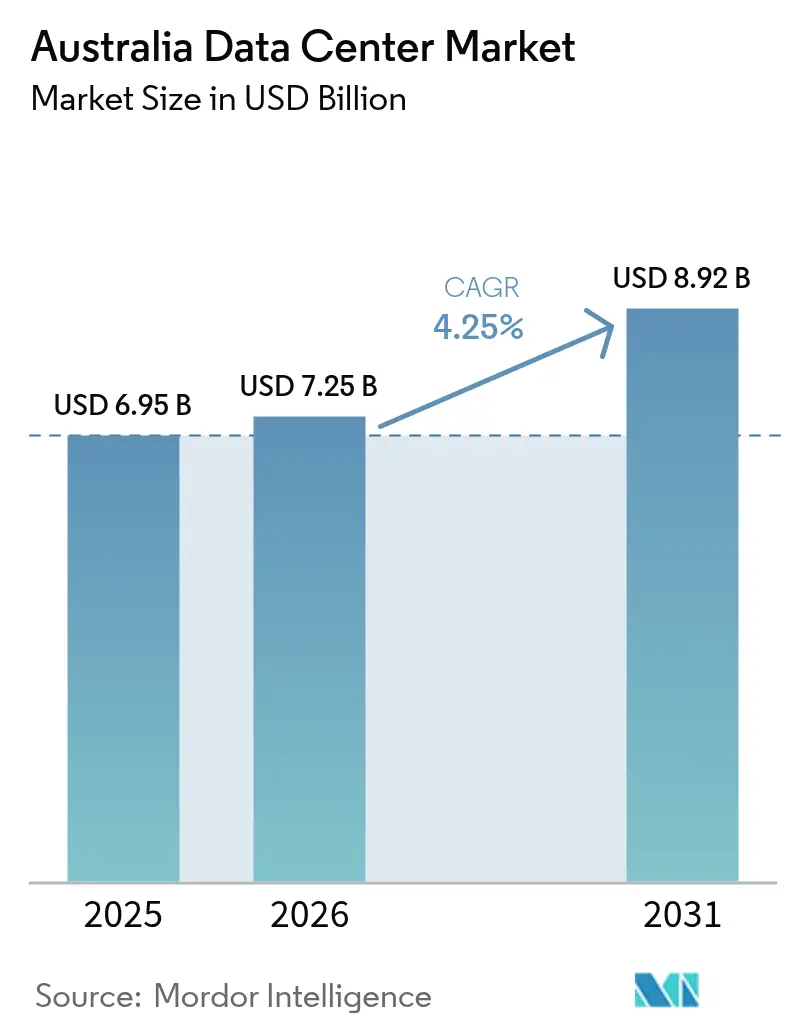
| Base Year Market Size (2025) | USD 6.95 Billion |
| Market Size (2026) | USD 7.25 Billion |
| Market Size (2031) | USD 8.92 Billion |
| Growth Rate (2026 - 2031) | 4.25% CAGR |
| Market Concentration | Low |
Major Players *Disclaimer: Major Players sorted in no particular order Image © Mordor Intelligence. Reuse requires attribution under CC BY 4.0. | |
Australia Data Center Market Analysis by Mordor Intelligence
The Australia Data Center Market size is expected to grow from USD 6.95 billion in 2025 to USD 7.25 billion in 2026 and is forecast to reach USD 8.92 billion by 2031 at 4.25% CAGR over 2026-2031. In terms of IT load capacity, the market is expected to grow from 3.53 thousand megawatt in 2025 to 7.18 thousand megawatt by 2030, at a CAGR of 15.25% during the forecast period (2025-2030). The market segment shares and estimates are calculated and reported in terms of MW. Investments such as Amazon’s AUD 20 billion (USD 13.6 billion) commitment and Microsoft’s AUD 5 billion (USD 3.4 billion) expansion plan underscore the confidence that hyperscale operators have in Australia’s position as the digital gateway to the Asia-Pacific region. Surging AI and high-performance computing (HPC) workloads, sustained government cybersecurity mandates, and increasing undersea cable landings drive capacity additions, while renewable energy incentives mitigate power tariff risk in regional markets. Competitive pressure intensifies as hyperscalers shift from wholesale colocation to self-built campuses, prompting incumbents to double down on interconnection ecosystems and sustainability certifications. Nevertheless, grid constraints outside tier-1 cities and a skilled-labor shortage underpin project delays, adding cost and timeline pressure that operators now factor into long-term contracts.
Key Report Takeaways
- By data-center size, large-scale deployments led with 24.37% of the Australia data center market share in 2025, while massive facilities are projected to advance at a 16.97% CAGR through 2031.
- By tier type, tier 3 infrastructure accounted for an 83.54% share of the Australia data center market size in 2025, but tier 4 deployments are forecast to expand at an 17.98% CAGR through 2031.
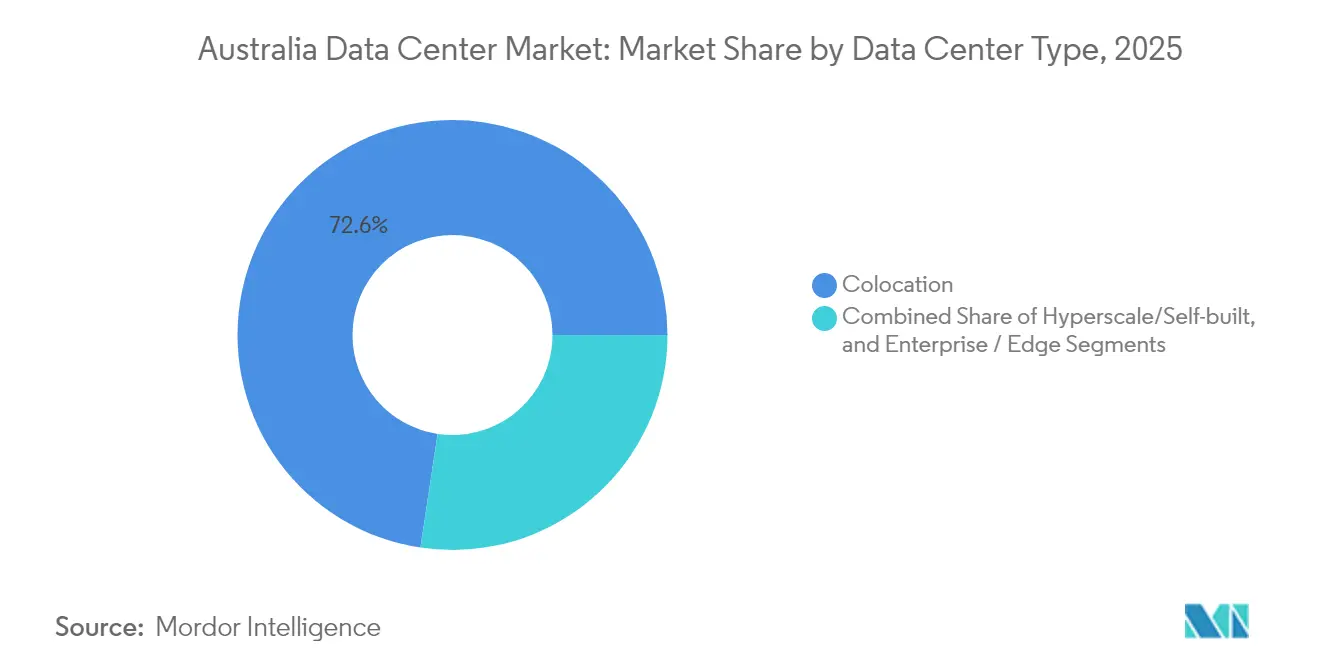
- By data-center type, colocation maintained a 72.62% share of the Australia data center market size in 2025, yet hyperscale self-builds record the fastest 18.95% CAGR to 2031.
- By end user, IT and telecom held 49.12% of the Australia data center market share in 2025, whereas banking, financial services and insurance (BFSI) is set to grow at a 15.88% CAGR through 2031.
- By hotspot, Melbourne captured 22.07% revenue share in 2025, but Sydney is pacing a 12.18% CAGR to 2031.
Note: Market size and forecast figures in this report are generated using Mordor Intelligence’s proprietary estimation framework, updated with the latest available data and insights as of 2026.
Australia Data Center Market Trends and Insights
Drivers Impact Analysis*
| Driver | (~) % Impact on CAGR Forecast | Geographic Relevance | Impact Timeline |
|---|---|---|---|
| Accelerated cloud-migration by Australian enterprises | +3.2% | National, concentrated in Sydney and Melbourne | Short term (≤ 2 years) |
| Green-energy incentives for data center operators | +2.1% | National, strongest in Queensland and South Australia | Medium term (2-4 years) |
| Sub-1 ms latency demand from edge applications | +2.8% | Metro areas: Sydney, Melbourne, Brisbane | Medium term (2-4 years) |
| Surging AI and HPC workloads in research hubs | +3.5% | Sydney, Melbourne, Brisbane, Canberra | Long term (≥ 4 years) |
| Government cyber-security mandates for critical infra | +1.9% | National, priority on critical infrastructure zones | Short term (≤ 2 years) |
| Rising under-sea cable landings enhancing connectivity | +1.8% | Coastal regions: Sydney, Perth, Darwin | Long term (≥ 4 years) |
| Source: Mordor Intelligence | |||
Accelerated Cloud Migration by Australian Enterprises
Enterprises move past lift-and-shift projects toward cloud-native architectures, with Microsoft estimating that 85% of Australian business applications will reside in the cloud by 2025. [1]Telstra, “Telstra Scales Up AI Adoption,” TELSTRA.COM.AU Telstra’s migration to a 100% API-first environment and Azure OpenAI integration has already lowered repeat customer contacts by 20%.BFSI leaders, including Commonwealth Bank and Westpac, adopt a multi-cloud approach to avoid lock-in, thereby escalating demand for interconnected colocation and cross-connect services. Regional organizations trail metro peers by roughly two years in cloud maturity, extending migration waves well into 2028. Hybrid designs that keep latency-sensitive workloads local directly stimulate additional Australia data center market capacity.
Green-Energy Incentives for Data-Center Operators
Queensland’s 80% renewable-energy mandate by 2035 and South Australia’s net-zero pledge propel site-selection models toward regions rich in wind and solar generation.[2]NEXTDC, “100% Carbon-Neutral Certified Data Centres,” NEXTDC.COM Power-purchase agreements stabilized at sub-AUD 80/MWh allow operators to hedge against retail tariffs that range from 24.2-43.6 cents per kWh. NEXTDC’s Climate Active certification offsets 0.492 tonnes of emissions for every kilowatt, creating brand differentiation while satisfying investor ESG screens. Hyperscalers that have pledged to source 100% of their energy from renewable sources by 2030 are channeling demand toward these greener footprints, intensifying competition for transmission capacity in renewable corridors.
Sub-1 ms Latency Demand from Edge Applications
Autonomous-vehicle programs, industrial IoT deployments, and real-time gaming platforms require round-trip delays below 20 milliseconds to stay within safety or user-experience thresholds. [3]iMOVE Australia, “A Comparative Assessment of C-ITS Technologies,” IMOVEAUSTRALIA.COM Mobile-edge computing nodes using virtual roadside units enable telcos to hit the target while containing capital outlays. Financial-market participants collocating near ASX exchange engines further push micro-data-center placement into core Sydney business districts. The interplay of 5G rollout and edge nodes creates incremental revenue streams for facility owners via network-slice hosting and dedicated bare-metal services.
Surging AI and HPC Workloads in Research Hubs
Purpose-built graphic-processing-unit clusters, such as NEXTDC’s M4 AI Factory in Melbourne, support liquid-cooled racks exceeding 50 kW per rack. National AI grants totaling AUD 101.2 million (USD 68.8 million) catalyze climate modeling, genomics, and materials science workloads that require domestic computing for data sovereignty compliance. Sovereign AI requirements restrict the offshore training of sensitive datasets, thereby reinforcing the need for a local hardware build-out. As large-language-model training consolidates in hyperscale data centers and inference shifts toward the edge, operators monetize premium AI-ready suites at higher power density tariffs.
Restraints Impact Analysis*
| Restraint | (~) % Impact on CAGR Forecast | Geographic Relevance | Impact Timeline |
|---|---|---|---|
| Escalating power-tariffs in major metro regions | -2.3% | Sydney, Melbourne, Adelaide metro areas | Short term (≤ 2 years) |
| Skilled-labour shortage in mission-critical operations | -1.7% | National, acute in regional markets | Medium term (2-4 years) |
| Grid-capacity bottlenecks outside Tier-1 cities | -1.9% | Regional Queensland, Western Australia, Northern Territory | Long term (≥ 4 years) |
| Heightened ESG scrutiny on water consumption | -1.4% | Water-stressed regions: South Australia, Western Australia | Medium term (2-4 years) |
| Source: Mordor Intelligence | |||
Escalating Power Tariffs in Major Metro Regions
Quarterly wholesale spot prices swung between AUD 50-150/MWh, while retail tariffs peaked at 43.6 cents per kWh in South Australia versus 24.2-27.0 cents in Victoria . New high-voltage grid connections in land-constrained Sydney cost upward of AUD 5 million (USD 3.4 million) and take as long as 36 months to energize. Smaller colocation providers lacking hedging arrangements feel the margin squeeze most, pushing them either toward renewable PPAs or to secondary cities where tariffs are lower. The tariff disparity could trigger a capacity shift away from the traditional Sydney-Melbourne axis.
Skilled-Labour Shortage in Mission-Critical Operations
Construction cycles lengthen 6-12 months because experienced electrical and mechanical trades are scarce relative to mining and public works demand. Mission-critical certified facility managers command premium salaries, an expense magnified in regions where fewer candidates hold Security of Critical Infrastructure clearances. Liquid-cooling adoption in AI halls introduces new skill requirements, compelling operators to launch in-house academies or partner with technical institutes. Visa delays for foreign specialists restrict near-term relief, favoring incumbents with established training pipelines.
*Our forecasts treat driver/restraint impacts as directional, not additive. The impact forecasts reflect baseline growth, mix effects, and variable interactions.
Segment Analysis
By Data Center Size – Hyperscale Campuses Shape Capacity Outlook
Massive deployments, surpassing 100 MW configurations, recorded the fastest 16.97% CAGR, whereas large-scale halls retained 24.37% of the 2025 demand. Amazon’s AUD 20 billion (USD 13.6 billion) and Microsoft’s AUD 5 billion (USD 3.4 billion) master plans underline a clear pivot toward integrated campuses that secure preferential utility contracts. The Australia data center market size for massive facilities consequently widens as enterprises favor hyperscale nodes for AI training clusters, while medium and small footprints gravitate toward edge locations for latency compliance. Campus operators monetize onsite substations and private fiber loops, a model that scales more efficiently than multi-tenant colocation. At the same time, environmental approval timelines challenge metro infill projects, pushing greenfield builds into outer suburbs with spare grid capacity.


By Tier Type – Tier 4 Extends Reliability Frontiers
The Australia data center market share of tier 3 architecture was 83.54% in 2025, but tier 4 facilities show an outsized 17.98% CAGR courtesy of BFSI and public-sector uptime mandates. NEXTDC operates the country’s only multi-city portfolio of Tier IV certified halls, charging premium monthly recurring revenue for 99.995% availability. Financial market reforms that introduce real-time payments drive near-zero downtime expectations in core banking workloads. While construction premiums can reach 60% over tier 3, operators justify the investment through bundled managed services and compliance documentation that smaller rivals cannot replicate. Between 2026 and 2030, the greater adoption of distributed redundant UPS and dual-grid feeds widens the Tier 4 addressable base.
By Data Center Type – Hyperscale Self-Builds Redefine Supply Dynamics
Colocation retained 72.62% leadership in 2025, sustained by multi-tenant demand from cloud-agnostic enterprises. However, self-build capacity grows at a rate of 18.95% annually as hyperscalers emphasize performance customization and direct utility engagement. The shift prompts retail colocation specialists to reposition assets as interconnection hubs, clustering cloud on-ramp ports and metro-fiber exchanges. Wholesale leases remain relevant for corporates that need dedicated cages but lack the capital to construct them outright. Institutional funds such as Blackstone validated the earnings potential by acquiring AirTrunk for AUD 24 billion (USD 16.32 billion) in 2024. Over time, ecosystem differentiation-carrier density, cloud exchanges, and AI-ready power densities- will distinguish profitable colocation nodes from stranded assets.
By End User – BFSI Accelerates Digital Reliance
IT and telecom dominated 49.12% of 2025 demand, but BFSI’s 15.88% CAGR makes it the fastest riser on the back of real-time settlement systems and AI-driven fraud analytics. Commonwealth Bank’s shift into a cloud-native core and Westpac’s multi-cloud risk-management stack highlight the trend toward lower latency and geographically diverse backup zones. For telecom operators, 5G network slicing translates into micro-edge deployments that tie back to core facilities through 400 Gbps wave upgrades. Manufacturing firms rely on predictive-maintenance algorithms, keeping regional edge suites active near production lines. Public-sector agencies align with the Digital Government Strategy, spreading workloads across tier 4 and sovereign-cloud nodes to satisfy Protective Security Policy Framework mandates.
Geography Analysis
Sydney and Melbourne together form the twin pillars of the Australia data center market, but divergent growth patterns guide capacity allocation through 2030. Melbourne controlled 22.07% of 2025 demand, driven by its legacy financial cluster and cooler climate. Yet strict planning codes and rising land prices in inner suburbs hindered new builds, steering operators toward outer-metro zones such as Dandenong. Sydney enjoys superior submarine-cable density via Google’s Australia Connect and other trans-Pacific systems, driving a leading 12.18% CAGR through 2031. That connectivity advantage attracts content-delivery networks, fintechs, and multinational SaaS providers that need low-latency Asian routes.
Brisbane benefits from Queensland’s renewable-energy roadmap, drawing hyperscale feasibility studies that leverage the state’s 80% clean-power target. Load pockets north of Gladstone offer inexpensive land and future hydrogen-based firming capacity, factors that could tilt expansions away from congested southeastern grids. Perth and Darwin sit at strategic junctures for Africa-Asia and North-Asia trajectories, making them logical disaster-recovery or resilient edge outposts, even though absolute demand remains moderate. The Australian Energy Market Operator flags 5.8-GW of transmission upgrades into these regions, suggesting that today’s grid bottlenecks may relax post-2028.
Competitive Landscape
NEXTDC, CDC Data Centres, and AirTrunk form the core triumvirate that shapes commercial colocation terms and sets design standards across the Australia data center market. NEXTDC differentiates itself via Climate Active certifications, offering carbon-neutral rack space at scale, while CDC relies on government accreditation to secure defense and intelligence contracts. AirTrunk’s new capital backing from Blackstone funds multi-region hyperscale campuses that extend beyond the Sydney-Melbourne corridor. Hyperscalers, including Amazon, Microsoft, and Google, continue to absorb the lion’s share of electricity and land parcels for self-builds, effectively acting as both customers and competitors to the colocation incumbents.
Technology convergence deepens rivalries. Liquid-cooling adoption, AI-oriented power-shell designs and robotic hands-free operations define the premium tier-4 build specifications of 2025 projects. Smaller regional operators seek niches by bundling managed edge compute, deploying modular 5-10 MW pods close to agritech and mining hubs. Regulatory oversight under the Security of Critical Infrastructure Act 2018 imposes compliance costs that favor well-capitalized entities, reinforcing a steady trajectory of consolidation. Strategic alliances, such as Singtel and Hitachi’s memorandum for AI-ready facilities-underline how technology providers and telcos diversify revenue streams through infrastructure co-ownership.
Australia Data Center Industry Leaders
Telstra International Limited
Digital Realty Trust, Inc.
Equinix, Inc.
Fujitsu Limited
Google LLC
- *Disclaimer: Major Players sorted in no particular order


Recent Industry Developments
- June 2025: STACK Infrastructure mandated advisors to raise AUD 1.3 billion (USD 0.884 billion) for new builds, while Partners Group bought GreenSquareDC for AUD 1.2 billion (USD 0.816 billion).
- December 2024: Fujitsu expanded its global collaboration agreement with AWS to double certified-engineer count and target 800 enterprise deals, accelerating cloud migrations.
- December 2024: Hitachi and NTT Communications achieved 20 ms round-trip data synchronization over 600 km, proving long-haul active-active architectures.
- November 2024: NTT Data and Google Cloud formed a dedicated business unit to scale AI solutions across Asia Pacific, aiming to 10x regional cloud revenue within three years.


Australia Data Center Market Report Scope
Melbourne, Perth, Sydney are covered as segments by Hotspot. Large, Massive, Medium, Mega, Small are covered as segments by Data Center Size. Tier 1 and 2, Tier 3, Tier 4 are covered as segments by Tier Type. Non-Utilized, Utilized are covered as segments by Absorption.By Data Center Size
| Large |
| Massive |
| Medium |
| Mega |
| Small |
By Tier Type
| Tier 1 and 2 |
| Tier 3 |
| Tier 4 |
By Data Center Type
| Hyperscale / Self-built | ||
| Enterprise / Edge | ||
| Colocation | Non-Utilized | |
| Utilized | Retail Colocation | |
| Wholesale Colocation | ||
By End User
| BFSI |
| IT and ITES |
| E-Commerce |
| Government |
| Manufacturing |
| Media and Entertainment |
| Telecom |
| Other End Users |
By Hotspot
| Melbourne |
| Sydney |
| Brisbane |
| Rest of Australia |
| By Data Center Size | Large | ||
| Massive | |||
| Medium | |||
| Mega | |||
| Small | |||
| By Tier Type | Tier 1 and 2 | ||
| Tier 3 | |||
| Tier 4 | |||
| By Data Center Type | Hyperscale / Self-built | ||
| Enterprise / Edge | |||
| Colocation | Non-Utilized | ||
| Utilized | Retail Colocation | ||
| Wholesale Colocation | |||
| By End User | BFSI | ||
| IT and ITES | |||
| E-Commerce | |||
| Government | |||
| Manufacturing | |||
| Media and Entertainment | |||
| Telecom | |||
| Other End Users | |||
| By Hotspot | Melbourne | ||
| Sydney | |||
| Brisbane | |||
| Rest of Australia | |||


Market Definition
- IT LOAD CAPACITY - The IT load capacity or installed capacity, refers to the amount of energy consumed by servers and network equipments placed in a rack installed. It is measured in megawatt (MW).
- ABSORPTION RATE - It denotes the extend to which the data center capacity has been leased out. For instance, a 100 MW DC has leased out 75 MW, then absorption rate would be 75%. It is also referred as utilization rate and leased-out capacity.
- RAISED FLOOR SPACE - It is an elevated space build over the floor. This gap between the original floor and the elevated floor is used to accommodate wiring, cooling, and other data center equipment. This arrangement assist in having proper wiring and cooling infrastructure. It is measured in square feet (ft^2).
- DATA CENTER SIZE - Data Center Size is segmented based on the raised floor space allocated to the data center facilities. Mega DC - # of Racks must be more than 9000 or RFS (raised floor space) must be more than 225001 Sq. ft; Massive DC - # of Racks must be in between 9000 and 3001 or RFS must be in between 225000 Sq. ft and 75001 Sq. ft; Large DC - # of Racks must be in between 3000 and 801 or RFS must be in between 75000 Sq. ft and 20001 Sq. ft; Medium DC # of Racks must be in between 800 and 201 or RFS must be in between 20000 Sq. ft and 5001 Sq. ft; Small DC - # of Racks must be less than 200 or RFS must be less than 5000 Sq. ft.
- TIER TYPE - According to Uptime Institute the data centers are classified into four tiers based on the proficiencies of redundant equipment of the data center infrastructure. In this segment the data center are segmented as Tier 1,Tier 2, Tier 3 and Tier 4.
- COLOCATION TYPE - The segment is segregated into 3 categories namely Retail, Wholesale and Hyperscale Colocation service. The categorization is done based on the amount of IT load leased out to potential customers. Retail colocation service has leased capacity less than 250 kW; Wholesale colocation services has leased capacity between 251 kW and 4 MW and Hyperscale colocation services has leased capacity more than 4 MW.
- END CONSUMERS - The Data Center Market operates on a B2B basis. BFSI, Government, Cloud Operators, Media and Entertainment, E-Commerce, Telecom and Manufacturing are the major end-consumers in the market studied. The scope only includes colocation service operators catering to the increasing digitalization of the end-user industries.
| Keyword | Definition |
|---|---|
| Rack Unit | Generally referred as U or RU, it is the unit of measurement for the server unit housed in the racks in the data center. 1U is equal to 1.75 inches. |
| Rack Density | It defines the amount of power consumed by the equipment and server housed in a rack. It is measured in kilowatt (kW). This factor plays a critical role in data center design and, cooling and power planning. |
| IT Load Capacity | The IT load capacity or installed capacity, refers to the amount of energy consumed by servers and network equipment placed in a rack installed. It is measured in megawatt (MW). |
| Absorption Rate | It denotes how much of the data center capacity has been leased out. For instance, if a 100 MW DC has leased out 75 MW, then the absorption rate would be 75%. It is also referred to as utilization rate and leased-out capacity. |
| Raised Floor Space | It is an elevated space built over the floor. This gap between the original floor and the elevated floor is used to accommodate wiring, cooling, and other data center equipment. This arrangement assists in having proper wiring and cooling infrastructure. It is measured in square feet/meter. |
| Computer Room Air Conditioner (CRAC) | It is a device used to monitor and maintain the temperature, air circulation, and humidity inside the server room in the data center. |
| Aisle | It is the open space between the rows of racks. This open space is critical for maintaining the optimal temperature (20-25 °C) in the server room. There are primarily two aisles inside the server room, a hot aisle and a cold aisle. |
| Cold Aisle | It is the aisle wherein the front of the rack faces the aisle. Here, chilled air is directed into the aisle so that it can enter the front of the racks and maintain the temperature. |
| Hot Aisle | It is the aisle where the back of the racks faces the aisle. Here, the heat dissipated from the equipment’s in the rack is directed to the outlet vent of the CRAC. |
| Critical Load | It includes the servers and other computer equipment whose uptime is critical for data center operation. |
| Power Usage Effectiveness (PUE) | It is a metric which defines the efficiency of a data center. It is calculated by: (𝑇𝑜𝑡𝑎𝑙 𝐷𝑎𝑡𝑎 𝐶𝑒𝑛𝑡𝑒𝑟 𝐸𝑛𝑒𝑟𝑔𝑦 𝐶𝑜𝑛𝑠𝑢𝑚𝑝𝑡𝑖𝑜𝑛)/(𝑇𝑜𝑡𝑎𝑙 𝐼𝑇 𝐸𝑞𝑢𝑖𝑝𝑚𝑒𝑛𝑡 𝐸𝑛𝑒𝑟𝑔𝑦 𝐶𝑜𝑛𝑠𝑢𝑚𝑝𝑡𝑖𝑜𝑛). Further, a data center with a PUE of 1.2-1.5 is considered highly efficient, whereas, a data center with a PUE >2 is considered highly inefficient. |
| Redundancy | It is defined as a system design wherein additional component (UPS, generators, CRAC) is added so that in case of power outage, equipment failure, the IT equipment should not be affected. |
| Uninterruptible Power Supply (UPS) | It is a device that is connected in series with the utility power supply, storing energy in batteries such that the supply from UPS is continuous to IT equipment even during utility power is snapped. The UPS primarily supports the IT equipment only. |
| Generators | Just like UPS, generators are placed in the data center to ensure an uninterrupted power supply, avoiding downtime. Data center facilities have diesel generators and commonly, 48-hour diesel is stored in the facility to prevent disruption. |
| N | It denotes the tools and equipment required for a data center to function at full load. Only "N" indicates that there is no backup to the equipment in the event of any failure. |
| N+1 | Referred to as 'Need plus one', it denotes the additional equipment setup available to avoid downtime in case of failure. A data center is considered N+1 when there is one additional unit for every 4 components. For instance, if a data center has 4 UPS systems, then for to achieve N+1, an additional UPS system would be required. |
| 2N | It refers to fully redundant design wherein two independent power distribution system is deployed. Therefore, in the event of a complete failure of one distribution system, the other system will still supply power to the data center. |
| In-Row Cooling | It is the cooling design system installed between racks in a row where it draws warm air from the hot aisle and supplies cool air to the cold aisle, thereby maintaining the temperature. |
| Tier 1 | Tier classification determines the preparedness of a data center facility to sustain data center operation. A data center is classified as Tier 1 data center when it has a non-redundant (N) power component (UPS, generators), cooling components, and power distribution system (from utility power grids). The Tier 1 data center has an uptime of 99.67% and an annual downtime of <28.8 hours. |
| Tier 2 | A data center is classified as Tier 2 data center when it has a redundant power and cooling components (N+1) and a single non-redundant distribution system. Redundant components include extra generators, UPS, chillers, heat rejection equipment, and fuel tanks. The Tier 2 data center has an uptime of 99.74% and an annual downtime of <22 hours. |
| Tier 3 | A data center having redundant power and cooling components and multiple power distribution systems is referred to as a Tier 3 data center. The facility is resistant to planned (facility maintenance) and unplanned (power outage, cooling failure) disruption. The Tier 3 data center has an uptime of 99.98% and an annual downtime of <1.6 hours. |
| Tier 4 | It is the most tolerant type of data center. A Tier 4 data center has multiple, independent redundant power and cooling components and multiple power distribution paths. All IT equipment are dual powered, making them fault tolerant in case of any disruption, thereby ensuring interrupted operation. The Tier 4 data center has an uptime of 99.74% and an annual downtime of <26.3 minutes. |
| Small Data Center | Data center that has floor space area of ≤ 5,000 Sq. ft or the number of racks that can be installed is ≤ 200 is classified as a small data center. |
| Medium Data Center | Data center which has floor space area between 5,001-20,000 Sq. ft, or the number of racks that can be installed is between 201-800, is classified as a medium data center. |
| Large Data Center | Data center which has floor space area between 20,001-75,000 Sq. ft, or the number of racks that can be installed is between 801-3,000, is classified as a large data center. |
| Massive Data Center | Data center which has floor space area between 75,001-225,000 Sq. ft, or the number of racks that can be installed is between 3001-9,000, is classified as a massive data center. |
| Mega Data Center | Data center that has a floor space area of ≥ 225,001 Sq. ft or the number of racks that can be installed is ≥ 9001 is classified as a mega data center. |
| Retail Colocation | It refers to those customers who have a capacity requirement of 250 kW or less. These services are majorly opted by small and medium enterprises (SMEs). |
| Wholesale Colocation | It refers to those customers who have a capacity requirement between 250 kW to 4 MW. These services are majorly opted by medium to large enterprises. |
| Hyperscale Colocation | It refers to those customers who have a capacity requirement greater than 4 MW. The hyperscale demand primarily originates from large-scale cloud players, IT companies, BFSI, and OTT players (like Netflix, Hulu, and HBO+). |
| Mobile Data Speed | It is the mobile internet speed a user experiences via their smartphones. This speed is primarily dependent on the carrier technology being used in the smartphone. The carrier technologies available in the market are 2G, 3G, 4G, and 5G, where 2G provides the slowest speed while 5G is the fastest. |
| Fiber Connectivity Network | It is a network of optical fiber cables deployed across the country, connecting rural and urban regions with high-speed internet connection. It is measured in kilometer (km). |
| Data Traffic per Smartphone | It is a measure of average data consumption by a smartphone user in a month. It is measured in gigabyte (GB). |
| Broadband Data Speed | It is the internet speed that is supplied over the fixed cable connection. Commonly, copper cable and optic fiber cable are used in both residential and commercial use. Here, optic cable fiber provides faster internet speed than copper cable. |
| Submarine Cable | A submarine cable is a fiber optic cable laid down at two or more landing points. Through this cable, communication and internet connectivity between countries across the globe is established. These cables can transmit 100-200 terabits per second (Tbps) from one point to another. |
| Carbon Footprint | It is the measure of carbon dioxide generated during the regular operation of a data center. Since, coal, and oil & gas are the primary source of power generation, consumption of this power contributes to carbon emissions. Data center operators are incorporating renewable energy sources to curb the carbon footprint emerging in their facilities. |


Research Methodology
Mordor Intelligence follows a four-step methodology in all our reports.
- Step-1: Identify Key Variables: In order to build a robust forecasting methodology, the variables and factors identified in Step-1 are tested against available historical market numbers. Through an iterative process, the variables required for market forecast are set and the model is built on the basis of these variables.
- Step-2: Build a Market Model: Market-size estimations for the forecast years are in nominal terms. Inflation is not a part of the pricing, and the average selling price (ASP) is kept constant throughout the forecast period for each country.
- Step-3: Validate and Finalize: In this important step, all market numbers, variables and analyst calls are validated through an extensive network of primary research experts from the market studied. The respondents are selected across levels and functions to generate a holistic picture of the market studied.
- Step-4: Research Outputs: Syndicated Reports, Custom Consulting Assignments, Databases & Subscription Platforms


