Australia Fencing Market Size and Share
Market Overview
| Study Period | 2020 - 2031 |
|---|---|
| Forecast Data Period | 2026 - 2031 |
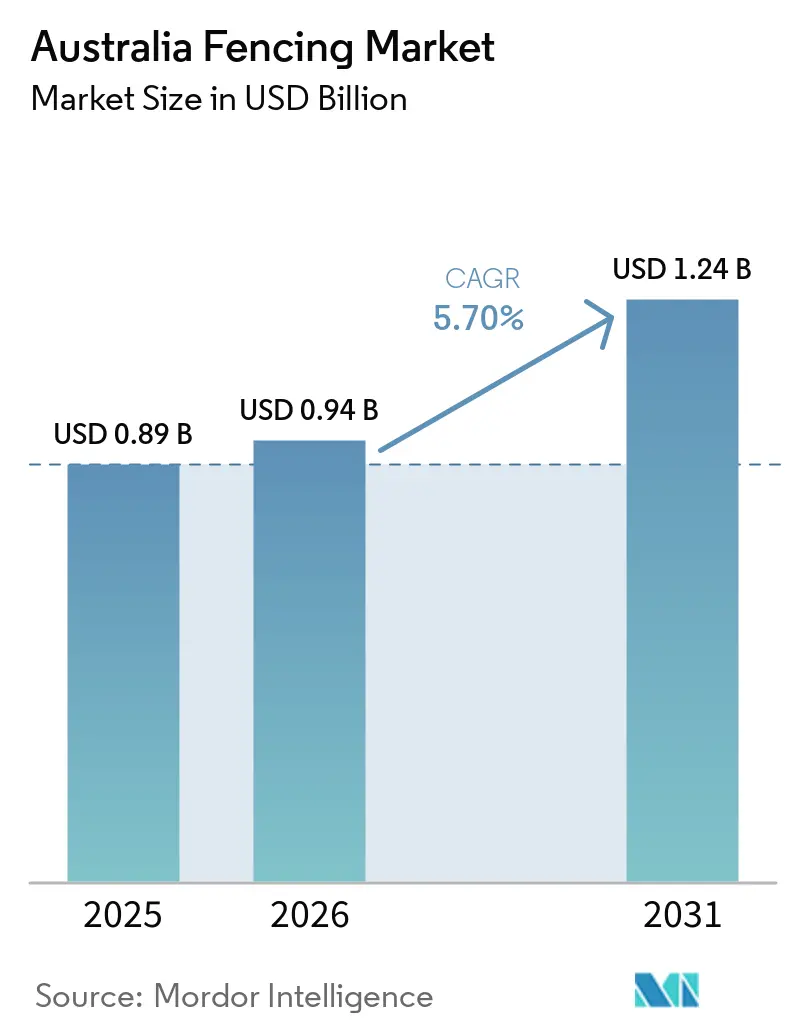
| Base Year Market Size (2025) | USD 0.89 Billion |
| Market Size (2026) | USD 0.94 Billion |
| Market Size (2031) | USD 1.24 Billion |
| Growth Rate (2026 - 2031) | 5.70% CAGR |
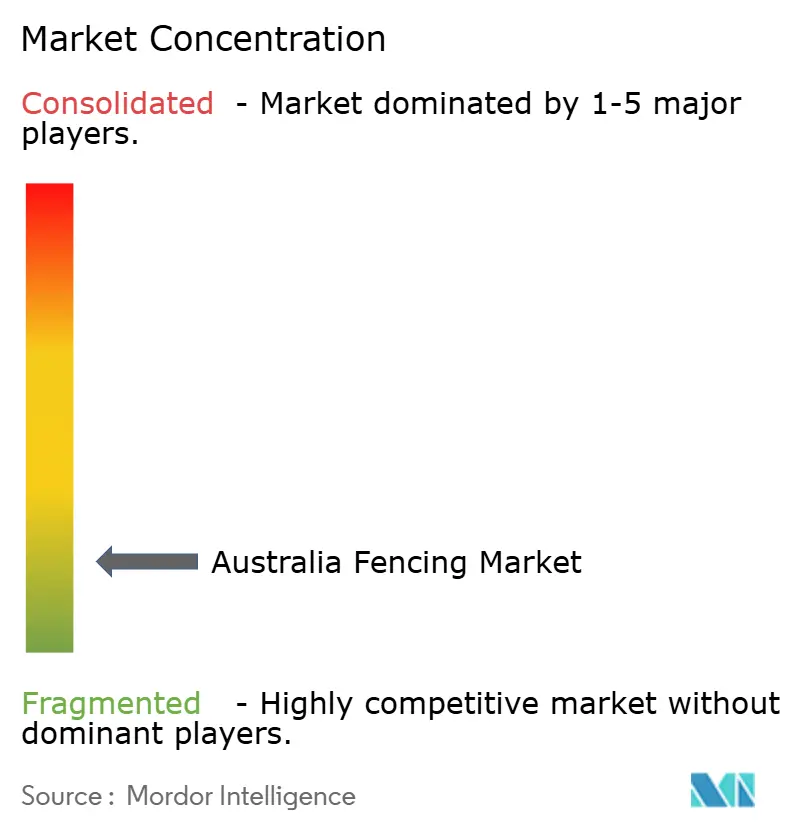
| Market Concentration | Low |
Major Players *Disclaimer: Major Players sorted in no particular order Image © Mordor Intelligence. Reuse requires attribution under CC BY 4.0. | |
Australia Fencing Market Analysis by Mordor Intelligence
The Australia Fencing Market size is expected to increase from USD 0.89 billion in 2025 to USD 0.94 billion in 2026 and reach USD 1.24 billion by 2031, growing at a CAGR of 5.70% over 2026-2031.
The Australia fencing market is being supported by a large infrastructure and resources spending base, with Infrastructure Australia tracking a AUD 242 billion (USD 154.9 billion) major public infrastructure pipeline through 2028-29 and national building work done reaching AUD 43.9 billion (USD 28.5 billion) in Q4 2025. Housing activity is also keeping replacement and boundary work active, as total dwelling commencements rose 26.1% from December 2024 to December 2025, while the National Housing Accord still faces a shortfall that keeps unmet demand in view across the forecast period. Renewable energy sites, transmission assets, and other critical facilities are adding a higher-specification layer of demand because perimeter security fencing is treated as a standard civil works item rather than a discretionary upgrade. Across the Australia fencing market, a clear split is developing between commodity products moving toward prefab and direct-distribution channels and premium solutions tied to security, mining, and critical infrastructure specifications. Competition remains fragmented, and near-term pricing pressure from steel, aluminum, freight, and labor costs is favoring suppliers with stronger domestic logistics and pre-fabricated product ranges.
Key Report Takeaways
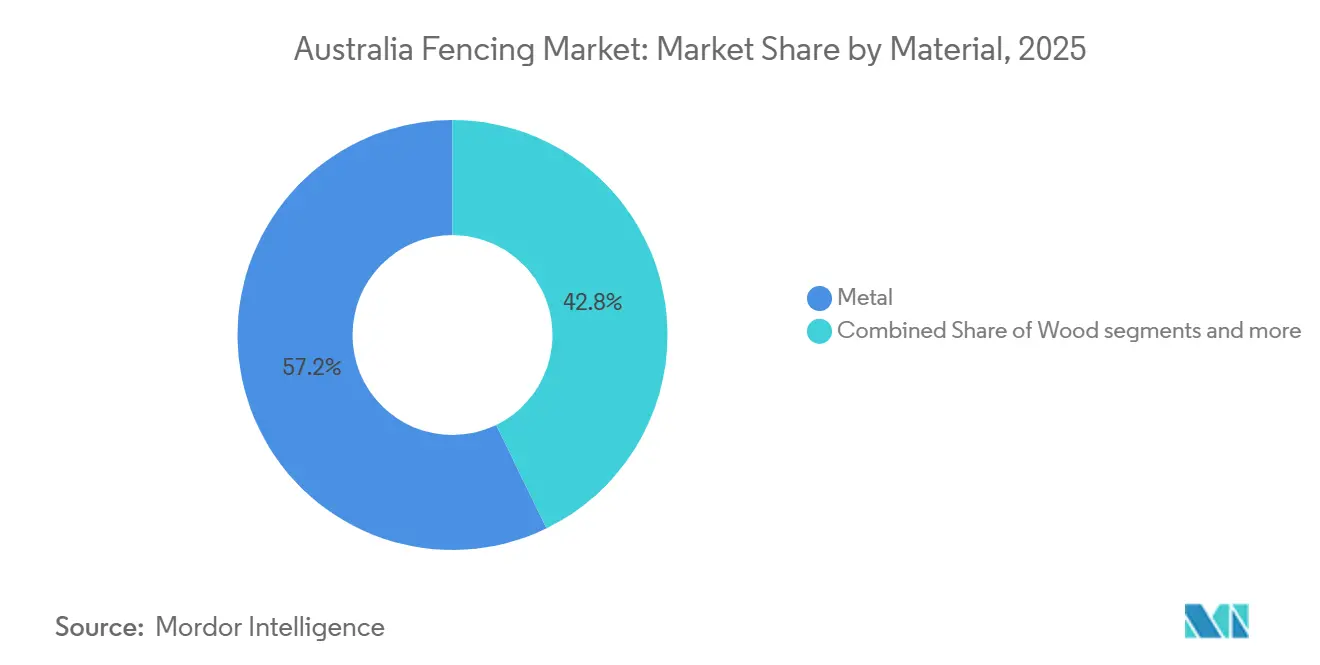
- By material, metal held 57.2% of Australia fencing market share in 2025, while plastic & composite recorded the fastest projected CAGR at 6.5% through 2031.
- By end-user, residential accounted for 41.3% share of the Australia fencing market size in 2025, while mining is forecast to expand at a 7.0% CAGR through 2031.
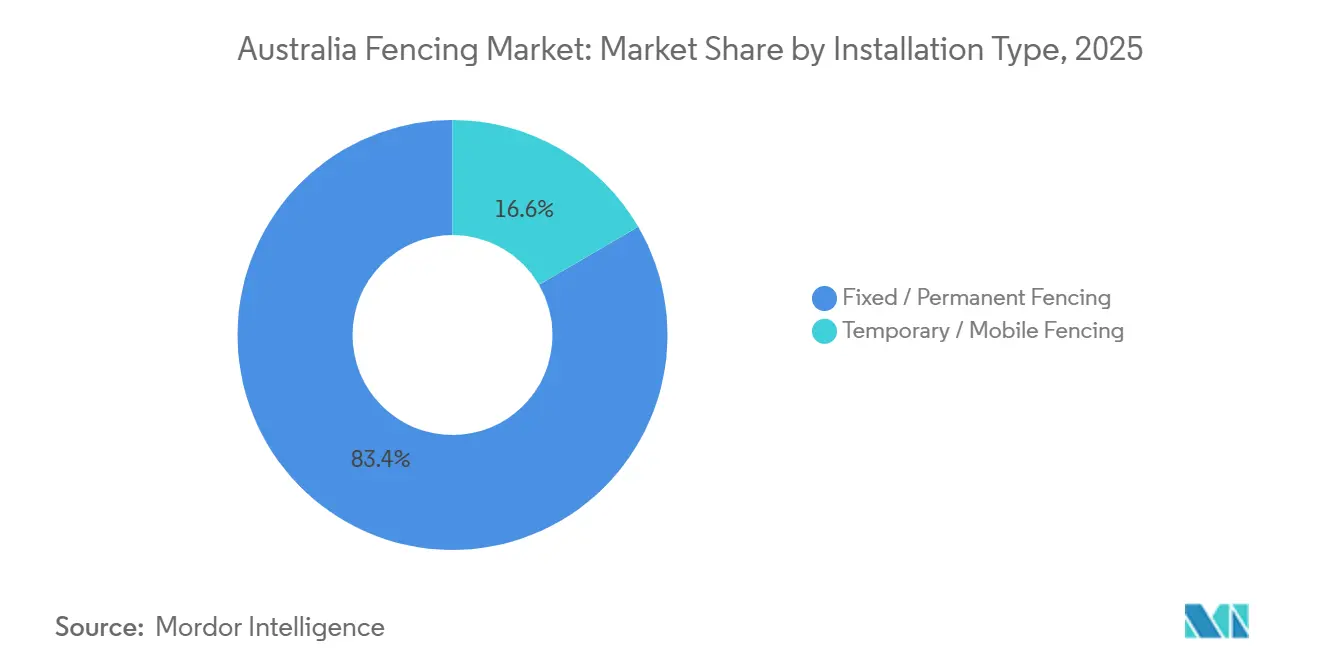
- By installation type, fixed or permanent fencing accounted for an 83.4% share of the Australia fencing market share in 2025, while temporary or mobile fencing is advancing at a 6.3% CAGR through 2031.
- By installation channel, professional contractors held 68.1% of the mix in 2025, while fabricators, distributors, and DIY or modular kits posted the highest projected CAGR at 6.1% through 2031.
- By geography, New South Wales held 29.4% share of Australia fencing market in 2025, while Western Australia is forecast to grow at a 6.7% CAGR through 2031.
Note: Market size and forecast figures in this report are generated using Mordor Intelligence’s proprietary estimation framework, updated with the latest available data and insights as of January 2026.
Australia Fencing Market Trends and Insights
Drivers Impact Analysis*
| Drivers | (~) % Impact on CAGR Forecast | Geographic Relevance | Impact Timeline |
|---|---|---|---|
| Infrastructure and Non-Residential Project Pipeline | +1.5% | National, concentrated in NSW, QLD, SA | Short term (≤ 2 years) |
| Residential Privacy, Boundary, and Pool-Barrier Replacements | +1.2% | National, early gains in WA, SA, QLD | Short term (≤ 2 years), Medium term (2-4 years) |
| Livestock Containment and Feral-Pest Exclusion Programs | +0.9% | QLD, NSW, SA, WA, rural and remote areas | Medium term (2-4 years) |
| Critical-Infrastructure and Data-Centre Perimeter Hardening | +0.8% | NSW, VIC, ACT | Medium term (2-4 years) |
| Renewables, BESS, and Transmission-Site Security Build-Out | +0.7% | NSW, VIC, WA, SA | Medium term (2-4 years), Long term (≥ 4 years) |
| Roadside Pedestrian-Barrier and Cycleway Safety Retrofits | +0.4% | National, early gains in NSW, QLD | Short term (≤ 2 years) |
| Source: Mordor Intelligence | |||
Infrastructure and Non-Residential Project Pipeline
The Australia fencing market is seeing its clearest near-term demand support from the AUD 242 billion (USD 154.9 billion) major public infrastructure pipeline, which expanded 14% in one year[1]Infrastructure Australia, “Annual Budget Statement 2026,” Infrastructure Australia, infrastructureaustralia.gov.au. Transport infrastructure alone accounts for AUD 129 billion (USD 82.6 billion) of that pipeline, and road corridors, rail links, depots, and logistics precincts all require perimeter fencing, work-zone barriers, and permanent safety installations. Queensland is adding another layer of demand because its four-year infrastructure allocation has expanded by 65% since 2022-23, with Brisbane 2032 preparations pushing forward fencing procurement in South East Queensland. Utilities spending is also becoming more fencing-intensive, as the single-year increase to AUD 36 billion (USD 23 billion) was largely driven by electricity transmission projects that require long linear runs of secured corridor fencing. This matters for the Australia fencing market because linear infrastructure consumes larger fence volumes per dollar of project value than many building projects. It also supports demand visibility for fabricators and installers that can serve government and utility buyers at scale across multiple states.
Residential Privacy, Boundary, and Pool-Barrier Replacements
Residential privacy, boundary, and pool-barrier replacements are supporting the Australia fencing market across a broad national base, with earlier gains visible in Western Australia, South Australia, and Queensland. The residential segment already accounted for 41.3% of total end-user demand in 2025, providing a strong base for replacement activity across suburban and peri-urban locations. Total dwelling commencements rose 26.1% from December 2024 to December 2025, sustaining demand for new boundary fencing as newly built homes move toward occupation. At the same time, the projected shortfall of 262,000 homes against the National Housing Accord target suggests that housing pressure will continue to support replacement and upgrade work through the medium term. Pool-barrier replacement remains a steady part of this demand because detached housing stock in growth corridors continues to require compliant perimeter solutions rather than cosmetic upgrades alone.
Livestock Containment and Feral-Pest Exclusion Programs
The Australia fencing market has another reliable support base in exclusion fencing programs, which are funded through government channels and are less exposed to interest-rate changes. New South Wales committed AUD 14.7 million (USD 9.4 million) to feral pig and pest control in 2025-26, and the state completed a 32 km gap in the Western NSW Wild Dog Fence in August 2025 to reconnect a 2,700 km structure[2]NSW Government, “Minns Government Completes Critical Gap in Western NSW Wild Dog Fence,” NSW Government, nsw.gov.au. Queensland also kept this channel active, with AUD 3 million (USD 2 million) in exclusion fencing grants deployed through October 2025 and the AUD 105 million (USD 67.2 million) Exclusion Fence Restitution Program remaining open through June 30, 2026, after the March 2025 flooding. These programs create a floor under rural materials demand because fencing reinstatement is now a named and fundable line item in recovery budgets. They also broaden demand beyond new construction by supporting replacement cycles in remote areas where climatic and pest pressures recur. That makes government-backed rural work one of the more stable parts of the forecast for the Australia fencing market.
Critical Infrastructure and Data-Centre Perimeter Hardening
The Australia fencing market is also gaining a higher-specification demand pocket from critical infrastructure and data-centre projects that are not tightly tied to the housing cycle. Physical security guidance from the Australian Signals Directorate sets barrier expectations for higher-sensitivity facilities, which supports anti-climb mesh, hybrid palisade, and vehicle-resistant formats. NEXTDC’s Canberra facility shows how this demand is being specified, as the site was purpose-built to Protective Security Policy Framework (PSPF) and Security Construction and Equipment Committee (SCEC) construction standards. Suppliers that can document testing and compliance are better positioned in these tenders, which is why certified systems such as DooMAX VRF are more relevant in government and sensitive-facility procurement. This is shifting part of the market toward technically validated products rather than price-led commodity supply. It also helps explain why premium security fencing is gaining share within the Australia fencing market even when construction conditions remain cost-sensitive elsewhere.
Restraints Impact Analysis*
| Restraints | (~) % Impact on CAGR Forecast | Geographic Relevance | Impact Timeline |
|---|---|---|---|
| Steel, Aluminum, Timber, and Freight Cost Volatility | -1.1% | National, amplified in remote and regional areas | Short term (≤ 2 years) |
| Installer Labour Shortages and Subcontractor Inflation | -0.9% | National, most acute in regional and remote areas | Medium term (2-4 years) |
| Remote-Site Logistics and Maintenance Economics | -0.5% | WA, NT, remote QLD, SA | Medium term (2-4 years) |
| State-by-State Approvals and Compliance Complexity | -0.4% | National, most acute in multi-state projects | Long term (≥ 4 years) |
| Source: Mordor Intelligence | |||
Steel, Aluminium, Timber, and Freight Cost Volatility
Input-cost volatility is the most immediate margin pressure point in the Australia fencing market. Steel suppliers raised construction product prices by up to 15% in Q1 2026 after Middle East fuel and freight disruptions, which pushed through to fencing inputs used in residential, agricultural, and infrastructure work. The April 2026 increase in anti-dumping tariffs on Chinese reinforcing bars from 19% to 24% reduced the import-price ceiling that had previously limited domestic price escalation. Aluminum prices were also up 25% year on year to January 2026, adding further pressure to manufacturers focused on pool fencing, coastal products, and architectural systems. Freight remains another squeeze point because diesel prices spiked 41% in March 2026, which lifts rural and remote delivery costs more sharply than metro costs. This combination matters most where volume demand is strongest, because mining, agriculture, and regional renewables all depend on transporting heavy materials over long distances.
Installer Labour Shortages and Subcontractor Inflation
The Australia fencing market is also constrained by a workforce gap that is structural rather than temporary. Infrastructure Australia projected a peak shortage of 300,000 construction workers by 2027, and regional shortfalls were expected to quadruple between 2025 and 2027. These are the same areas where agricultural exclusion fencing, mine perimeters, and renewable energy site preparation are expanding most quickly. The Wage Price Index rose 3.4% annually to December 2025, while subcontractor expectations were running above 4% in major cities, which keeps installation costs elevated. A practical response is already visible in the shift toward pre-fabricated and modular systems that reduce on-site labor intensity. This means part of the demand in the Australia fencing market will increasingly favor deliverability and installation speed over purely lowest upfront material cost.
*Our forecasts treat driver/restraint impacts as directional, not additive. The impact forecasts reflect baseline growth, mix effects, and variable interactions.
Segment Analysis
By Material: Metal Dominates, Recycled Composites Rewrite Lifecycle Economics
Metal fencing accounted for 57.2% of the material segment in 2025, giving it the largest position in the Australia fencing market by material demand. Steel remained strongest in agricultural boundaries, mining perimeters, and roadside safety applications, while aluminum held a firmer position in residential pool fencing and coastal boundary installations, where corrosion resistance matters more. Plastic & composite fencing is projected to expand at a 6.5% CAGR through 2031, making it the fastest-growing material group in the Australia fencing market. Recycled Polyvinyl Chloride (PVC) and wood-plastic composite products are gaining traction because suppliers are positioning them around service life, low maintenance, and sustainability procurement requirements rather than only upfront price. Wood retained a meaningful role in garden and privacy fencing, while concrete continued to serve niche acoustic and heavy-boundary uses linked to transport and commercial settings.
The Australia fencing industry is also seeing local supply capacity improve in recycled-content formats, which reduces dependence on imported composite systems. Think Manufacturing partnered with the Commonwealth Scientific and Industrial Research Organization (CSIRO) to convert post-industrial PVC waste into fencing components, and Advanced Plastic Recycling stated that it can produce up to 7,000 Wood-Plastic Composite (WPC) posts each week while consuming 42 tonnes of recycled plastic. That domestic supply development matters because public buyers working under embodied-carbon and recycled-content requirements need compliant local options. Longer service life and lower maintenance requirements are making composite products more relevant in commercial, council, and government replacement cycles through 2031. The material mix is therefore shifting slowly, but the change is concentrated in higher-value replacement work where lifecycle performance carries more weight than the cheapest initial purchase.


By End-User: Residential Anchors Volume, Mining Drives Premium Demand
Residential demand accounted for 41.3% of total end-user demand in 2025, which made it the largest demand base in the Australia fencing market size by end use. Pool-barrier replacement, suburban boundary work, and population growth in Western Australia, South Australia, and South East Queensland kept this segment broad and active. Mining is projected to expand at a 7.0% CAGR through 2031, making it the fastest-growing end-user segment in the Australia fencing market. Western Australia remains central to that growth because private capital expenditure in the state rose 9.7% year on year to December 2025, while Rio Tinto’s supplier spend in Western Australia reached AUD 12.1 billion (USD 7.9 billion) in 2025. Rio Tinto’s mine development activity at Western Range, Brockman Syncline 1, Hope Downs 2, and West Angelas supports recurring demand for perimeter, exclusion, and construction-zone fencing.
Agriculture continues to benefit from public funding support that acts as a demand floor rather than a purely cyclical project stream. Queensland’s AUD 105 million (USD 67.2 million) restitution program and NSW’s AUD 14.7 million (USD 9.4 million) pest control budget support direct materials procurement even when private construction conditions soften. Energy and power projects bring a quality premium because utility-scale solar farms and Battery Energy Storage System (BESS) sites specify chain-mesh steel fencing with CCTV integration as a standard security layer. Commercial, industrial, government, and sports infrastructure demand broadly follows the public infrastructure pipeline, while oil and gas activity remains a steadier contributor in Western Australia and the Northern Territory. This mix keeps end-user exposure diversified even though mining is setting the fastest growth pace in the Australia fencing market.
By Installation Type: Permanent Dominates Volume, Temporary Accelerates in Project Segments
Fixed / permanent fencing accounted for 83.4% of installation volume in 2025, which shows how much of the Australia fencing market is tied to long-life boundary, security, and public asset applications. Agricultural boundaries, urban residential perimeters, industrial security barriers, and government-owned assets all sit on replacement cycles that usually extend well beyond a single construction season. Temporary / mobile fencing is projected to advance at a 6.3% CAGR through 2031, making it the fastest-growing installation type in the Australian fencing market. Demand is concentrated in renewable energy site preparation, construction safety compliance, remote mining activities, and pest-management programs that require fencing before permanent assets are completed. The location of this demand is shifting inland as mine openings, renewable zones, and recovery works move activity outside metropolitan areas.
The Australia fencing industry is adapting to labor constraints through product design, not only through pricing. Waratah’s Flex Rail system, launched in December 2025 and made from 100% recycled plastic, was explicitly positioned around faster and lighter installation[3]FCANZ, “Choose Style and Quality With the Waratah Flex Rail System,” FCANZ, fcanz.org.nz. That product direction shows that temporary and modular formats are benefiting from workforce shortages because they reduce crew size and time on site. As infrastructure and safety compliance spending grows, temporary fencing procurement per project dollar is improving even when the broader pace of project starts is uneven. This gives the faster-growing sub-segment a structural support base inside the Australia fencing market rather than a purely short-lived project effect.

By Installation Channel: Professionals Lead on Specification, Fabricators and DIY Gain Share
Professional contractors accounted for 68.1% of the installation channel mix in 2025, reflecting compliance and licensing requirements for exclusion fencing, security perimeters, and pool-safety barriers. The channel retained leadership because many projects still require state approvals, installation experience, and documented compliance. The others segment is projected to grow at a 6.1% CAGR through 2031, making it the fastest-growing route to market in the Australian fencing market. Online specification tools and pre-configured systems are helping homeowners and smaller buyers order complete solutions with less dependence on contractor-led design. This channel is gaining share because pre-fabricated systems are easier to deliver in a tight labor market, not simply because the products are cheaper per unit.
The Australia fencing industry is becoming more polarized by specification level across these channels. High-specification formats such as crash-rated vehicle-resistant fencing, anti-climb security mesh, and multi-strand agricultural exclusion systems still favor professional installation and preserve contractor relevance. Standard residential and light-commercial products are moving toward direct distribution and modular purchases, where price transparency is higher and margins are thinner. This split supports distributors that combine local stock availability with technical guidance rather than competing only on list price. It also reinforces the broader divide inside the Australia fencing market between commodity products and premium specified systems.
Geography Analysis
New South Wales (NSW) held 29.4% of demand in 2025, which made it the largest regional contributor to the Australia fencing market. The state’s demand base stays broad because infrastructure, residential, and commercial activity all remain concentrated there. The Housing Delivery Authority had progressed more than 79,000 potential homes through streamlined pathways by August 2025, which kept boundary and pool-barrier demand active even though housing delivery still lagged the national target. NSW also has a larger concentration of data center and substation projects around Western Sydney, which raises average project value because these sites require higher-specification anti-climb and vehicle-resistant perimeters. The joint AUD 822 million (USD 534.3 million) NSW Road Safety Program adds another steady procurement channel through roadside barrier and pedestrian fencing works.
Victoria and Queensland ranked behind New South Wales, but the demand drivers in those states are different. Victoria’s AUD 71.6 billion (USD 46.5 billion) four-year infrastructure pipeline remains weighted toward urban transport megaprojects, which support civil works, fencing, and construction-zone requirements over a long delivery window. Queensland’s pipeline has grown faster since 2022-23, and Brisbane 2032 preparations are bringing forward a time-bound procurement cycle across public works and related facilities. Queensland also has a rural buffer through exclusion fencing and recovery programs, which means public funding can support demand when flood or pest pressures intensify. Western Australia is the fastest-growing geography at 6.7% CAGR through 2031, supported by resource-sector activity, renewable planning, and construction cost inflation that lifts market value in dollar terms.
South Australia, Tasmania, the Northern Territory, and the Australian Capital Territory accounted for the balance of national demand in the Australia fencing market. South Australia (SA) is moving through an earlier infrastructure build phase, and its agricultural demand has also been supported by the NSW and SA agreement to build a further 290 km of border dog fencing. The Northern Territory has very high per-capita infrastructure funding, and much of that exposure sits in defense and industrial precincts where security-grade fencing specifications are more common. The Australian Capital Territory (ACT) and Tasmania are more dependent on maintenance and replacement cycles in the near term, although the ACT still consumes a higher share of premium security products because of its federal and data-centre footprint.
Competitive Landscape
The Australia fencing market remains fragmented, with competition spread across domestic wire and panel manufacturers, security specialists, rural supply networks, and newer composite-material suppliers. No single company holds a dominant national position across all product categories, which keeps pricing and channel power dispersed. Large domestic manufacturers such as Southern Wire and Cyclone Products benefit from broader distribution reach and upstream wire capabilities, which matter in a market where freight is a material part of delivered cost. Southern Wire’s five distribution centers across Adelaide, Darwin, Melbourne, Perth, and Sydney give it fulfillment advantages in a geographically spread market. Waratah’s partnership with Nutrien Ag Solutions strengthens its access to remote pastoral markets, where service reach and stock availability often matter more than list price alone.
Security-focused suppliers are differentiating themselves through compliance and tested performance rather than solely on volume. Doogood Australia’s DooMAX VRF system passed International Organization for Standardization (ISO) and ASTM International (formerly American Society for Testing and Materials) (ASTM) crash-test standards in 2025, strengthening its position in government, defense, and critical infrastructure tenders. Clipex also pushed product differentiation in 2025 with TwinTip posts and ULTRA-SHIELD coating, aiming at longer below-ground life in agricultural and infrastructure environments. Those moves show that product life, warranty confidence, and installation performance are active competitive levers inside the Australia fencing market. Clipex has also supported channel digitization through online configuration tools that make complete-system specification easier for non-contractor buyers.
Composite and recycled-plastic suppliers are building a visible challenger position. Think Fencing’s recycled PVC development work with CSIRO and EnduraPost’s recycled-content positioning are aimed at buyers looking for sustainability credentials and lower maintenance cycles. The white space remains clearest in regional logistics and technical field support, where reliable delivery and project guidance still command a premium. This means competitive advantage in the Australia fencing market is increasingly tied to service reach, certified performance, and product formats that reduce installation friction, not only to raw manufacturing scale.
Australia Fencing Industry Leaders
Protective Fencing Pty Ltd
Waratah Fencing
Whites Rural
Clipex
Superior Fences Group
- *Disclaimer: Major Players sorted in no particular order

Recent Industry Developments
- May 2026: The AUD 105 million (USD 67.2 million) program, jointly funded by the Australian and Queensland Governments under Disaster Recovery Funding Arrangements, provides grants of up to AUD 500,000 per enterprise (USD 320,000) to rebuild exclusion and cluster fencing damaged by the March 2025 Western Queensland flooding, with works completion required by March 31, 2027.
- April 2026: The tariff increased from 19% to 24% following an Anti-Dumping Commission determination, structurally raising steel fencing input costs and limiting low-cost import relief, economists warned of broader construction-cost and inflation consequences.
- March 2026: The dual-standard certification enables Doogood to compete in government, defence, and critical-infrastructure tenders where vehicle-resistant fencing is mandated under the Protective Security Policy Framework.
- January 2026: Made from 100% recycled plastic, the UV-resistant, electrifiable horse and rural-boundary fencing system is designed for faster, crew-light installation, expanding Waratah's sustainable product portfolio.


Australia Fencing Market Report Scope
The Australia Fencing Market is Segmented by Material (Metal, Wood, Plastic & Composite, Concrete, and Other Materials), End-User (Residential, Agricultural, Military & Defense, and more), Installation Type (Fixed / Permanent Fencing and Temporary / Mobile Fencing), Installation Channel (Professional Contractor and Others), and Geography (New South Wales, and more). The Market Forecasts are Provided in Terms of Value (USD).
| Metal | Steel |
| Aluminium | |
| Wood | |
| Plastic & Composite | |
| Concrete | |
| Other Materials |
| Residential |
| Agricultural |
| Military & Defense |
| Government |
| Mining |
| Oil, Gas & Chemicals |
| Energy & Power |
| Commercial & Industrial |
| Sports & Public Infrastructure |
| Other End-Users |
| Fixed / Permanent Fencing |
| Temporary / Mobile Fencing |
| Professional Contractor |
| Fabricators, Distributors & DIY / Modular Kits |
| New South Wales |
| Victoria |
| Queensland |
| Western Australia |
| Rest of Australia |
| By Material | Metal | Steel |
| Aluminium | ||
| Wood | ||
| Plastic & Composite | ||
| Concrete | ||
| Other Materials | ||
| By End-User | Residential | |
| Agricultural | ||
| Military & Defense | ||
| Government | ||
| Mining | ||
| Oil, Gas & Chemicals | ||
| Energy & Power | ||
| Commercial & Industrial | ||
| Sports & Public Infrastructure | ||
| Other End-Users | ||
| By Installation Type | Fixed / Permanent Fencing | |
| Temporary / Mobile Fencing | ||
| By Installation Channel | Professional Contractor | |
| Fabricators, Distributors & DIY / Modular Kits | ||
| By Geography | New South Wales | |
| Victoria | ||
| Queensland | ||
| Western Australia | ||
| Rest of Australia |


Key Questions Answered in the Report
What is the current size of the Australia fencing sector?
The Australia fencing market stands at USD 0.94 billion in 2026 and is forecast to reach USD 1.24 billion by 2031 at a 5.7% CAGR over 2026-2031.
Which material category leads demand in Australia?
Metal fencing led material demand with a 57.2% share in 2025, supported by agricultural, mining, and infrastructure applications.
Which end-user group is growing the fastest in Australia?
Mining is the fastest-growing end-user segment, with a projected 7.0% CAGR through 2031, supported by ongoing mine development and supplier spending in Western Australia.
Which state contributes the most demand for fencing products?
New South Wales led geographic demand with a 29.4% share in 2025 because of its large infrastructure pipeline, housing activity, and concentration of premium security projects.
Page last updated on:


