Australia Data Center Power Market Size and Share
Market Overview
| Study Period | 2020 - 2031 |
|---|---|
| Forecast Data Period | 2026 - 2031 |
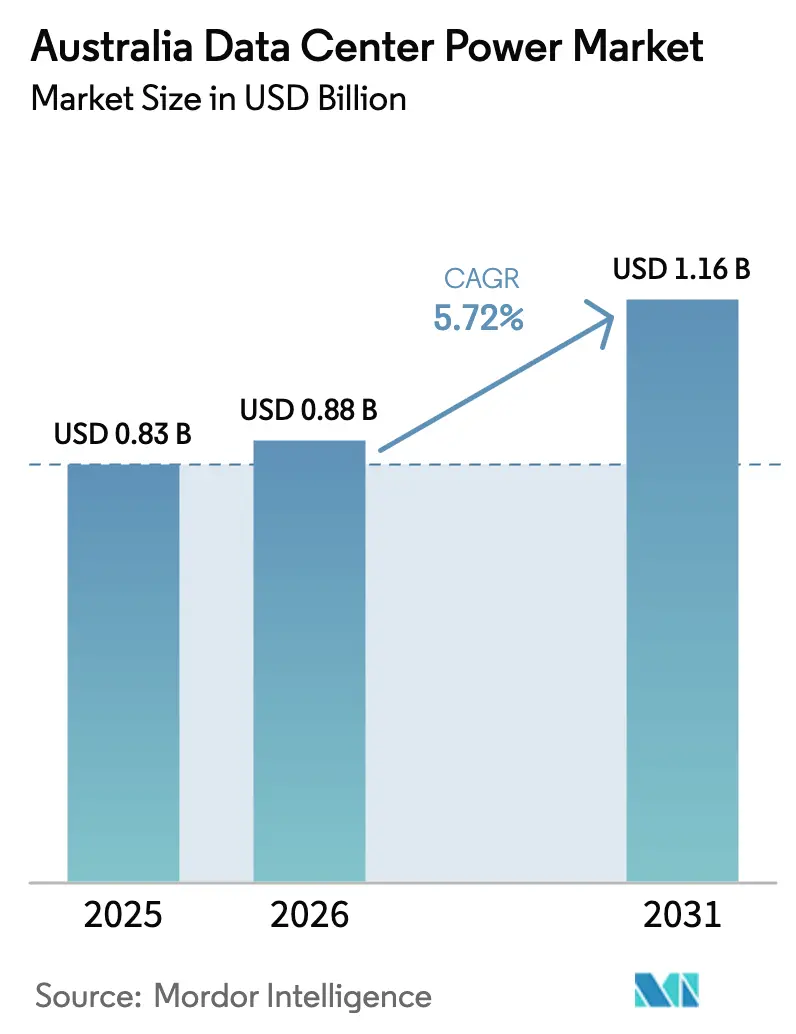
| Base Year Market Size (2025) | USD 0.83 Billion |
| Market Size (2026) | USD 0.88 Billion |
| Market Size (2031) | USD 1.16 Billion |
| Growth Rate (2026 - 2031) | 5.72% CAGR |
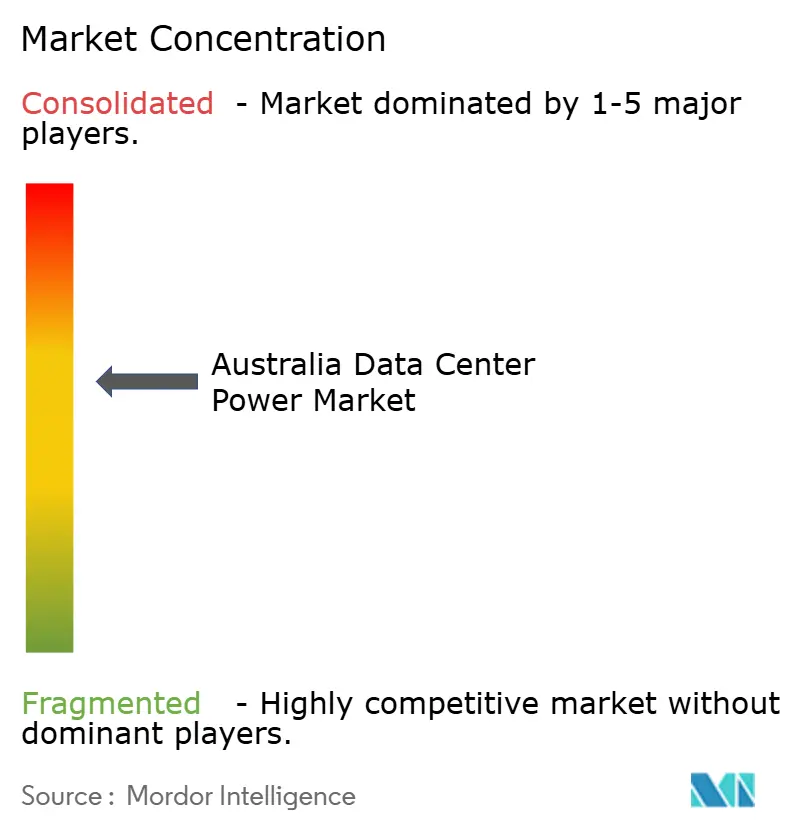
| Market Concentration | Medium |
Major Players *Disclaimer: Major Players sorted in no particular order Image © Mordor Intelligence. Reuse requires attribution under CC BY 4.0. | |
Australia Data Center Power Market Analysis by Mordor Intelligence
The Australian data center power market size was valued at USD 0.83 billion in 2025 and estimated to grow from USD 0.88 billion in 2026 to reach USD 1.16 billion by 2031, at a CAGR of 5.72% during the forecast period (2026-2031). Robust growth stems from artificial-intelligence workloads, rapid cloud adoption, and Australia’s positioning as a secure regional hub for Asia-Pacific data flows. Amazon’s 2025-2029 plan to spend USD 13 billion on local capacity highlights the long-term demand profile. Operators are redesigning electrical infrastructure as rack loads surge from 5-10 kW toward 80-100 kW, accelerating uptake of lithium-ion UPS systems and direct-to-chip cooling solutions. Strong policy support also matters; new “very-fast” frequency-control markets introduced by the Australian Energy Market Operator (AEMO) let data centers earn revenue from grid-interactive UPS fleets. Transmission build-outs inside Renewable Energy Zones improve access to clean power, but wholesale price volatility and urban network congestion remain headwinds.
Key Report Takeaways
- By component, UPS systems led with 31.68% of the Australia data center power market share in 2025; power distribution units record the fastest 8.21% CAGR through 2031.
- By data-center type, colocation providers held 48.60% revenue share in 2025, while hyperscale/cloud operators post the highest 8.76% CAGR to 2031.
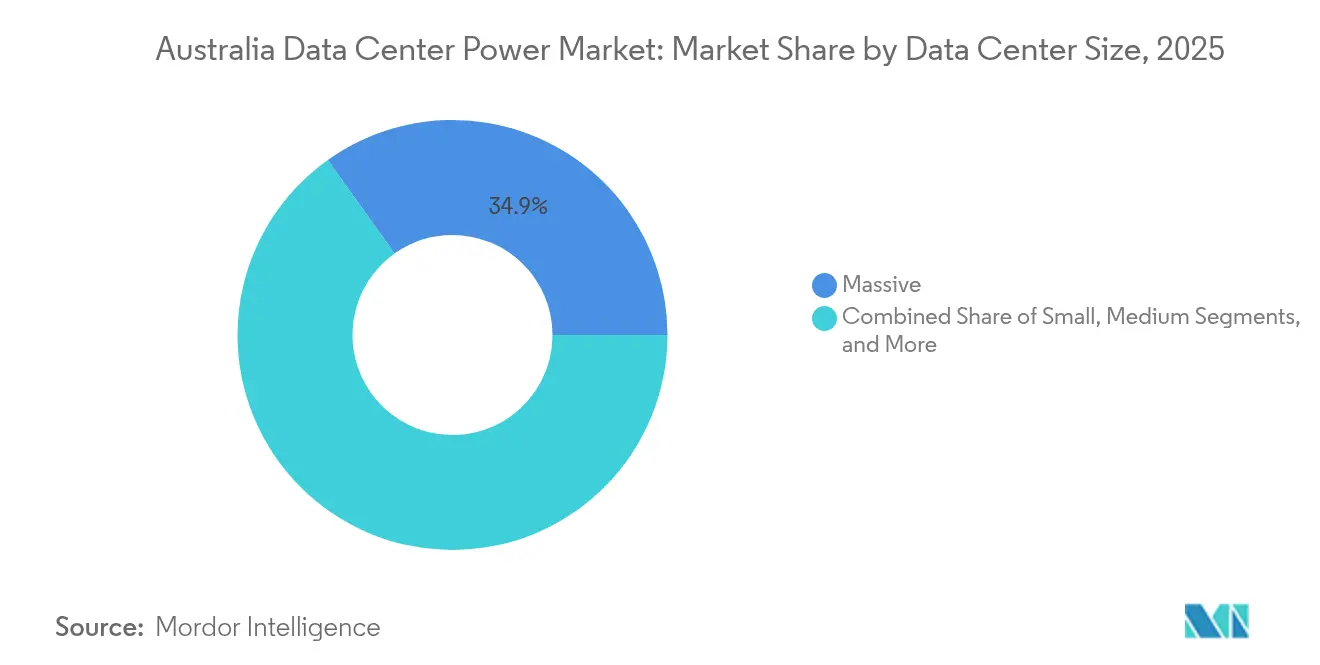
- By size, massive facilities accounted for 34.85% of the Australia data center power market size in 2025 and mega sites expand at a 9.85% CAGR over 2026-2031.
- By tier level, Tier III facilities dominated with 73.90% share in 2025; Tier IV capacity grows fastest at an 8.12% CAGR.
Note: Market size and forecast figures in this report are generated using Mordor Intelligence’s proprietary estimation framework, updated with the latest available data and insights as of 2026.
Australia Data Center Power Market Trends and Insights
Drivers Impact Analysis*
| Driver | (~)% Impact on CAGR Forecast | Geographic Relevance | Impact Timeline |
|---|---|---|---|
| Rising adoption of mega-data centres and cloud computing | +1.8% | National, with concentration in Sydney, Melbourne, Brisbane | Medium term (2-4 years) |
| Surge in AI / GPU-dense workloads raising rack-power densities | +2.1% | National, with early adoption in hyperscale facilities | Short term (≤ 2 years) |
| Grid-interactive "smart-UPS" participation in NEM ancillary-services markets | +0.7% | National, with higher uptake in grid-constrained areas | Medium term (2-4 years) |
| Government fast-tracking Renewable-Energy-Zone transmission build-outs | +1.2% | Queensland, New South Wales, Victoria | Long term (≥ 4 years) |
| Corporate PPAs and 24/7 clean-power targets by hyperscalers | +0.9% | National, with focus on renewable-rich states | Medium term (2-4 years) |
| Falling lithium-ion UPS battery costs enabling higher discharge cycles | +0.6% | National | Short term (≤ 2 years) |
| Source: Mordor Intelligence | |||
Rising adoption of mega-data centres and cloud computing
Operators are clustering workloads inside 100-plus-MW campuses that deliver lower per-rack energy costs and streamlined operations. NEXTDC committed USD 2 billion for a Victorian technology hub engineered for AI training clusters and liquid-cooling loops. Equinix is extending cabinet count at its SY5 and ME2 sites to support customers requiring above-30 kW racks. Consolidating load in fewer buildings concentrates demand on specific substations, spurring utilities to offer bespoke high-voltage feeds. Vendors respond with factory-assembled medium-voltage skids that reduce on-site work and shorten energisation schedules. Mega campuses also catalyse on-site battery-storage adoption because frequency-control revenues improve project economics inside the National Electricity Market.
Surge in AI/GPU-dense workloads raising rack-power densities
AI inference and training clusters are shifting average rack loads to 80-100 kW, forcing a pivot from low-voltage branch circuits toward busway architecture and 800 V DC power trains. Delta Electronics presented 33 kW shelf solutions optimised for NVIDIA Blackwell accelerators alongside prefabricated 1.7 MW power trains at COMPUTEX 2024.[1]Delta Electronics, “Delta Showcases AI-Optimised Data Center Solutions at COMPUTEX 2024,” Operators such as NEXTDC joined the NVIDIA DGX-Ready Data Center program, ensuring floor layouts, cooling and electrical paths align with high-density guidance. The trend accelerates adoption of direct-liquid and rear-door-heat-exchanger cooling, which in turn requires redundant pump loops integrated into UPS switchboards for Tier IV compliance. Higher density raises fault-current levels, so switchgear specifications are shifting toward arc-flash containment designs verified to IEC 62271.
Grid-interactive “smart-UPS” participation in NEM ancillary-services markets
Lithium-ion UPS blocks already installed for IT resiliency can now provide sub-50-millisecond frequency support. AEMO launched “very-fast raise” and “very-fast lower” services in late 2023, paying assets able to deliver power within two seconds.[2]Australian Energy Market Operator, “Very Fast Frequency Control Ancillary Services Implementation,” aemo.com.au Data-center operators with bidirectional inverters gain a revenue hedge against rising network tariffs. Siemens estimates that modular 4 MW UPS strings cycled for 15 minutes daily still retain 80% capacity after 10 years, aligning with common lease terms. Participation also improves sustainability credentials because dispatchable batteries help integrate wind and solar generation by managing frequency excursions.
Government fast-tracking Renewable-Energy-Zone transmission build-outs
The 2024 Queensland SuperGrid blueprint maps 1,500 km of new 500 kV lines connecting onshore wind, solar, and pumped hydro to coastal demand centres. New South Wales issued Long-Term Energy Service Agreements for 1 GW of long-duration storage, lowering financing hurdles for plants that underpin data-center reliability.[3]AEMO Services, “NSW Long-Duration Storage Tender Results Announced,” aemoservices.com.au While transmission timelines stretch beyond 2029, developers have already secured land near REZ hubs to tap a 100% renewable supply and avoid congested CBD feeders. GE Vernova will integrate battery-energy-storage at Queensland’s Supernode project, illustrating how OEMs stack grid-forming capabilities on top of bulk storage to stabilise voltage during low-inertia periods. Cost overruns on flagship interconnectors remain a concern, yet operators view proximity to REZ backbones as a hedge against carbon-pricing risk.
Restraints Impact Analysis*
| Restraint | (~) % Impact on CAGR Forecast | Geographic Relevance | Impact Timeline |
|---|---|---|---|
| High cost of installation and maintenance | -1.4% | National, with higher impact in urban areas | Medium term (2-4 years) |
| Constrained urban distribution-grid capacity in Sydney and Melbourne CBDs | -0.8% | Sydney, Melbourne metropolitan areas | Short term (≤ 2 years) |
| Tight domestic diesel supply and Tier IV redundancy requirements | -0.5% | National, with acute impact on Tier IV facilities | Short term (≤ 2 years) |
| Rising wholesale electricity prices and network charges despite renewable build-out | -0.7% | National, with regional variations | Medium term (2-4 years) |
| Source: Mordor Intelligence | |||
High cost of installation and maintenance
Lithium-ion UPS packs priced at USD 280-580 per kWh installed inflate the capex line item for new builds. Modular medium-voltage skids introduced by Siemens aim to slash field labour by 60% and mitigate a persistent electrician shortage. Component inflation is acute: copper reached a decade high in 2025, raising bus-duct costs; semiconductor scarcity extends lead times for IGBT inverter stacks. The Australian Energy Regulator reported a 19.7% real-term rise in electricity-network capex for 2024, signalling broader pricing pressure on switchgear and cabling. Operators therefore renegotiate power-purchase agreements to lock in long-run electricity costs that offset higher upfront spend.
Constrained urban distribution-grid capacity in Sydney and Melbourne CBDs
Central-business-district substations face rising fault-level constraints, limiting new-load connections. Utilities propose demand charges reflecting costly network reinforcements, pushing developers toward outer-metro industrial estates with 330 kV access. Transgrid forecasts 4.8 GW of grid-forming storage is required in New South Wales to keep system strength above minimum-fault levels when coal units retire. Operators respond with on-site solar-plus-battery microgrids that shave peak demand and reduce connection-application timelines. Elevated network tariffs-nearly 45% of a typical bill-accentuate the financial case for behind-the-meter generation integrated with UPS strings that already deliver black-start capability.
*Our forecasts treat driver/restraint impacts as directional, not additive. The impact forecasts reflect baseline growth, mix effects, and variable interactions.
Segment Analysis
By Component: UPS Systems Lead Amid Density Revolution
UPS systems captured 31.68% of the Australia data center power market share in 2025 because uninterrupted runtime is non-negotiable for mission-critical workloads. Lithium-ion chemistries deliver higher temperature tolerance and 50-80% smaller footprints than valve-regulated lead-acid, freeing white space for revenue-generating IT racks. Vendors project these batteries will own 40% of the global data-center UPS fleet by 2025. Switchgear and remote-power panels track density growth by shifting from 415 V to 22 kV internal rings that minimise copper runs. Generators remain essential, highlighted by Caterpillar producing its 10,000th C175 engine for data-center duty in 2025.
Power-distribution units are the fastest-growing component at an 8.21% CAGR because AI loads need granular per-outlet metering and branch-circuit monitoring. Their smart firmware feeds energy-use data into ISO 50001 certification audits, aligning with hyperscaler sustainability scorecards. Energy-storage systems respond to frequency-control demand, with installed costs falling near USD 280 per kWh, making grid-interactive deployments profitable within five years of revenue stacking. Switches and transfer gear adopt solid-state technology that eliminates mechanical wear and cuts transfer time below 4 milliseconds, meeting Tier IV expectations.


By Data Center Type: Colocation Strength Meets Hyperscale Expansion
Colocation providers accounted for 48.60% of 2025 revenue, reflecting enterprises that outsource facilities management while retaining control over their equipment. NEXTDC offers 100% uptime Service Level Agreements (SLAs), supported by substantial investments in Australia’s data center power infrastructure, including dual-active power feeds and concurrently maintainable cooling systems. Hyperscalers grow at 8.76% CAGR as cloud consumption accelerates; Amazon’s USD 13 billion outlay funds multiple availability zones and three solar farms delivering 170 MW of renewable capacity. Edge and enterprise footprints remain relevant for latency-sensitive applications tied to national security or stock market colocation.
Competitive boundaries blur as colocation firms retrofit halls for 40 kW racks to court AI tenants, while hyperscalers lease entire buildings within multi-tenant campuses to accelerate go-live dates. AirTrunk’s AUD 24 billion sale to Blackstone illustrates global capital rotating into scalable Asia-Pacific platforms capable of deploying 150 MW per site. The Australia data center power industry increasingly rewards operators that guarantee green-power sourcing via sleeved PPAs and demonstrate roadmap alignment with Scope 3 emissions disclosures.
By Data Center Size: Massive Facilities Dominate While Mega Scale Emerges
Massive facilities delivered 34.85% of the 2025 spend because the 20-40 MW bracket balances utilisation risk and connection-approval speed. NEXTDC’s S2 Sydney runs 30 MW IT capacity on a Tier IV topology, giving financial services clients fault-tolerant hosting while remaining within CBD latency budgets. Mega facilities above 80 MW record a 9.85% CAGR through 2031 as AI model-training farms require contiguous land parcels and high-voltage feeders.
These mega builds redefine the Australia data center power market. Operators favour greenfield REZ sites where 500 kV lines intersect land priced below AUD 200 per sqm. Prefabricated 20-ft container power rooms speed schedule while allowing parallel civil works. The Australia data center power market size for mega sites is projected to exceed USD 432.7 million by 2031, driven by single-campus capital intensity that often exceeds USD 6 million per MW installed. Large facilities in the 5-20 MW class persist for regional redundancy and public-sector compliance, but small and medium footprints decline as workloads consolidate.
By Tier Level: Tier III Standard Meets Tier IV Innovation
Tier III facilities held 73.90% share in 2025, providing concurrent maintainability at acceptable capex. Twin utility feeds, N+1 UPS blocks and water-cooled chillers give predictable availability without the duplicate distribution paths mandated by Tier IV. NEXTDC’s Adelaide A1 site became the state’s first Tier IV certification in 2024, joining S2 Sydney in offering fault-tolerant topology where every component is dual-active. Customers running AI-inference for autonomous-vehicle simulations or high-frequency trading tolerate no interruptions, validating an 8.12% CAGR for Tier IV builds through 2031.
Australia data center power market share advantages accrue to operators that blend Tier IV resilience with sustainability. Caterpillar and Microsoft demonstrated a hydrogen fuel-cell generator stack delivering 99.999% uptime across a three-day grid-outage simulation in 2024, showing a realistic path to diesel displacement. Tier I and II footprints shrink as SaaS adoption lets small enterprises decommission on-premises rooms, reinforcing a two-tier structure dominated by concurrently maintainable and fault-tolerant campuses.
Geography Analysis
Sydney remains the primary interconnection hub, anchored by subsea cables such as Southern Cross NEXT and Google’s Topaz, and by NEXTDC’s flagship network-dense facilities. Ongoing urban-feeder constraints, however, nudge new capacity toward Western Sydney precincts with 330 kV access. The Australian Energy Regulator’s Q1 2025 market-monitor shows price-spike frequency highest in New South Wales, prompting operators to hedge exposure through renewable power purchase agreements and behind-the-meter batteries.
Melbourne is the second-largest cluster and benefits from state incentives for Renewable-Energy-Zone colocation. NEXTDC is constructing an 80 MW campus in Melbourne’s outer industrial belt that leverages dual 220 kV feeds, while Equinix expands ME2 with advanced immersion-ready cooling to host high-density AI clusters. Victoria’s offshore-wind roadmap, targeting 2 GW by 2032, offers a long-term clean-power hedge that appeals to hyperscalers pursuing 24/7 matching.
Brisbane, Perth, and Adelaide evolve into regional redundancy nodes as network backhaul costs fall. Queensland’s SuperGrid programme promises an 80% renewable share by 2035, and the state’s 2 GW Borumba pumped-hydro project provides synchronous inertia valuable to data-center UPS operators. Western Australia’s South West Interconnected System, with capacity expansions linked to green-hydrogen export projects, draws interest from edge-cloud players needing latency under 20 milliseconds to mining operations. Adelaide leverages Tier IV certification to attract defence and space-sector tenants requiring sovereign-data hosting, capitalising on lower land prices and growing rooftop-solar penetration.
Competitive Landscape
Competition in the Australian data center power market blends global capital with local engineering expertise. NEXTDC commands the premium reliability niche through the only Tier IV network in the Southern Hemisphere, leveraging in-house electrical teams to deliver concurrently maintainable power blocks under 12-month schedules nextdc.com. Equinix differentiates via dense carrier ecosystems and renewable PPAs, recently signing a 151 MW wind-power agreement that lets customers claim carbon-free supply hour by hour.
AirTrunk’s Blackstone-backed platform scales rapidly across Asia-Pacific, bringing procurement leverage that compresses switchgear and transformer prices while standardising on 400 V busways to expedite fleet-wide maintenance. OEM partnerships trend is expected to intensify, for instance, Siemens opened an Asia-Pacific Data-Center Competence Centre in 2024 to localise medium-voltage skid assembly, cutting import lead times by 30%. Caterpillar and Microsoft co-developed hydrogen fuel-cell backup power that integrates with cloud telemetry to pre-warm stacks ahead of forecast storms, offering a diesel-free Tier IV option.
Disruptive entrants include battery-storage integrators bundling trading algorithms with UPS fleets and immersion-cooling start-ups that cut facility PUE below 1.15 at 40 kW per rack. Market share consolidation is gaining pace as pension funds seek inflation-linked returns; Macquarie Asset Management channelled USD 17 billion into Applied Digital and Aligned in 2025, signalling appetite for platforms that can reuse capital across continents. The strategic imperative is clear: operators combine scale economics, grid-interactive technology and renewable sourcing to win AI workloads migrating from legacy enterprise halls.
Australia Data Center Power Industry Leaders
ABB Ltd.
Schneider Electric SE
Vertiv Group Corp.
Eaton Corporation plc
Caterpillar Inc.
- *Disclaimer: Major Players sorted in no particular order

Recent Industry Developments
- January 2025: NEXTDC planned an 80 MW data center build in Melbourne to support high-density computing.
- January 2025: Macquarie Asset Management committed over USD 17 billion to Applied Digital and Aligned Data Centers expansion.
- March 2025: AEMO Services awarded 1 GW/13 GWh of long-duration storage contracts under the NSW Roadmap.
- June 2025: Amazon confirmed a USD 13 billion 2025-2029 investment for Australian AI and cloud capacity.
- June 2025: NEXTDC unveiled a USD 2 billion tech hub in Victoria designed for mega-scale AI training.
- October 2024: NEXTDC acquired the S7 Sydney site, adding 550 MW of potential capacity.


Research Methodology Framework and Report Scope
Market Definitions and Key Coverage
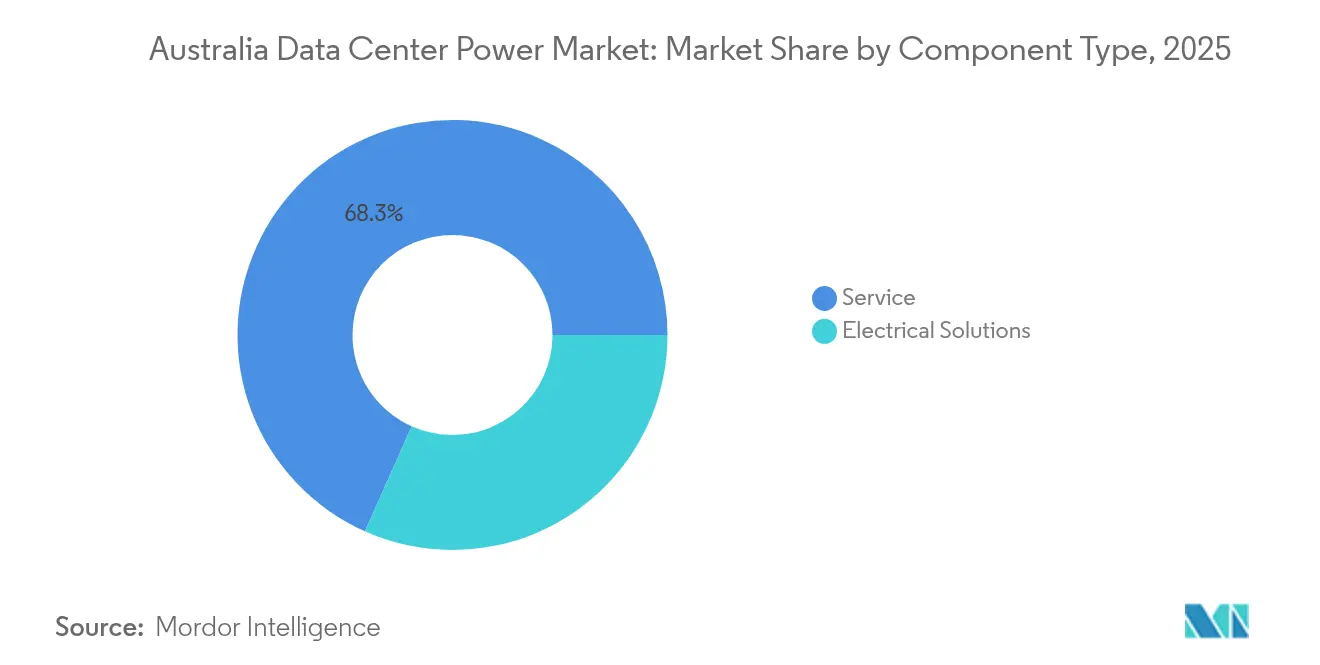
Our study treats the Australia data-center power market as all revenue earned from new electrical infrastructure, UPS systems, generators, power-distribution units, switchgear, busways, and related services that keeps servers running in purpose-built facilities across the country. This scope covers colocation, hyperscale, enterprise, and edge sites, each mapped by size tier and redundancy level.
Scope exclusion: Cooling equipment and facility real-estate costs sit outside this valuation.
Segmentation Overview
- By Component
- Electrical Solutions
- UPS Systems
- Generators
- Diesel Generators
- Gas Generators
- Hydrogen Fuel-cell Generators
- Power Distribution Units
- Switchgear
- Transfer Switches
- Remote Power Panels
- Energy-storage Systems
- Service
- Installation and Commissioning
- Maintenance and Support
- Training and Consulting
- Electrical Solutions
- By Data Center Type
- Hyperscaler/Cloud Service Providers
- Colocation Providers
- Enterprise and Edge Data Center
- By Data Center Size
- Small Size Data Centers
- Medium Size Data Centers
- Large Size Data Centers
- Massive Size Data Centers
- Mega Size Data Centers
- By Tier Level
- Tier I and II
- Tier III
- Tier IV
Detailed Research Methodology and Data Validation
Primary Research
Mordor analysts interviewed electrical engineers at leading colo operators, Australian grid-services aggregators, and OEM channel partners in Sydney, Melbourne, and Perth. Guided conversations validated installed-base counts, typical rack loads, and the realistic pace of lithium-ion adoption, while short surveys with facility managers confirmed average service margins and warranty cycles.
Desk Research
Our desk work began with national datasets, AEMO load forecasts, Clean Energy Regulator renewable-certificate issuances, ABS building approvals, and Customs import codes for HS 8504 and 8502, which anchor shipment counts and project pipelines. Trade groups such as the Australian Data Centre Association and Infrastructure Partnerships Australia provide rack-density trends and investment announcements, while peer-reviewed work in Energy & Buildings clarifies PUE benchmarks. Company filings, press releases, and investor decks enrich site-level capex evidence. Paid libraries like D&B Hoovers, Dow Jones Factiva, and MarkLines (for hyperscale fleet electrification) add financial detail. The list above is illustrative; many other open and subscription sources were tapped for cross-checks and context.
A second sweep captures pricing: wholesale lithium-ion UPS quotes from Tenders Info, diesel genset ASPs from Volza shipment data, and smart-PDU tariffs reported in quarterly reseller catalogs. These feed the cost curves applied later in the model.
Market-Sizing & Forecasting
One top-down construct scales national IT-load projections and power-capacity additions, which are then valued using component mix and ASP ladders derived from field quotes. Supplier roll-ups and sampled rack-price × volume checks ground-truth each subtotal. Key variables like annual megawatt additions, average rack density, Tier III share, UPS price erosion, renewable PPA penetration, and lithium-ion uptake drive the model. A multivariate regression links these indicators to historical revenue, after which scenario analysis adjusts for grid-stability policy shifts. Gaps in bottom-up estimates (for edge sites) are bridged with conservative penetration ratios agreed during expert calls.
Data Validation & Update Cycle
Outputs pass variance checks against import statistics, operator earnings, and grid-service revenues. Senior analysts review anomalies before sign-off. The dataset refreshes every twelve months, with interim tweaks triggered by material investment or policy events, ensuring clients receive the latest view.
Why Mordor's Australia Data Center Power Baseline Stands Solid
Published figures differ because firms pick varied scopes, ASP inputs, and refresh cadences. Some fold cooling or facility opex into 'power,' others extrapolate Asia-Pacific averages onto Australia, and many update less frequently.
Key gap drivers include inclusion of service revenues vs. hardware only, treatment of Tier IV premiums, and whether renewable-PPA income is netted out. Mordor's consistent component list, annual field pricing, and local build-tracker make our 2025 base of USD 0.83 billion the dependable choice.
Benchmark comparison
| Market Size | Anonymized source | Primary gap driver |
|---|---|---|
| USD 0.83 bn (2025) | Mordor Intelligence | - |
| USD 0.63 bn (2024) | Global Consultancy A | Excludes service revenue and models only solution hardware using regional averages |
| USD 0.38 bn (2024) | Research Publisher B | Applies conservative growth factors and omits Tier-level differentiation |
| USD 1.45 bn (2024) | Industry Analytics C | Adds cooling power and facility opex that Mordor deliberately excludes |
In sum, buyers gain a balanced, transparent baseline from Mordor Intelligence, grounded in local data, refreshed often, and traceable to clear variables, enabling confident strategic planning.


Key Questions Answered in the Report
What is the current value of the Australia data center power market?
The Australia data center power market size is USD 0.88 billion in 2026.
How fast is the market growing?
It is projected to expand at a 5.72% CAGR, reaching USD 1.16 billion by 2031.
Which component segment leads spending?
UPS systems lead with 31.68% 2025 share, reflecting critical uptime requirements.
Why are rack power densities increasing so quickly?
AI and GPU workloads now demand 80-100 kW per rack, far above legacy 5-10 kW, forcing redesigns of power and cooling architectures.
How are data centers monetising grid-interactive UPS fleets?
Lithium-ion UPS batteries can bid into AEMO’s “very-fast” frequency-control markets, generating new revenue while supporting grid stability.
What regions beyond Sydney are seeing growth?
Melbourne, Brisbane and Perth attract new builds due to renewable-energy-zone proximity and lower network congestion, diversifying geographic load.
Page last updated on:


