Brazil Data Center Power Market Size and Share
Market Overview
| Study Period | 2020 - 2031 |
|---|---|
| Forecast Data Period | 2026 - 2031 |
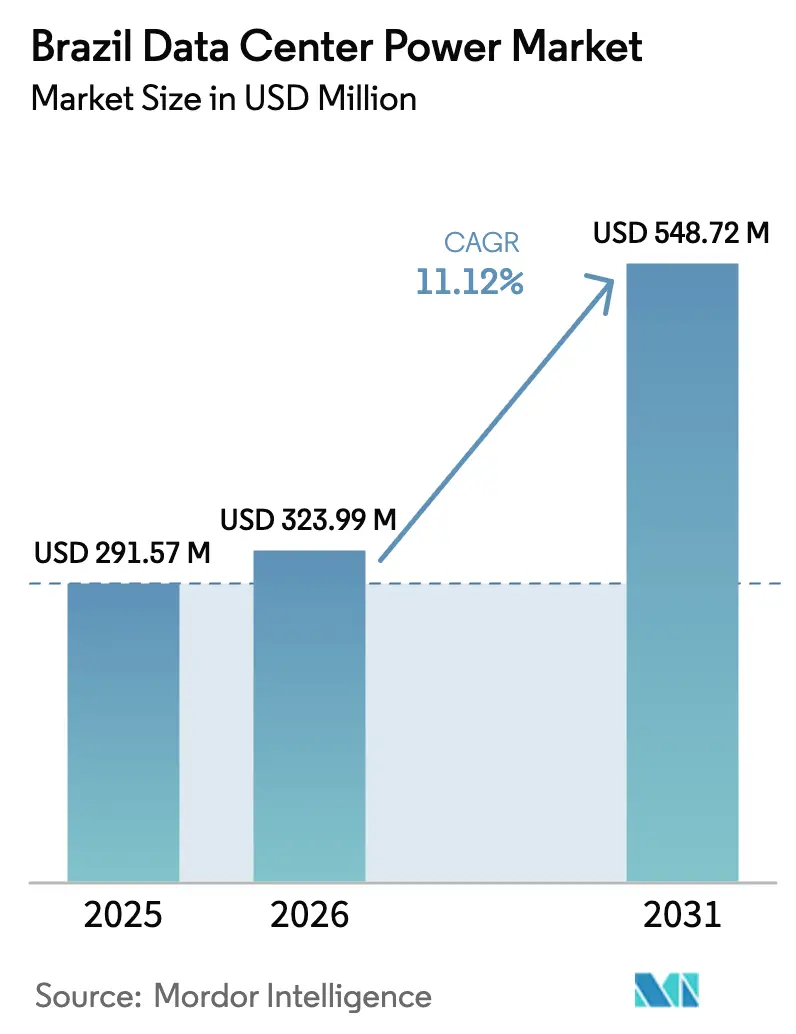
| Base Year Market Size (2025) | USD 291.57 Million |
| Market Size (2026) | USD 323.99 Million |
| Market Size (2031) | USD 548.72 Million |
| Growth Rate (2026 - 2031) | 11.12% CAGR |
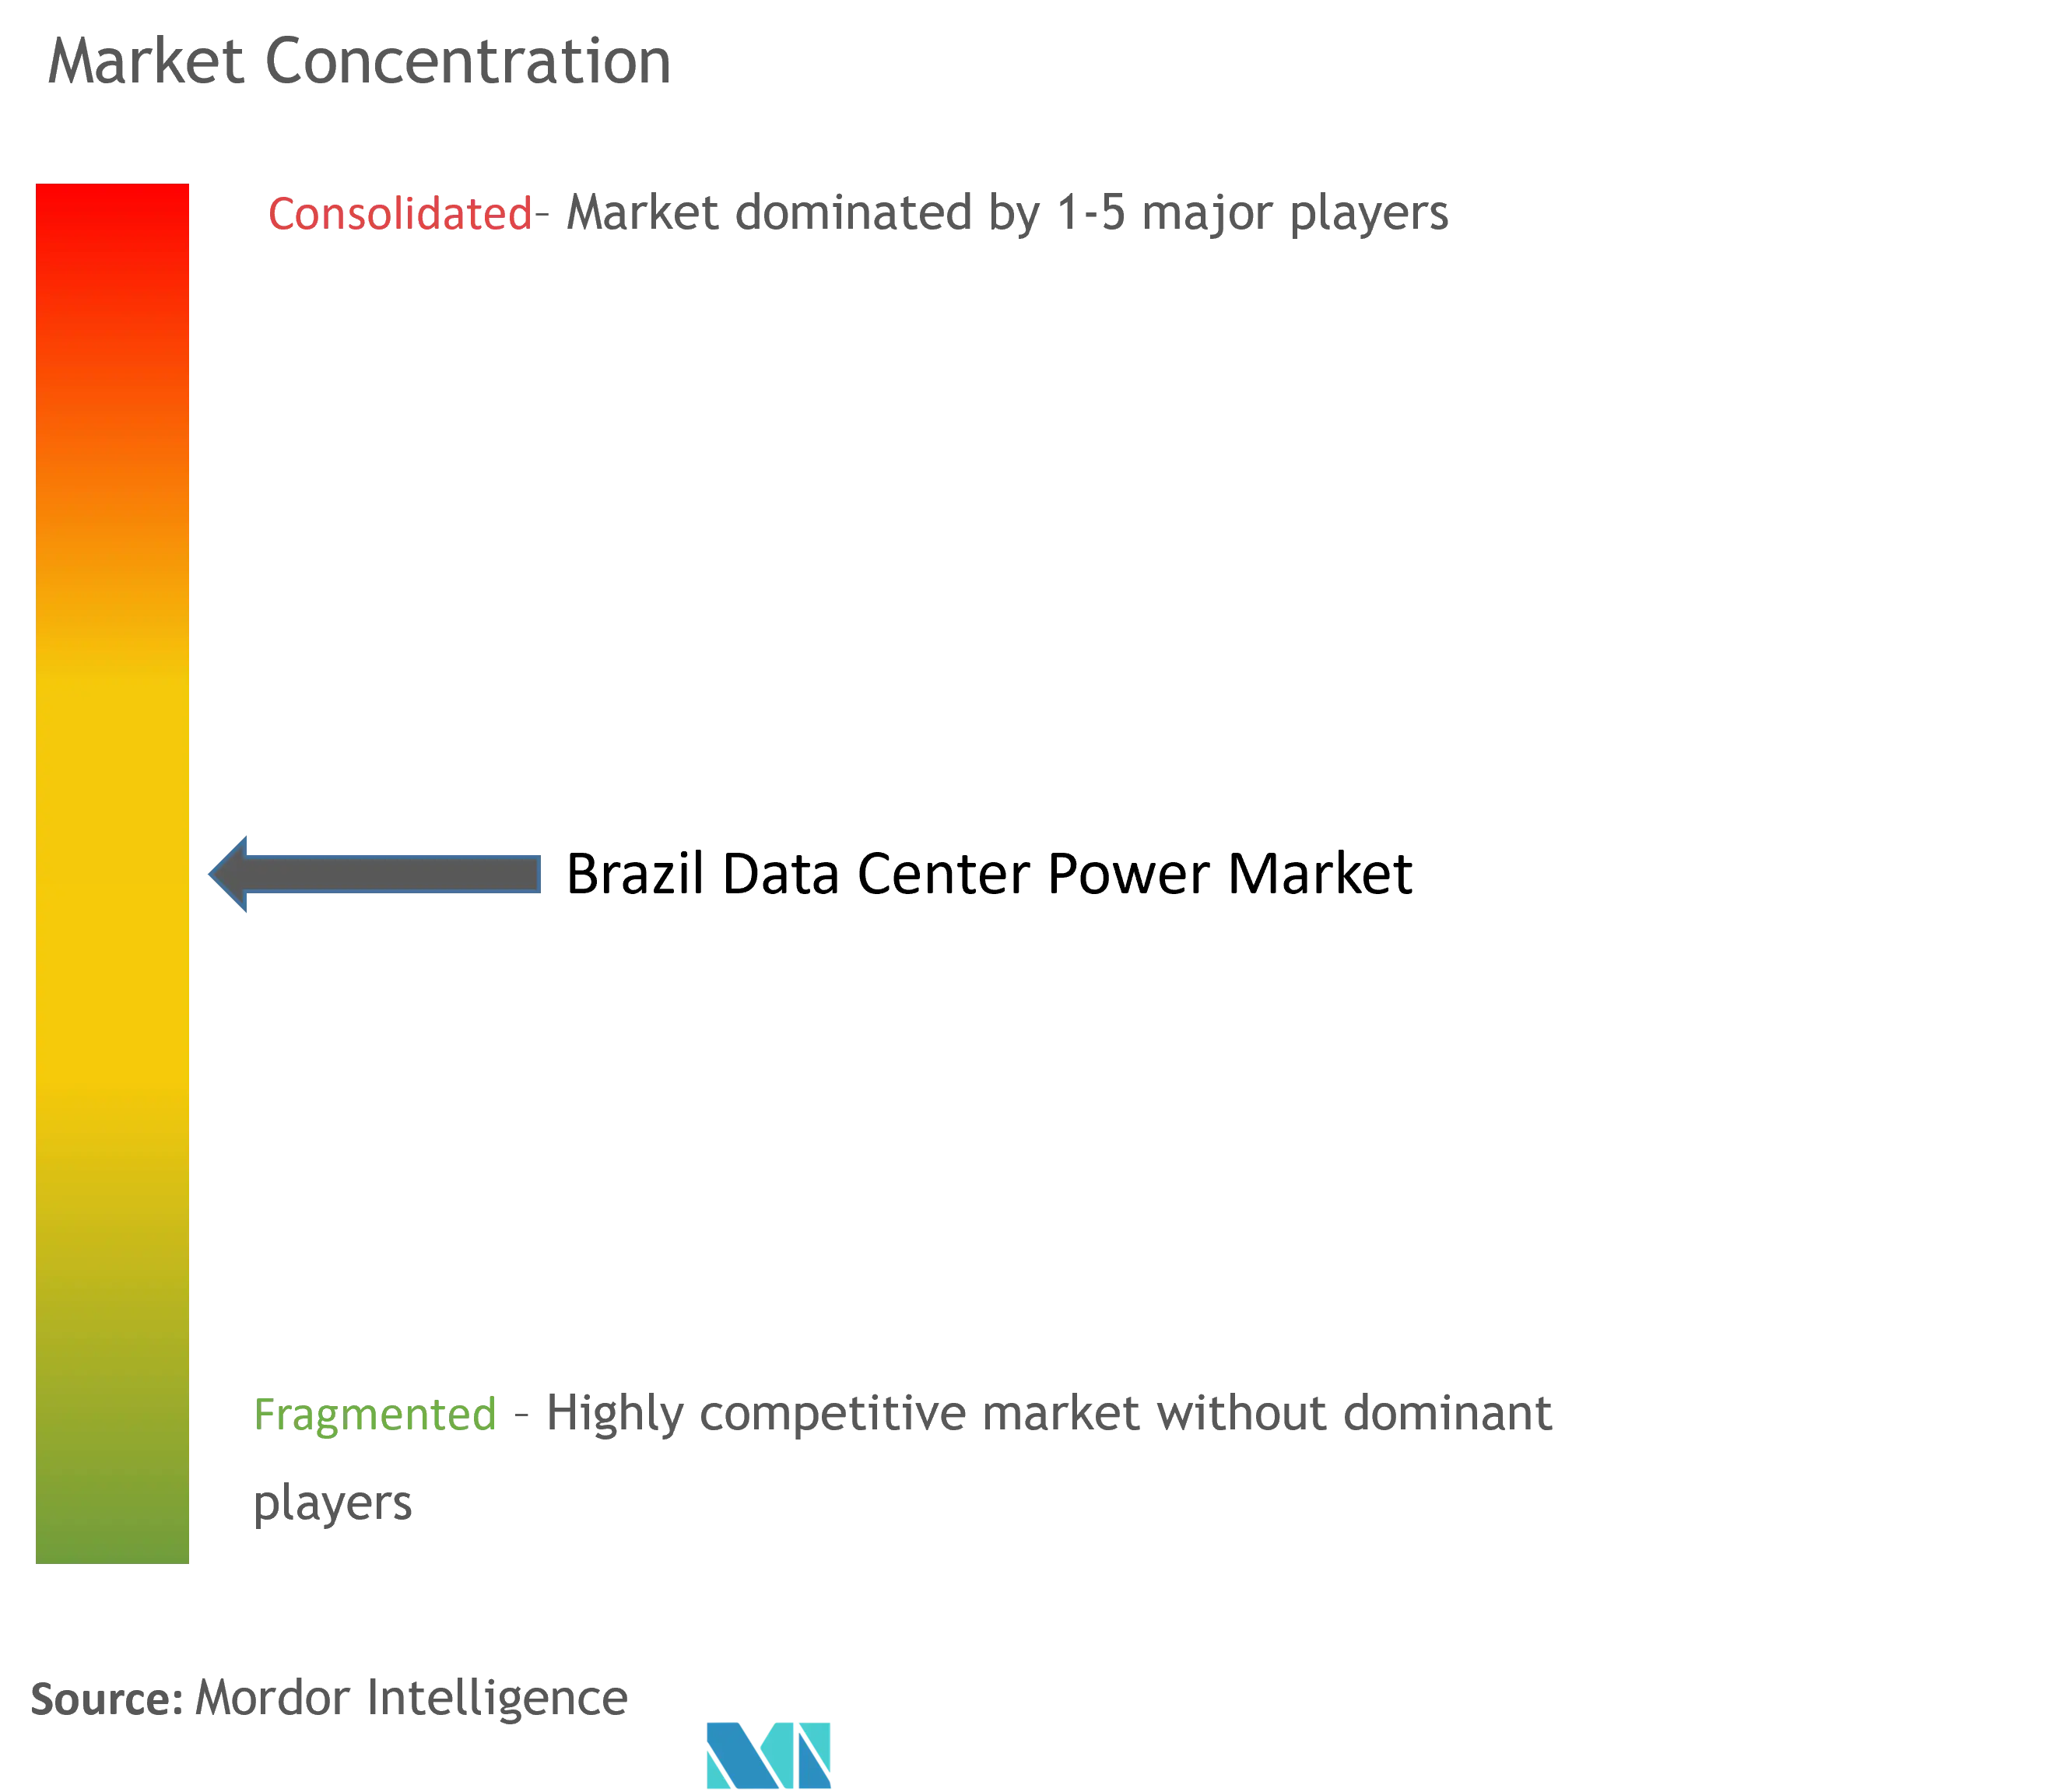
| Market Concentration | Medium |
Major Players *Disclaimer: Major Players sorted in no particular order Image © Mordor Intelligence. Reuse requires attribution under CC BY 4.0. | |
Brazil Data Center Power Market Analysis by Mordor Intelligence
Brazil data center power market size in 2026 is estimated at USD 323.99 million, growing from 2025 value of USD 291.57 million with 2031 projections showing USD 548.72 million, growing at 11.12% CAGR over 2026-2031. The robust trajectory is reinforced by a 94% clean-energy electricity mix that aligns with the hyperscale sustainability mandate. Rising AI and machine-learning deployments that exceed 50 kW per rack are accelerating the upgrade cycle for power distribution, cooling, and energy storage. Federal support, including the five-year Redata equipment tax incentive, encourages operators to adopt renewable power purchase agreements that hedge tariff risk. Meanwhile, planned investments such as Microsoft’s USD 2.6 billion three-year outlay and Vtal’s USD 1 billion subsidiary highlight long-term confidence in the Brazil data center power market.
Key Report Takeaways
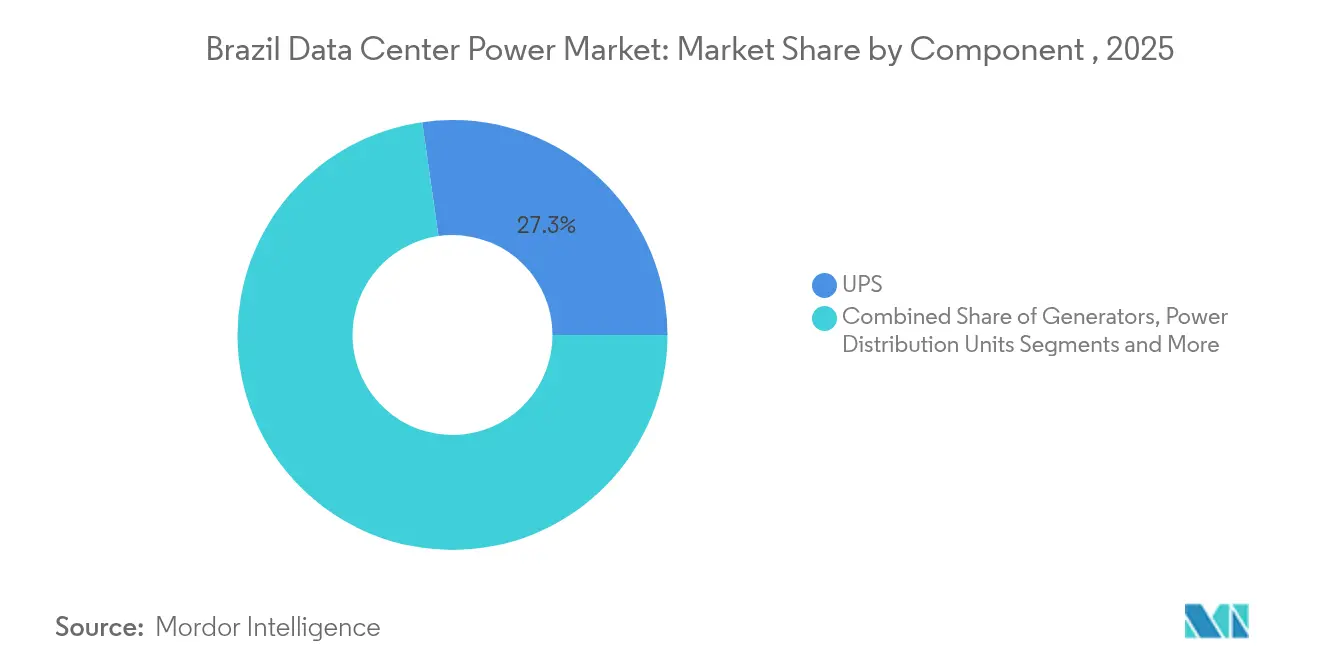
- By component, UPS systems led with 27.25% of the Brazil data center power market share in 2025, while power distribution units expanded the fastest at a 12.56% CAGR through 2031.
- By data center type, colocation facilities held 41.90% revenue share in 2025; hyperscale operators are projected to advance at an 11.38% CAGR to 2031.
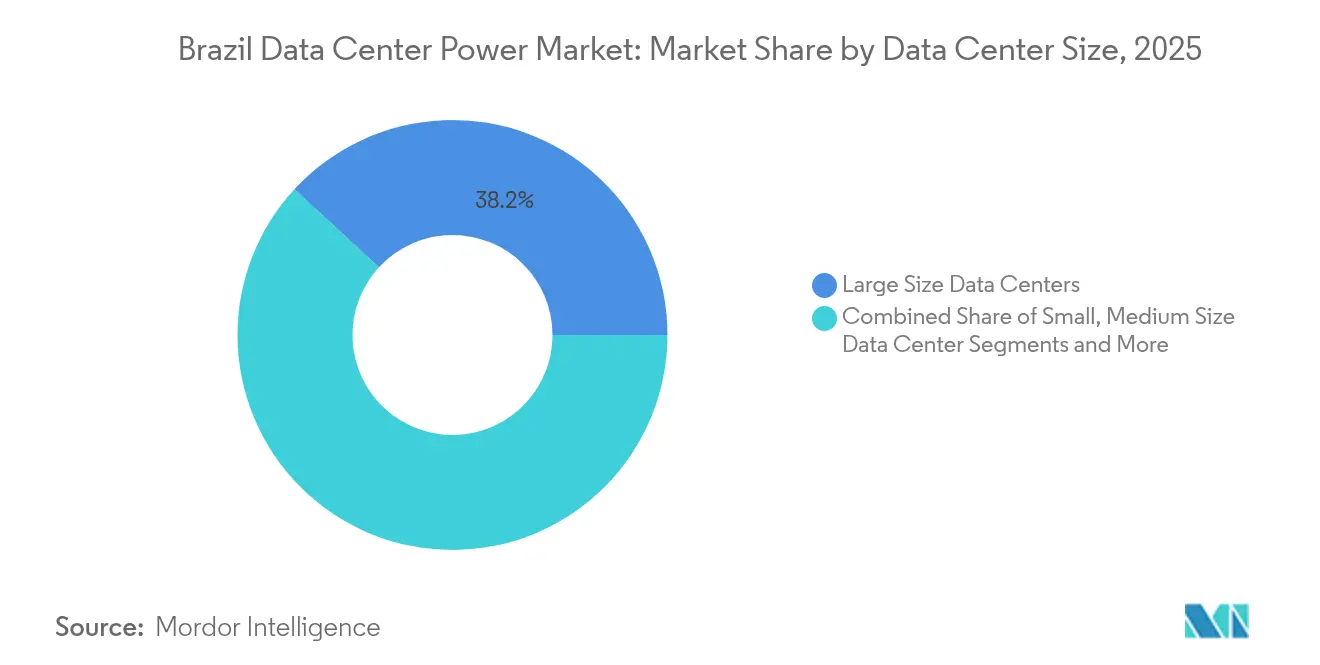
- By size, large facilities accounted for 38.15% of the Brazil data center power market size in 2025, whereas massive sites are poised to grow at a 12.12% CAGR.
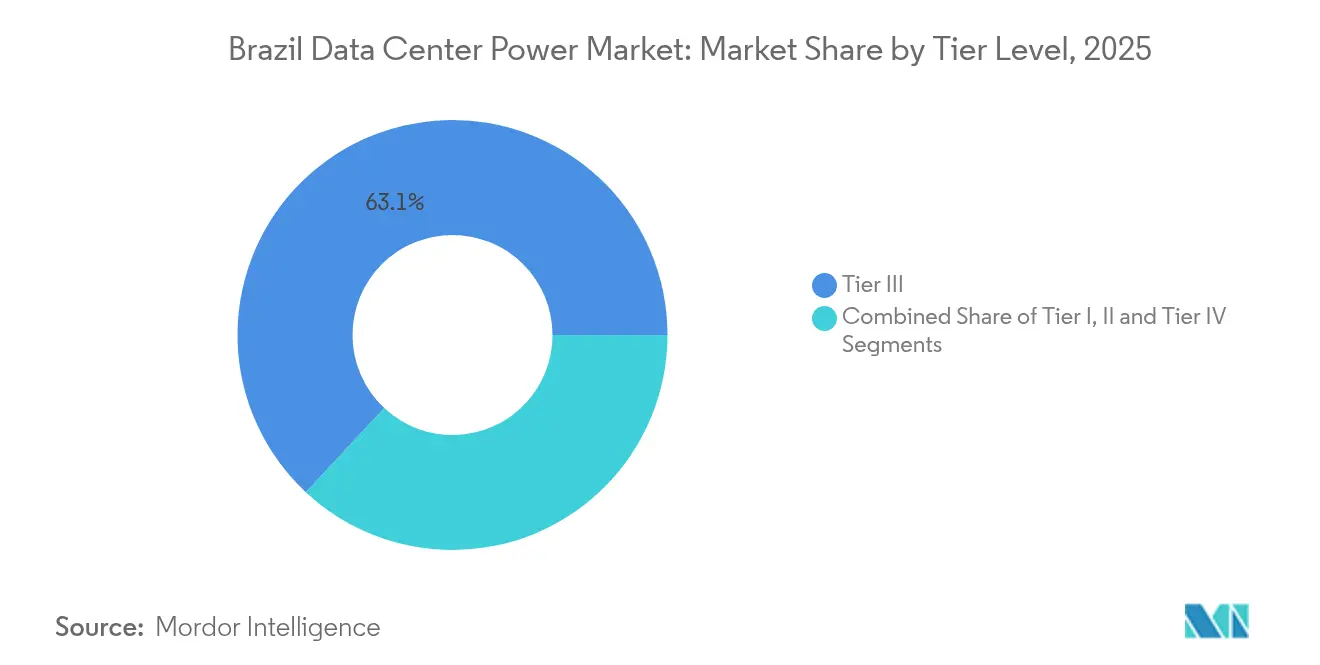
- By tier, Tier III sites captured 63.05% of the Brazil data center power market size in 2025, while Tier IV investments registered the highest 12.84% CAGR.
Note: Market size and forecast figures in this report are generated using Mordor Intelligence’s proprietary estimation framework, updated with the latest available data and insights as of 2026.
Brazil Data Center Power Market Trends and Insights
Drivers Impact Analysis*
| Driver | (~)% Impact on CAGR Forecast | Geographic Relevance | Impact Timeline |
|---|---|---|---|
| Rising adoption of mega data centers & cloud computing | +2.8% | São Paulo & Rio corridors, expanding to secondary cities | Medium term (2-4 years) |
| Surge in AI/ML workloads requiring >50 kW/rack power density | +3.2% | São Paulo metropolitan area, Rio de Janeiro | Short term (≤ 2 years) |
| Expansion of hyperscale colocation campuses in São Paulo & Rio corridors | +2.1% | São Paulo, Rio de Janeiro, emerging in Brasília | Medium term (2-4 years) |
| Falling LCOE of Brazilian renewables enabling 24/7 green PPAs | +1.9% | National, with concentration in Northeast wind and Southeast hydro | Long term (≥ 4 years) |
| Edge-data-center build-outs in secondary cities to meet 5G latency needs | +1.2% | Secondary cities including Belo Horizonte, Porto Alegre, Recife | Long term (≥ 4 years) |
| Fiscal incentives (Lei da Informática 2.0) for high-efficiency electrical gear | +0.8% | National, with manufacturing incentives in Southeast | Medium term (2-4 years) |
| Source: Mordor Intelligence | |||
Rising Adoption of Mega Data Centers and Cloud Computing
Mega-scale facilities led by Microsoft’s USD 2.6 billion commitment and V.tal’s USD 1 billion roll-out are redefining the Brazil data center power market. Projects such as Elea Data Centers’ 50 MW high-voltage site in São Paulo secure bespoke grid access agreements and integrate on-site generation to overcome utility limitations. Concentrated power demand in core metros is now stimulating development in secondary cities that offer less grid congestion.
Surge in AI/ML Workloads Requiring greater than 50 kW/Rack Power Density
AI-centric racks eclipse traditional 5-15 kW power profiles, prompting wide-scale electrical redesigns. Vertiv’s first liquid-cooling solution in Brazil achieves PUE ratios near 1.15 while supporting >100 kW per rack, and Schneider Electric’s Galaxy VXL UPS delivers 99% efficiency to meet these load profiles.[1]IPP Media Tech Bureau, “Schneider Unveils Galaxy VXL UPS,” ippmedia.comThe shift accelerates demand for intelligent PDUs and advanced energy management software
Expansion of Hyperscale Colocation Campuses in São Paulo and Rio
With 670 MW of operating capacity and 770 MW in the queue, São Paulo hosts Latin America’s largest campus build-outs. Projects such as Tecto’s planned 200 MW facility rely on renewable power and high-density design to serve AI clouds, reinforcing Brazil’s position as a continental hub.
Falling LCOE of Brazilian Renewables Enabling 24/7 PPAs
Data center operators signed 1.7 GW of solar and 0.6 GW of wind autoproduction contracts in 2024, locking in dollar-denominated rates below grid tariffs. The Scala-Serena agreement remains the region’s largest renewable PPA, offering a blueprint for fixed-price green energy procurement.
Restraint Impact Analysis*
| Restraint | (~)% Impact on CAGR Forecast | Geographic Relevance | Impact Timeline |
|---|---|---|---|
| Rising industrial electricity tariffs (+12% YoY 2023) | -1.8% | National, with higher impact in Southeast industrial regions | Short term (≤ 2 years) |
| Chronic grid-congestion & permitting delays for >30 MVA connections | -2.3% | São Paulo metropolitan area, Rio de Janeiro | Medium term (2-4 years) |
| Cap-ex premium for Tier III/IV redundancy in tropical climates | -1.4% | National, with higher impact in humid coastal regions | Medium term (2-4 years) |
| Drought-driven hydropower volatility increasing diesel-backup OPEX | -1.1% | Southeast and South regions dependent on hydroelectric generation | Short term (≤ 2 years) |
| Source: Mordor Intelligence | |||
Rising Industrial Electricity Tariffs (+12% YoY 2023)
ANEEL’s 2025 tariff adjustments add cost pressure, pushing operators toward the free energy market where 33,000 consumers migrated in 2024.[2]ANEEL Communications, “2025 Transmission Auction Consultation,” aneel.gov.br Examples such as Rio de Janeiro’s municipal PPA that saved USD 6 million underscore the benefits of renewable contracts for large users.
Chronic Grid Congestion and Permitting Delays for greater than 30 MVA Connections
Transmission auctions worth BRL 7.6 billion aim to ease São Paulo’s bottlenecks, but new lines need 3-5 years, prolonging data-center build cycles. Operators are now partnering with equipment vendors to deploy modular on-site generation that bypasses grid constraints.[3]MENAFN Newswire, “Eaton and Siemens Energy Partner on 500 MW DC Power Plants,” menafn.com
*Our forecasts treat driver/restraint impacts as directional, not additive. The impact forecasts reflect baseline growth, mix effects, and variable interactions.
Segment Analysis
By Component UPS Systems Dominate While PDUs Accelerate
UPS systems contributed 27.25% of the Brazil data center power market in 2025 thanks to their non-negotiable role in uptime assurance. Power distribution units, however, will grow at 12.56% CAGR through 2031 as AI racks demand outlet-level monitoring. The Brazil data center power market size for UPS is set to maintain double-digit expansion, driven by efficiency gains such as Schneider Electric’s 99%-efficient Galaxy VXL. Eaton’s metered outlet PDUs enable real-time energy allocation suited to >50 kW rack densities, reinforcing their fast-growing status.
The evolution in component mix signals a transition from traditional diesel-only backup to hybrid configurations that integrate batteries and hydrogen fuel cells. Generator demand remains resilient but shifts toward cleaner fuels as tax incentives reward low-emission systems. Switchgear, transfer switches, and remote power panels also expand steadily, supported by modular data-center construction methods that prioritize rapid deployment and flexible capacity upgrades.


By Data Center Type Colocation Leadership Faces Hyperscale Challenge
Colocation facilities owned 41.90% market share in 2025, capitalizing on multi-tenant economics and strong enterprise relationships. Hyperscale operators, however, will grow 11.38% CAGR through 2031, reflecting major cloud investments. The Brazil data center power market is therefore tilting toward larger, purpose-built sites such as Elea’s AI-ready campus powered by liquid cooling. Enterprises continue to use small-footprint edge sites to meet 5G latency needs, but capital allocation is migrating to consolidated builds. Brookfield’s ongoing search for partners for Ascenty underscores the capital intensity required to scale hyperscale assets.
Service differentiation now centers on efficiency and renewable integration rather than space alone. Colocation groups counter the hyperscale threat by bundling cloud interconnect ecosystems, while edge operators deploy prefabricated modules that ship with intelligent power management software. Vendors that can support this spectrum with unified monitoring platforms stand to gain share inside the Brazil data center power market.
By Data Center Size Large Facilities Lead While Massive Installations Surge
Large facilities retained 38.15% market share in 2025, reflecting balanced economics between scale and flexibility. Massive installations, defined as 40-100 MW, are projected to expand 12.12% CAGR, propelled by AI clusters demanding contiguous power. The Brazil data center power market share for massive sites will therefore close the gap with large sites before 2031. Tecto’s planned 200 MW project illustrates the appeal of single-campus megawatts that lower PUE and improve opex. Medium and small builds are likely to shift toward edge-specific roles, leaving core compute to a handful of mega campuses.
Scaling up fundamentally reshapes electrical design, requiring redundant feeds, high-voltage substations and large-scale energy-storage integration. Suppliers able to deliver turnkey high-MVA systems become critical ecosystem partners. Meanwhile, real estate constraints in São Paulo are pushing new massive builds to suburbs such as Barueri, stimulating local grid reinforcement.
By Tier Level Tier III Dominance Gives Way to Tier IV Growth
Tier III sites still account for 63.05% of the Brazil data center power market size but growth is slowing. Tier IV projects will rise 12.84% CAGR through 2031 as AI workload monetization justifies premium resiliency. Banking and healthcare clients now specify Tier IV power architectures, willing to pay for dual-bus UPS, redundant transformers and automated failover. Eaton’s 93T series with Hot Sync parallel capability is one response to this shift, delivering 96% efficiency under typical loads.
In response, Tier I-II developments are relegated to non-critical or edge roles. The tier migration impacts supplier portfolios because higher-tier builds require advanced control systems and sensors capable of predictive maintenance. Integrators that bundle electrical, cooling and monitoring as a pre-certified package gain competitive leverage as tier standards climb.
Geography Analysis
São Paulo’s mature fiber backbones, financial services demand, and engineering talent continuously attract new projects, even as land scarcity nudges development toward suburbs such as Osasco. The Brazil data center power market size for São Paulo is therefore expected to sustain double-digit growth for the entire forecast period.
Rio de Janeiro is rapidly emerging as a secondary hotspot. Municipal clean-energy initiatives, including the pioneering Río de Energía Verde program, create a favorable backdrop for Elea’s Rio AI City campus, which aims to specialize in AI computing, C40. Proximity to subsea cable landing stations and government incentives further enhance the city’s attractiveness. Still, grid congestion and longer permitting cycles temper near-term capacity additions.
A third tier of expansion encompasses Belo Horizonte, Porto Alegre and Recife. These secondary metros support edge deployments essential for 5G latency; however, power-infrastructure maturity and talent availability lag behind the southeastern core. Federal investments in transmission upgrades and local photovoltaic generation are narrowing the gap. Operators that secure early grid access in these cities can capture latent enterprise demand while benefiting from lower land costs.
Competitive Landscape
The Brazil data center power market exhibits moderate concentration. Global incumbents Schneider Electric, Vertiv, ABB and Eaton dominate large project bids owing to full-stack product lines and robust service networks. Schneider’s Galaxy VXL UPS and Vertiv’s liquid-cooling partnerships with Elea mark product responses tailored to high-density AI loads. ABB strengthens its position with modular switchgear optimized for tropical climates, while Eaton teams with Siemens Energy to bundle on-site generation and battery storage solutions that reduce grid reliance.
A new cohort of challengers targets niche opportunities. Battery-energy-storage firms leverage falling lithium-ion costs and the 7.2 GW national pipeline to pitch green backup alternatives. Modular-data-center specialists offer prefabricated electrical rooms that cut deployment lead times. Local electrical integrators form joint ventures with global OEMs to meet Lei da Informática 2.0 local-content requirements, adding fresh competition on price and logistics.
Brazil Data Center Power Industry Leaders
ABB Ltd
Caterpillar Inc.
Cummins Inc.
Eaton Corporation plc
Legrand Group
- *Disclaimer: Major Players sorted in no particular order

Recent Industry Developments
- June 2025: Eaton and Siemens Energy entered a strategic alliance to supply integrated on-site power plants up to 500 MW for Brazilian campuses, cutting time-to-market by 24 months and CO₂ emissions by 50% .
- June 2025: The federal Redata program introduced five-year tax relief for data-center equipment tied to 100% clean-energy usage.
- May 2025: Elea Data Centers unveiled Rio AI City, aiming to position Rio as a dedicated AI infrastructure hub.
- March 2025: Tecto confirmed a 200 MW renewable-powered hyperscale build in São Paulo for cloud and AI clients.


Research Methodology Framework and Report Scope
Market Definitions and Key Coverage
Our study defines Brazil's data center power market as yearly spending on core electrical hardware, including uninterruptible-power-supply units, diesel or gas standby generators, power distribution units, switchgear, remote power panels, transfer switches, and their monitoring systems, installed in new or expanding colocation, hyperscale, edge, and enterprise facilities across the country. We also count periodic replacement of the same gear inside existing halls.
Scope exclusion: Cooling equipment, IT racks or servers, building-shell work, and separately contracted on-site solar or battery projects fall outside the model.
Segmentation Overview
- By Component
- Electrical Solutions
- UPS Systems
- Generators
- Diesel Generators
- Gas Generators
- Hydrogen Fuel-cell Generators
- Power Distribution Units
- Switchgear
- Transfer Switches
- Remote Power Panels
- Energy-storage Systems
- Service
- Installation and Commissioning
- Maintenance and Support
- Training and Consulting
- Electrical Solutions
- By Data Center Type
- Hyperscaler/Cloud Service Providers
- Colocation Providers
- Enterprise and Edge Data Center
- By Data Center Size
- Small Size Data Centers
- Medium Size Data Centers
- Large Size Data Centers
- Massive Size Data Centers
- Mega Size Data Centers
- By Tier Level
- Tier I and II
- Tier III
- Tier IV
Detailed Research Methodology and Data Validation
Primary Research
We hold structured calls and site visits with facility energy managers, colocation buyers, generator dealers, and electrical engineers in São Paulo, Rio, and Minas Gerais. Their insights on redundancy practice, discount ranges, and PPA uptake close gaps flagged during desk work.
Desk Research
Mordor analysts collect capacity and tariff curves from ANEEL, grid statistics from ONS, and data-hall license filings at Anatel, then layer in customs logs, Abinee shipment surveys, and open IEEE papers on high-density racks. Company 10-Ks, investor decks, and procurement notices reveal pricing bands and brand shifts. Paid vaults like D&B Hoovers and Dow Jones Factiva help us confirm supplier revenues. The sources listed are illustrative only; many more were reviewed to triangulate figures.
Market-Sizing & Forecasting
A top-down build starts with installed IT load, announced expansions, and prevailing power-usage effectiveness, then converts megawatts into electrical-infrastructure outlay via cost-per-MW grids. Supplier shipment roll-ups and sampled ASP-times-volume checks act as a bottom-up reasonableness screen before calibration. Key variables tracked include average rack density, PUE drift, hyperscale pipeline, industrial-tariff index, and renewable-PPA penetration. Multivariate regression on these drivers underpins the 2025-2030 outlook; missing bottom-up inputs are bridged with vetted regional proxies.
Data Validation & Update Cycle
Outputs pass variance filters, peer review, and management sign-off. We refresh the dataset every year and trigger interim revisions when projects above 10 MW, sharp tariff moves, or material policy shifts occur, giving clients the latest consensus.
Why Mordor's Brazil Data Center Power Baseline Commands Reliability
Published estimates often diverge because firms pick different component lists, cost curves, and update cadences. Some fold cooling into 'power,' others freeze rack density at six kilowatts, and several rely on 2023 capex grids; Mordor updates curves twice a year and validates redundancy ratios through ongoing interviews. Currency timing and whether renewable PPAs are booked as capex or opex widen gaps further.
Benchmark comparison
| Market Size | Anonymized source | Primary gap driver |
|---|---|---|
| USD 291.57 m (2025) | Mordor Intelligence | - |
| USD 286.63 m (2024) | Regional Consultancy A | Narrower component list, older baseline year |
| USD 179.50 m (2024) | Global Consultancy B | Minimal primary checks, excludes generator retrofits |
These comparisons show that Mordor's disciplined scope selection, live cost tracking, and blended top-down and bottom-up validation provide a balanced, transparent baseline decision-makers can trust.


Key Questions Answered in the Report
What is the Brazil data center power market size and growth outlook?
The market is valued at USD 323.99 million in 2026 and is forecast to reach USD 548.72 million by 2031, growing at an 11.12% CAGR.
Which component segment is expanding the fastest?
Power distribution units lead growth with a 12.56% CAGR through 2031, reflecting demand for outlet-level monitoring in >50 kW AI racks.
Why are hyperscale providers committing multi-billion-dollar investments in Brazil?
São Paulo offers 94% renewable electricity, advanced fiber routes and government tax incentives, enabling efficient, sustainable scaling for AI and cloud workloads.
How do 24/7 renewable power purchase agreements help operators?
Long-term PPAs lock in electricity at rates below grid tariffs, satisfy corporate sustainability targets and insulate facilities from rising industrial prices.
What are the chief constraints for new data center builds?
Developers face grid-congestion permitting delays for >30 MVA feeds, rising electricity tariffs, and Tier IV cap-ex premiums in Brazil’s humid climate.
Page last updated on:


