United States Data Center Power Market Size and Share
Market Overview
| Study Period | 2020 - 2031 |
|---|---|
| Forecast Data Period | 2026 - 2031 |
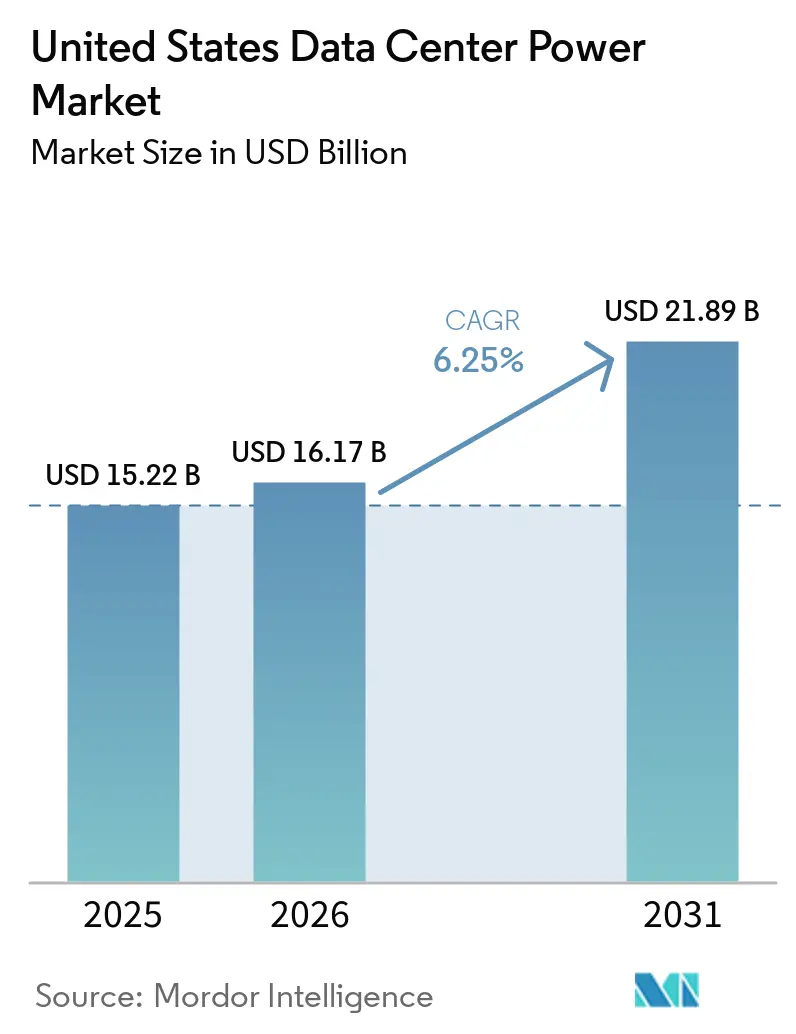
| Base Year Market Size (2025) | USD 15.22 Billion |
| Market Size (2026) | USD 16.17 Billion |
| Market Size (2031) | USD 21.89 Billion |
| Growth Rate (2026 - 2031) | 6.25% CAGR |
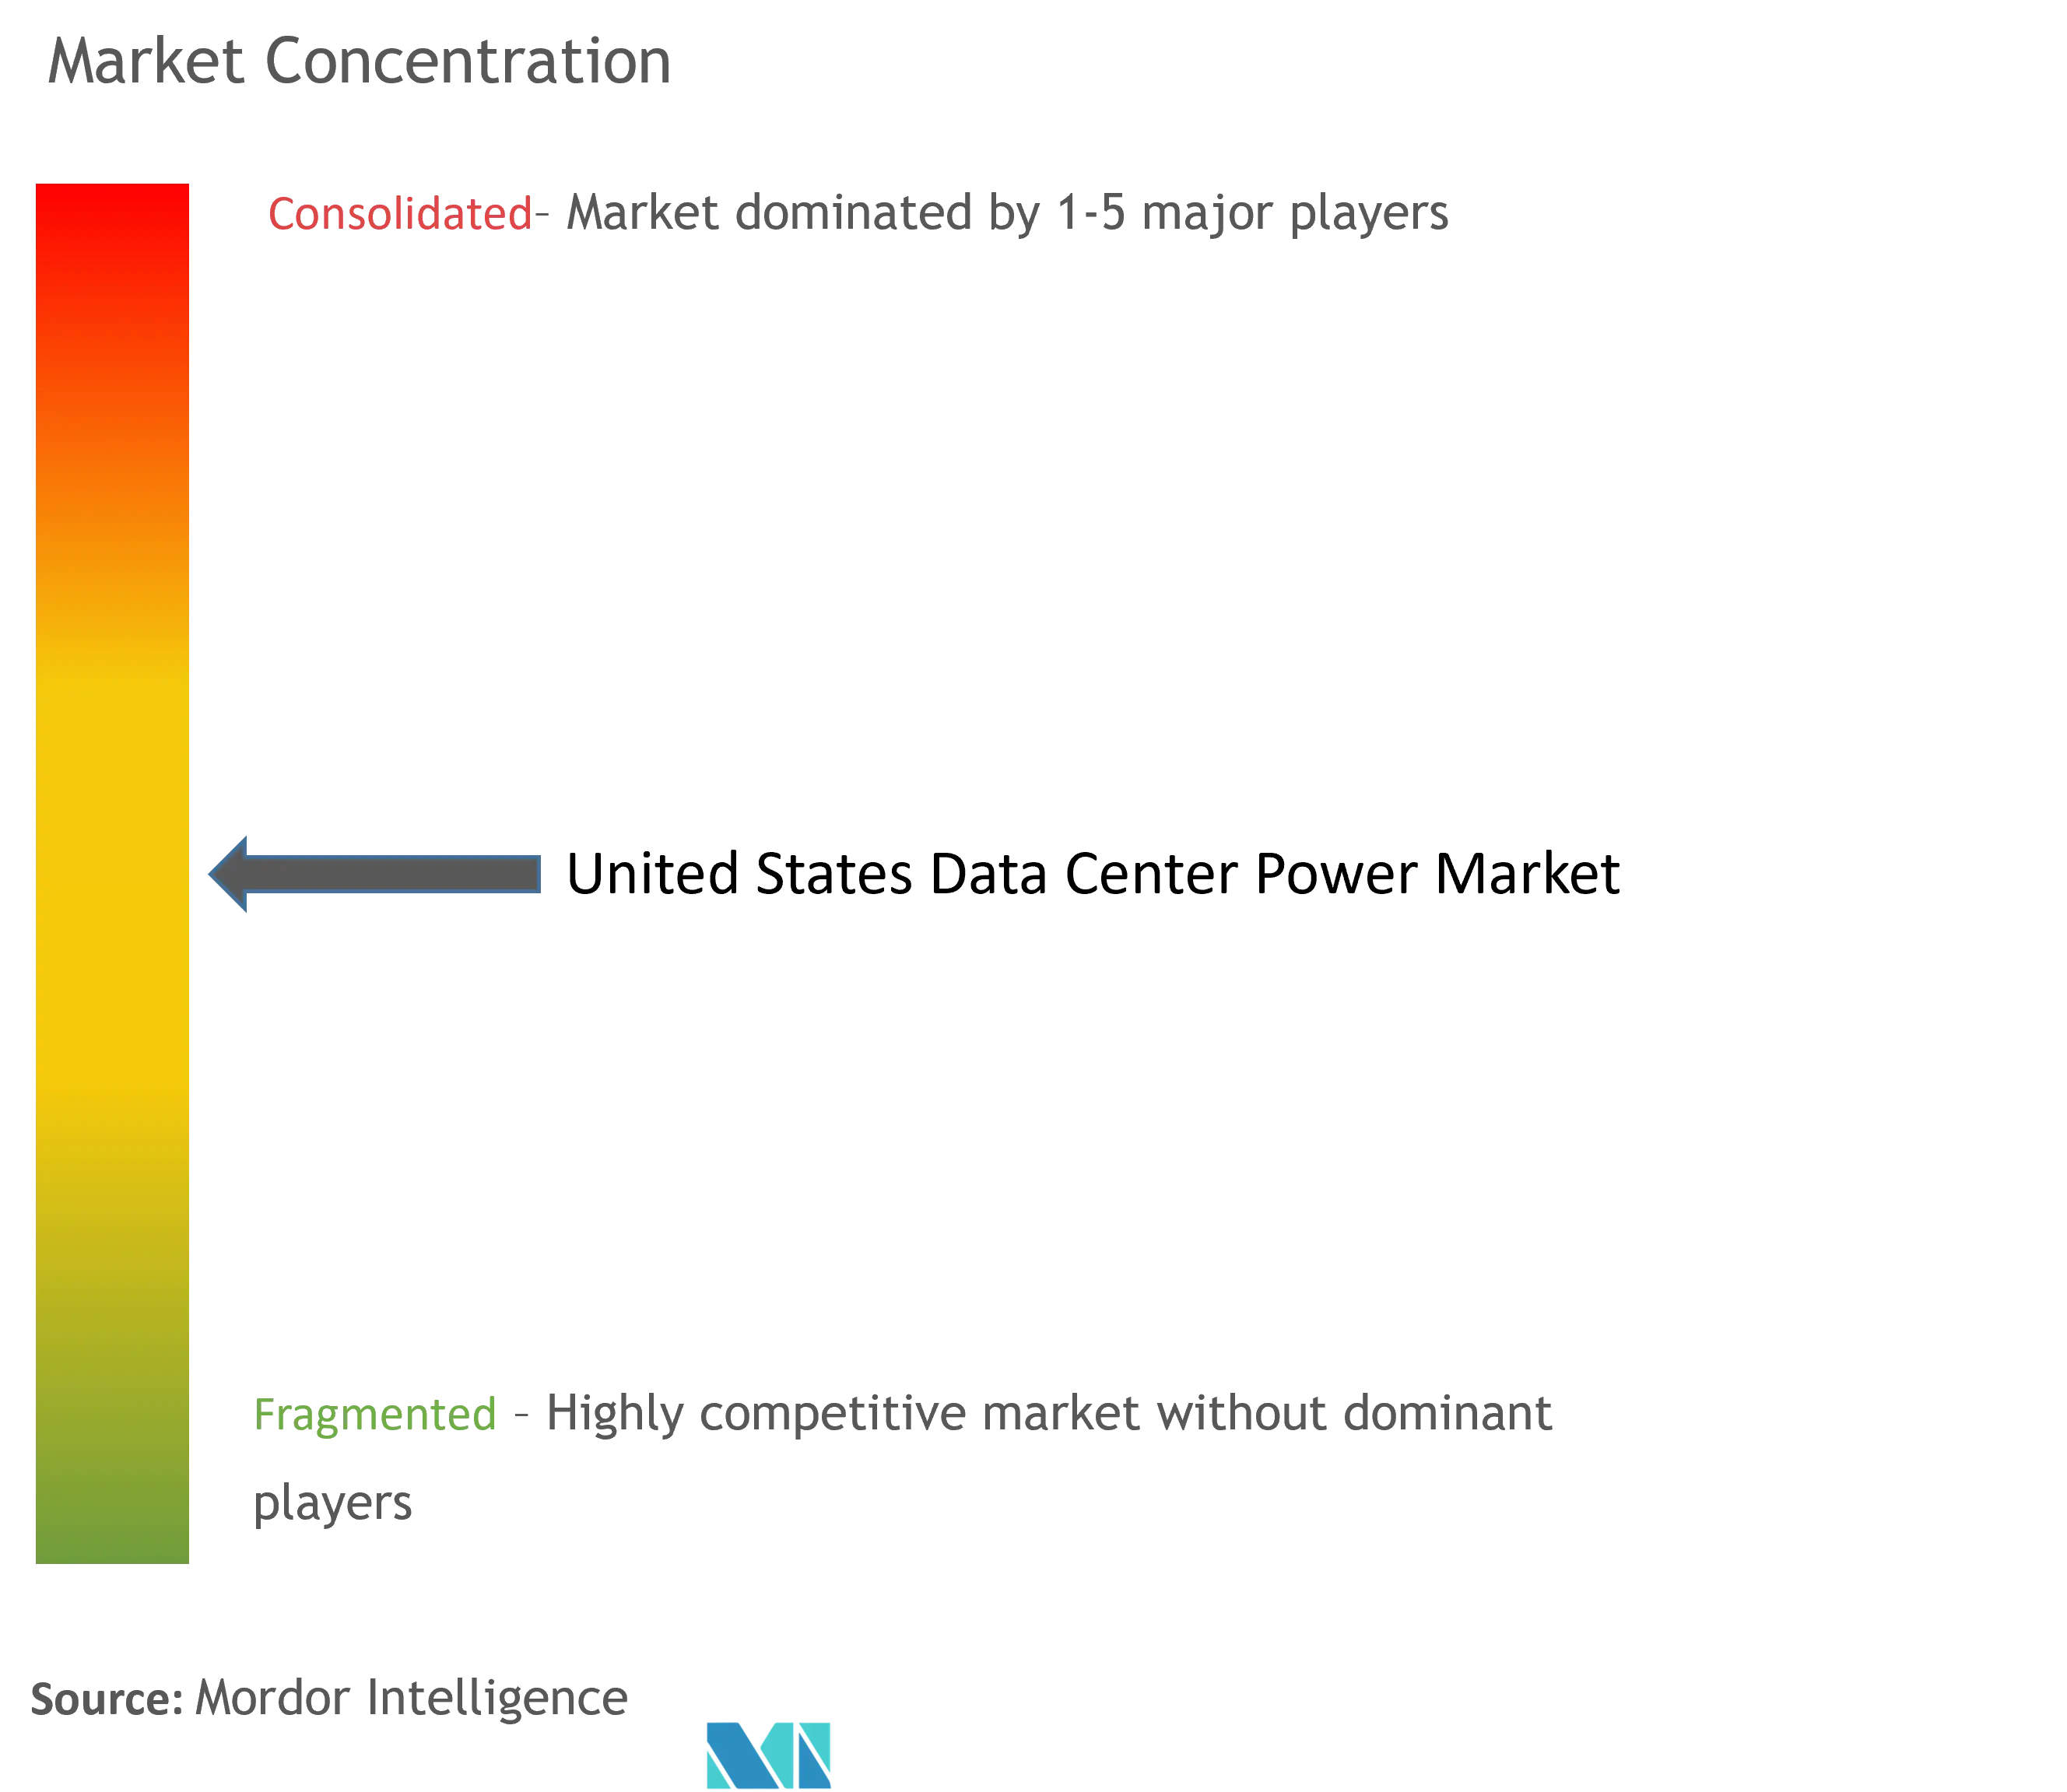
| Market Concentration | Medium |
Major Players *Disclaimer: Major Players sorted in no particular order Image © Mordor Intelligence. Reuse requires attribution under CC BY 4.0. | |
United States Data Center Power Market Analysis by Mordor Intelligence
The United States data center power market size is expected to grow from USD 15.22 billion in 2025 to USD 16.17 billion in 2026 and is forecast to reach USD 21.89 billion by 2031 at 6.25% CAGR over 2026-2031. Rising AI workloads that push rack densities past 20 kW, combined with expanding hyperscale footprints and heightened sustainability mandates, are reshaping investment priorities across the power stack. Operators are accelerating deployments of lithium-ion UPS systems, intelligent power distribution units, and on-site micro-grids to keep pace with demand while hedging against grid constraints. Federal and state tax incentives for green infrastructure are tilting the economic balance toward high-efficiency and renewable-ready designs, while demand-response programs unlock new revenue streams by monetizing idle battery capacity. Competitive pressure is intensifying as established vendors race to embed real-time monitoring and grid-interactive features that match the fast-evolving requirements of AI-driven data centers.
Key Report Takeaways
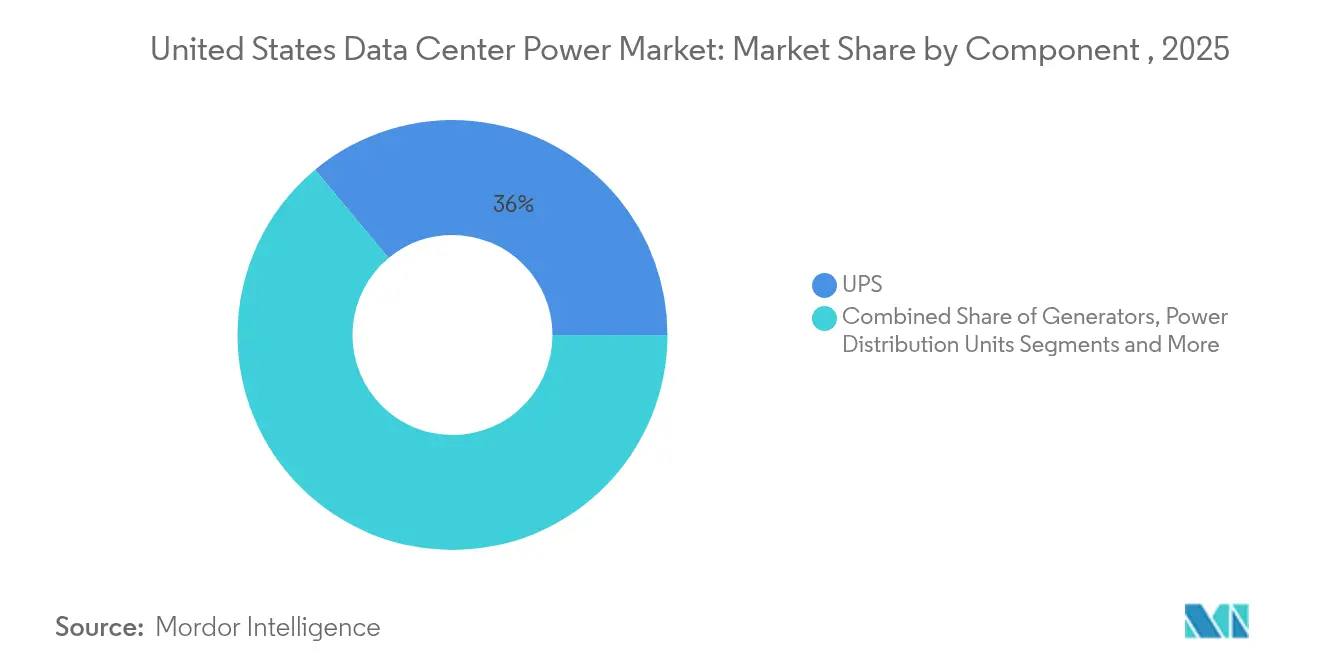
- By component, UPS systems led with 36.04% of the United States data center power market share in 2025; power distribution units are projected to expand at a 6.05% CAGR through 2031.
- By data center type, colocation providers held 45.10% revenue share in 2025, while hyperscale/cloud service providers are forecast to advance at an 8.05% CAGR to 2031.
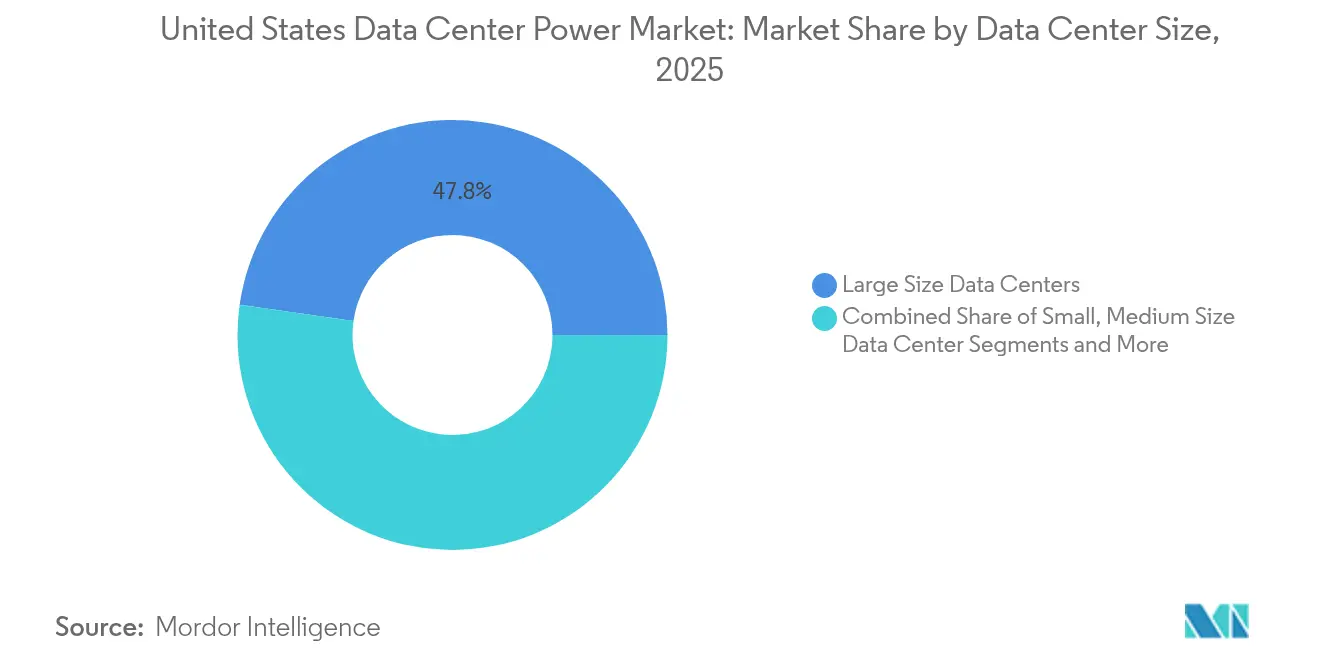
- By data center size, large facilities accounted for 47.75% of the United States data center power market size in 2025; mega centers are growing at a 9.1% CAGR between 2026-2031.
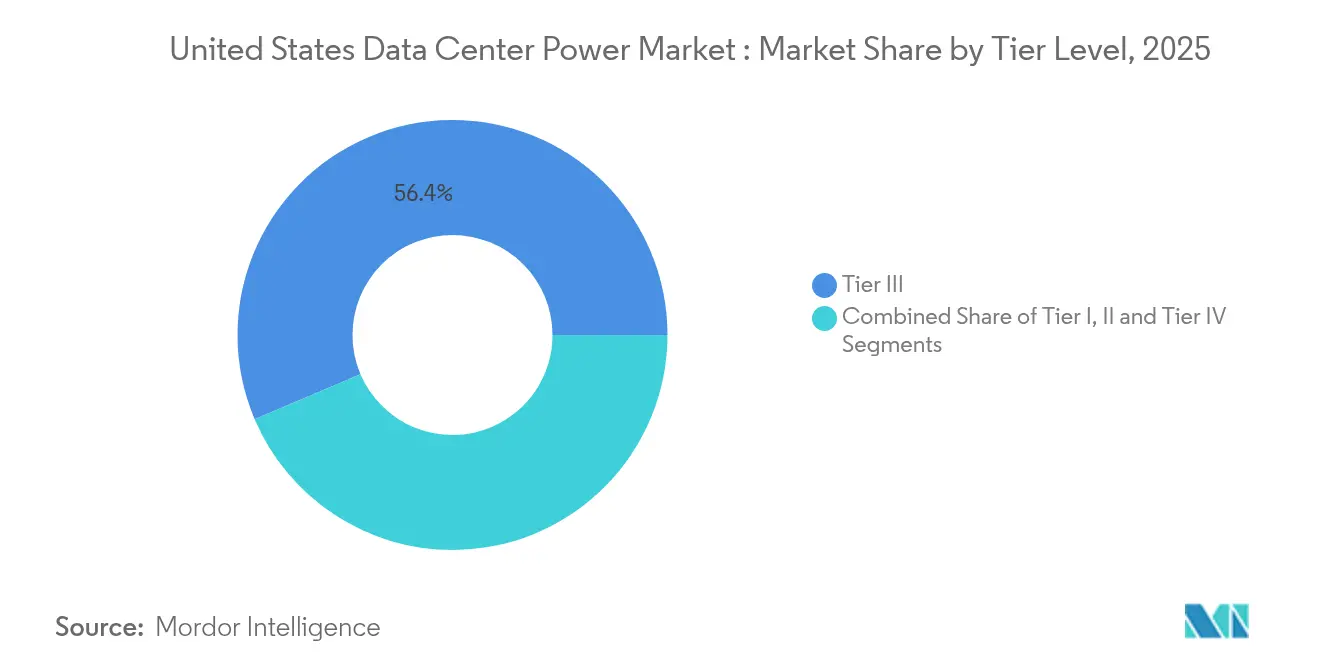
- By tier level, Tier III captured 56.40% of the United States data center power market share in 2025, whereas Tier IV facilities are set to expand at an 8.35% CAGR through 2031.
Note: Market size and forecast figures in this report are generated using Mordor Intelligence’s proprietary estimation framework, updated with the latest available data and insights as of 2026.
United States Data Center Power Market Trends and Insights
Drivers Impact Analysis*
| Driver | (~)% Impact on CAGR Forecast | Geographic Relevance | Impact Timeline |
|---|---|---|---|
| Growing rack-power density (≥20 kW/rack becoming mainstream) | +2.1% | National, with concentration in Northern Virginia, Texas, and California | Medium term (2-4 years) |
| Rapid shift to energy-efficient & cost-optimized facilities | +1.5% | National | Long term (≥ 4 years) |
| Hyperscale build-out across FL-VA-TX "data-center corridor" | +1.8% | Florida, Virginia, Texas | Medium term (2-4 years) |
| Federal & state tax incentives for green power infrastructure | +0.9% | National, with emphasis on states with renewable energy mandates | Medium term (2-4 years) |
| On-site micro-grid / fuel-cell adoption to hedge grid outages | +1.2% | National, with concentration in power-constrained markets | Short term (≤ 2 years) |
| Demand-response revenues via grid-interactive UPS fleets | +0.7% | National, with emphasis on deregulated electricity markets | Medium term (2-4 years) |
| Source: Mordor Intelligence | |||
Growing rack-power density (≥ 20 kW/rack becoming mainstream)
Racks surpassing 20 kW are redefining power topologies across the United States data center power market. AI-focused deployments already exceed 100 kW per rack, driving demand for high-amperage data center rack PDUs with granular metering that help operators fine-tune energy delivery. Adoption of direct-to-chip and immersion cooling pushes designers toward busway systems and remote power panels engineered for low voltage drop and minimal heat. These high-density architectures compress physical footprints, enabling hyperscale operators to extract more compute per square foot. Vendors that couple intelligent distribution with real-time thermal insight are gaining an edge. As densities climb, electrical engineers increasingly specify medium-voltage feeds to mitigate copper losses and retain headroom for future AI accelerators, underscoring the structural shift now underway.
Rapid shift to energy-efficient & cost-optimized facilities
Cost pressure and sustainability goals propel operators to chase PUE gains and lifecycle savings, keeping efficiency at the center of the United States data center power market conversation. Colocation providers, where power buys dictate margins, are early adopters of modular, right-sized power blocks that eliminate stranded capacity. Intelligent PDUs with outlet-level monitoring support predictive maintenance and usage-based billing models. Across portfolios, CFOs track total cost of ownership over a 15-year horizon; suppliers that quantify energy and maintenance savings are outselling peers. Green credentials further tip bidding criteria, moving procurement toward equipment with verifiable carbon reductions.
Hyperscale build-out across the FL-VA-TX “data-center corridor”
Massive campuses clustering in Florida, Virginia, and Texas are reshaping the United States data center power market. Hyperscale firms lock multi-gigawatt allocations years in advance, spurring specialized supply chains for medium-voltage switchgear, high-density UPS blocks, and grid-interactive battery systems. Providers demand standardized skids that arrive pre-tested to compress construction schedules. The corridor’s scale attracts top-tier manufacturers that co-locate assembly lines nearby, reducing transit risk and enhancing after-sales support. States compete by fast-tracking interconnection permits, widening the pool of viable sites. Vendors that align product roadmaps with hyperscale design guides secure multi-year framework agreements that underpin revenue visibility.
Federal & state tax incentives for green power infrastructure
Incentives are rewriting return-on-investment equations across the United States data center power market. Federal investment tax credits for fuel cells or battery storage, coupled with state-level renewable energy abatements, narrow payback periods sufficiently to justify premium technologies.[1]U.S. Department of Energy, “DOE Releases New Report Evaluating Increase in Electricity Demand from Data Centers,” energy.gov Hyperscalers schedule builds to sync with credits, redirecting billions toward on-site solar plus battery arrays or fuel-cell clusters that slash scope‐2 emissions. Incentives also spur utilities to pilot discounted tariffs for facilities that commit to load-flex programs. Power-equipment vendors respond with ready-to-certify solutions containing recycled metals or low-GWP switchgear that smooth ESG reporting. The heightened policy signal accelerates the refresh cycle, pulling forward demand for next-generation UPS and generator technologies that meet explicit carbon thresholds.
Restraint Impact Analysis*
| Restraint | (~)% Impact on CAGR Forecast | Geographic Relevance | Impact Timeline |
|---|---|---|---|
| IT refresh cycles outpacing electrical-plant payback periods | -0.8% | National | Long term (≥ 4 years) |
| Rising utility-rate volatility & grid-congestion charges | -1.3% | National, with severe impact in Northern Virginia, Texas, and Arizona | Medium term (2-4 years) |
| PFAS-related regulatory scrutiny on lithium-ion UPS chemistries | -0.5% | National, with early impact in states with strict environmental regulations | Medium term (2-4 years) |
| Generator permitting delays in Tier 1 metro areas | -0.9% | Major metropolitan areas, particularly in California and Northeast | Short term (≤ 2 years) |
| Source: Mordor Intelligence | |||
Swinging tariffs tighten margins across the United States data center power market, particularly in Tier 1 metros where demand charges spike during peak conditions. Colocation contracts often lock customer rates for multi-year terms, leaving providers exposed when wholesale power costs surge.[2]Electric Power Research Institute, “Data Centers Could Consume up to 9% of U.S. Electricity Generation by 2030,” epri.com In Northern Virginia, congestion fees compound the problem as utilities ration new load, forcing developers into costly on-site substations.Operators hedge with fixed-rate power purchase agreements and onsite battery storage that arbitrages peak differentials. Financial unpredictability steers expansion toward secondary markets boasting surplus generation and friendlier tariff structures. Vendors that offer integrated financial-grade performance analytics help clients benchmark ROI under multiple rate scenarios, bolstering purchase confidence amid volatility.
IT refresh cycles outpacing electrical-plant payback periods
Servers now turn over every 3-4 years, while switchgear and UPS assets amortize over 15-20 years. This mismatch complicates capital planning inside the United States data center power market. New AI accelerators can spike rack draws beyond legacy design envelopes, stranding perfectly functional UPS modules that lack capacity headroom.[3] Enterprise operators press vendors for modular, hot-swappable power stages that scale in smaller increments, aligning capex with unpredictable compute roadmaps. Leasing models gain favor for batteries and generators, preserving liquidity for IT refreshes. As refresh cycles further compress, stranded electrical assets become balance-sheet liabilities, pushing CFOs to prioritize flexible architectures over the lowest first cost.
*Our forecasts treat driver/restraint impacts as directional, not additive. The impact forecasts reflect baseline growth, mix effects, and variable interactions.
Segment Analysis
By Component: UPS Systems Hold Primacy in High-Density Era
UPS systems generated the largest revenue slice in 2025, accounting for 36.04% of the United States data center power market. Lithium-ion chemistries with longer lifespans and smaller footprints now dominate new deployments, cutting maintenance visits and unlocking valuable white space. The Galaxy VXL platform illustrates how form-factor reductions enable higher cabinet densities without structural retrofits. Intelligent battery management enhances cycle life and provides state-of-health insights that feed predictive maintenance engines, securing uptime commitments demanded by AI workloads. Segment revenue is further buoyed by grid-interactive firmware that lets facilities provide frequency-regulation or spinning-reserve services, converting a pure cost center into a profit lever.
Power distribution units (PDUs) are the fastest-growing component line, set to post a 6.05% CAGR through 2031. Ultra-high-density racks require PDUs rated beyond 100 A per whip, with branch-level metering that reports temperature, load, and harmonics in real time. Software-definable outlet switching supports dynamic power capping, protecting feeder circuits from cascading overload.


By Data Center Type: Colocation Dominance Meets Hyperscale Acceleration
Colocation providers captured 45.10% of 2025 revenue, leveraging scale economics to deliver low latency across metropolitan footprints. Power reliability acts as a core differentiator; facilities tout sub-2 ms transfer times and sub-1.4 PUE averages during sales cycles. Rising energy costs, however, squeeze profit margins, compelling colos to deploy high-efficiency UPS blocks and reclaim waste heat for adjacent buildings where zoning permits. These strategies resonate with enterprise tenants under pressure to report Scope 2 emissions reductions, reinforcing colo value propositions.
Hyperscale and cloud service providers, expanding at an 8.05% CAGR, build multigigawatt campuses that reorder utility planning horizons. Mega-facility design guides call for N+1 battery strings at building-block increments of 16 MW, coupled with on-site gas turbines or fuel cells that guarantee 48-hour autonomy.
By Data Center Size: Large Sites Lead, Mega Sites Surge
Large data centers, spanning 20-100 MW, retained 47.75% United States data center power market share in 2025. Operators prize their flexibility: these sites balance economy of scale with incremental expansion through additional halls or adjacent parcels. Medium-voltage feeders and centralized battery rooms optimize conductor runs, lowering line losses relative to smaller footprints. Power monitoring systems aggregate data across halls, enabling enterprise customers to audit energy use against sustainability targets.
Mega facilities are the fastest-growing cohort at 9.1% CAGR. Their scale mandates medium-voltage internal distribution and often 2N+1 redundancy, combining dual utility substations with redundant on-site generation. These campuses pioneer closed-loop water-cooling paired with direct-to-chip power delivery at 54 V, shaving resistive losses in conductor paths.
By Tier Level: Tier III Dominance and Tier IV Momentum
Tier III architectures captured 56.40% of 2025 revenue, balancing cost and uptime by offering concurrent maintainability without full 2N redundancy. Standard practice includes distributed redundant UPS blocks feeding dual power strips, allowing maintenance windows without shutdowns. Many operators overlay Tier III mechanical designs with Tier IV-grade controls, such as automatic static transfer switches, to reach de facto Tier III+ performance.
Tier IV facilities, growing at 8.35% CAGR, are purpose-built for AI model training, algorithmic trading, and healthcare imaging, where downtime translates directly into revenue or life-safety risk. Designs feature 2N electrical paths, redundant utility feeds, and fuel reserves exceeding 72 hours. Procurement teams scrutinize component Mean Time Between Failure values, favoring switchgear qualified for 10,000 mechanical operations.
Geography Analysis
Texas is in growth velocity, propelled by abundant wind- and solar-rich generation, an independent grid, and business-friendly permitting. Data-center power consumption has quadrupled since 2020, catalyzing multibillion-dollar commitments such as a USD 10 billion AI campus outside Dallas. Recent winter storm outages sharpened focus on dual-fuel generation and battery storage, spurring innovation in micro-grid orchestration that blends natural gas turbines with 100 MWh battery blocks for black-start capability.
Emerging hubs in Arizona, Nevada, and Ohio offer inexpensive land, renewable energy pipelines, and lower seismic risk than coastal alternatives. Local utilities negotiate bespoke rates tied to renewable adoption milestones, while state agencies streamline environmental approvals. Collaboration among power-equipment vendors, regulators, and grid operators accelerates substation buildouts, shortening lead times crucial to the United States data center power market expansion strategy. These rising regions are also piloting water-free cooling schemes suited to arid climates, demonstrating how geography dictates power-and-cooling co-design.
Competitive Landscape
Schneider Electric, Vertiv, and Eaton anchor the UPS and PDU segments, yet specialist entrants focusing on hydrogen fuel-cells, sodium-ion batteries, and power-aware silicon photonics are gaining visibility. Strategic partnerships multiply: Eaton and Siemens Energy launched an integrated on-site generation package featuring 500 MW modular plants that ship in containerized blocks eaton.com. Such alliances compress commissioning schedules, appealing to hyperscalers racing to meet AI demand.
Technology differentiation centers on intelligence, connectivity, and sustainability. Vendors now embed digital twins inside switchgear; operators simulate failure scenarios and track carbon intensity in real time. Fuel-cell suppliers tout near-zero particulate emissions and readiness for green-hydrogen blends, capturing mindshare among municipalities proposing stricter diesel-generator limits. The United States data center power market thus rewards suppliers that demonstrate both ESG compliance and lifecycle cost advantages, pushing laggards toward joint ventures or M&A exits.
White-space opportunities include edge-optimized micro-UPS platforms, AI-ready 100 kW rack power shelves, and software-defined power controls that orchestrate heterogeneous storage lithium-ion, sodium-ion, flywheel in a single stack. Entry barriers fall as contract manufacturers offer private-label builds, yet incumbents leverage global service fleets and decades-long warranty programs to retain enterprise clients wary of up-start risk. On balance, supplier jockeying intensifies, but no player yet consolidates share beyond moderate thresholds, preserving buyer leverage across most product classes.
United States Data Center Power Industry Leaders
ABB Ltd
Schneider Electric SE
Vertiv Holdings Co
Eaton Corp plc
Caterpillar Inc
- *Disclaimer: Major Players sorted in no particular order

Recent Industry Developments
- June 2025: Eaton and Siemens Energy unveiled a 500 MW modular on-site power plant concept for data centers, promising two-year schedule compression.
- May 2025: Chevron, GE Vernova, and Engine No. 1 launched a program to supply up to 4 GW of natural-gas power paired with carbon-capture for AI data centers.
- April 2025: A USD 10 billion plan was announced to convert a former coal plant in Homer City, Pennsylvania into a 4.5 GW natural-gas-powered AI campus.
- March 2025: Microsoft and BlackRock committed USD 30 billion to develop next-generation data centers featuring advanced power management and sustainability features.


Research Methodology Framework and Report Scope
Market Definitions and Key Coverage
Our study defines the United States data center power market as the yearly revenue generated from the sale, installation, and long-term service of electrical infrastructure, principally uninterruptible power supplies, switchgear, power distribution units, back-up generators, battery systems, and associated monitoring software that ensures continuous, conditioned electricity for IT loads inside purpose-built data centers of every tier and size.
Scope exclusion: Cooling equipment, building management software, transformers owned by utilities, and power hardware inside enterprise server rooms that fall below 50 kW are excluded.
Segmentation Overview
- By Component
- Electrical Solutions
- UPS Systems
- Generators
- Diesel Generators
- Gas Generators
- Hydrogen Fuel-cell Generators
- Power Distribution Units
- Switchgear
- Transfer Switches
- Remote Power Panels
- Energy-storage Systems
- Service
- Installation and Commissioning
- Maintenance and Support
- Training and Consulting
- Electrical Solutions
- By Data Center Type
- Hyperscaler/Cloud Service Providers
- Colocation Providers
- Enterprise and Edge Data Center
- By Data Center Size
- Small Size Data Centers
- Medium Size Data Centers
- Large Size Data Centers
- Massive Size Data Centers
- Mega Size Data Centers
- By Tier Level
- Tier I and II
- Tier III
- Tier IV
Detailed Research Methodology and Data Validation
Primary Research
Mordor analysts conduct structured interviews with facility design engineers, colocation procurement leads, utility interconnection managers, and major UPS or PDU product managers across key hubs such as Northern Virginia, Dallas, Phoenix, and Hillsboro. These conversations verify shipment volumes, average selling prices, redundancy preferences, and commissioning timelines, thereby filling granular gaps left by desk work.
Desk Research
We start with publicly available cornerstones such as U.S. Energy Information Administration load data, Federal Energy Regulatory Commission interconnection queues, EPA ENERGY STAR datasets, Uptime Institute tier certification registries, and industry association briefs from AFCOM or the Open Compute Project. Company 10-Ks, utility transmission plans, and reputable press releases complement these sources and anchor trend lines. Proprietary feeds from D&B Hoovers and Dow Jones Factiva let our team cross-match project values, capex, and acquisition multiples. This list is illustrative; many additional repositories were tapped while screening and validating numbers.
Secondary material rarely reports revenue split by component or tier, so it mainly grounds macro totals, identifies announced capacity additions, and guides the questions we later take to primary contacts.
Market-Sizing & Forecasting
A blended top-down and bottom-up model is used. National data center IT load (MW) is reconstructed from utility filings and construction permits, then multiplied by typical power-infrastructure spend per deployed MW. Results are cross-checked through sampled supplier roll-ups and channel checks. Key variables include average rack density, prevailing PUE, lithium-ion UPS penetration, state-level tax incentives, and the count of hyperscale campuses awaiting grid tie-in. A multivariate regression with ARIMA error correction projects each driver, while scenario analysis adjusts for grid-delay risk. Where sampled ASPx volume estimates deviate beyond three percent from the top-down output, we revisit assumptions or recontact sources before locking the baseline.
Data Validation & Update Cycle
Every model passes a two-step analyst review in which variance against historical time series and third-party indicators is flagged. Outliers trigger a fresh round of calls. Reports are refreshed annually, and an interim update is issued when material events, such as a federal clean-energy credit change, shift market fundamentals.
Why Mordor's United States Data Center Power Baseline Stands Firm
Published figures often differ because firms mix cooling gear with electrical gear, apply global price lists to local deals, or roll Canada into U.S. totals. Our approach fixes geography to the fifty states, prices equipment at net-after-discount levels uncovered in interviews, and refreshes inputs each year rather than every three.
Benchmark comparison
| Market Size | Anonymized source | Primary gap driver |
|---|---|---|
| USD 15.22 B (2025) | Mordor Intelligence | - |
| USD 6.42 B (2024) | Global Consultancy A | Uses invoice value of only UPS units; excludes generators and services |
| USD 5.53 B (2024) | Industry Association B | Counts North-East installations only and omits hyperscale self-build spend |
| USD 7.69 B (2024) | Regional Consultancy C | Aggregates U.S. and Canadian revenues; applies list prices without discounting |
Differences stem mainly from scope, geography, and pricing assumptions. By tying revenues to clearly defined components, validating net prices with buyers, and updating variables on a tight cadence, Mordor Intelligence provides a balanced, traceable baseline decision-makers can rely on.


Key Questions Answered in the Report
What is the current size of the United States data center power market?
The market stands at USD 16.17 billion in 2026 and is projected to reach USD 21.89 billion by 2031.
Which component segment leads spending today?
UPS systems lead with 36.04% United States data center power market share, reflecting their critical role in delivering uninterrupted power to high-density racks.
How fast are Tier IV data centers growing?
Tier IV facilities, valued for full 2N redundancy, are expanding at an 8.35% CAGR through 2031 as mission-critical AI and financial workloads demand near-zero downtime.
What strategies help operators manage utility-rate volatility?
Popular approaches include fixed-price power purchase agreements, on-site generation, battery storage that cuts peak demand charges, and participation in demand-response programs.
Are tax incentives significantly influencing technology choices?
Yes, federal and state incentives for green power infrastructure shorten payback periods for fuel cells, battery storage, and efficiency upgrades, accelerating their adoption in new builds.
Page last updated on:


