
Technology, Media and Telecom
5th MayPricing Strategy for Semiconductor Components
3 Min Read
New Zealand Data Center Power Market is Segmented by Component (Electrical Solutions, Services), by Data Center Type (Hyperscaler/Cloud Service Providers, Colocation Providers, and More), by Data Center Size (Small Size Data Centers, Medium Size Data Centers, Large Size Data Centers and More), by Tier Type (Tier I and II, Tier III, Tier IV). The Market Forecasts are Provided in Terms of Value (USD).
Market Overview
| Study Period | 2020 - 2031 |
|---|---|
| Base Year For Estimation | 2025 |
| Forecast Data Period | 2026 - 2031 |
| Market Size (2026) | USD 145.38 Million |
| Market Size (2031) | USD 282.63 Million |
| Growth Rate (2026 - 2031) | 14.23 % CAGR |
| Market Concentration | Medium |
Major Players *Disclaimer: Major Players sorted in no particular order. Image © Mordor Intelligence. Reuse requires attribution under CC BY 4.0. |
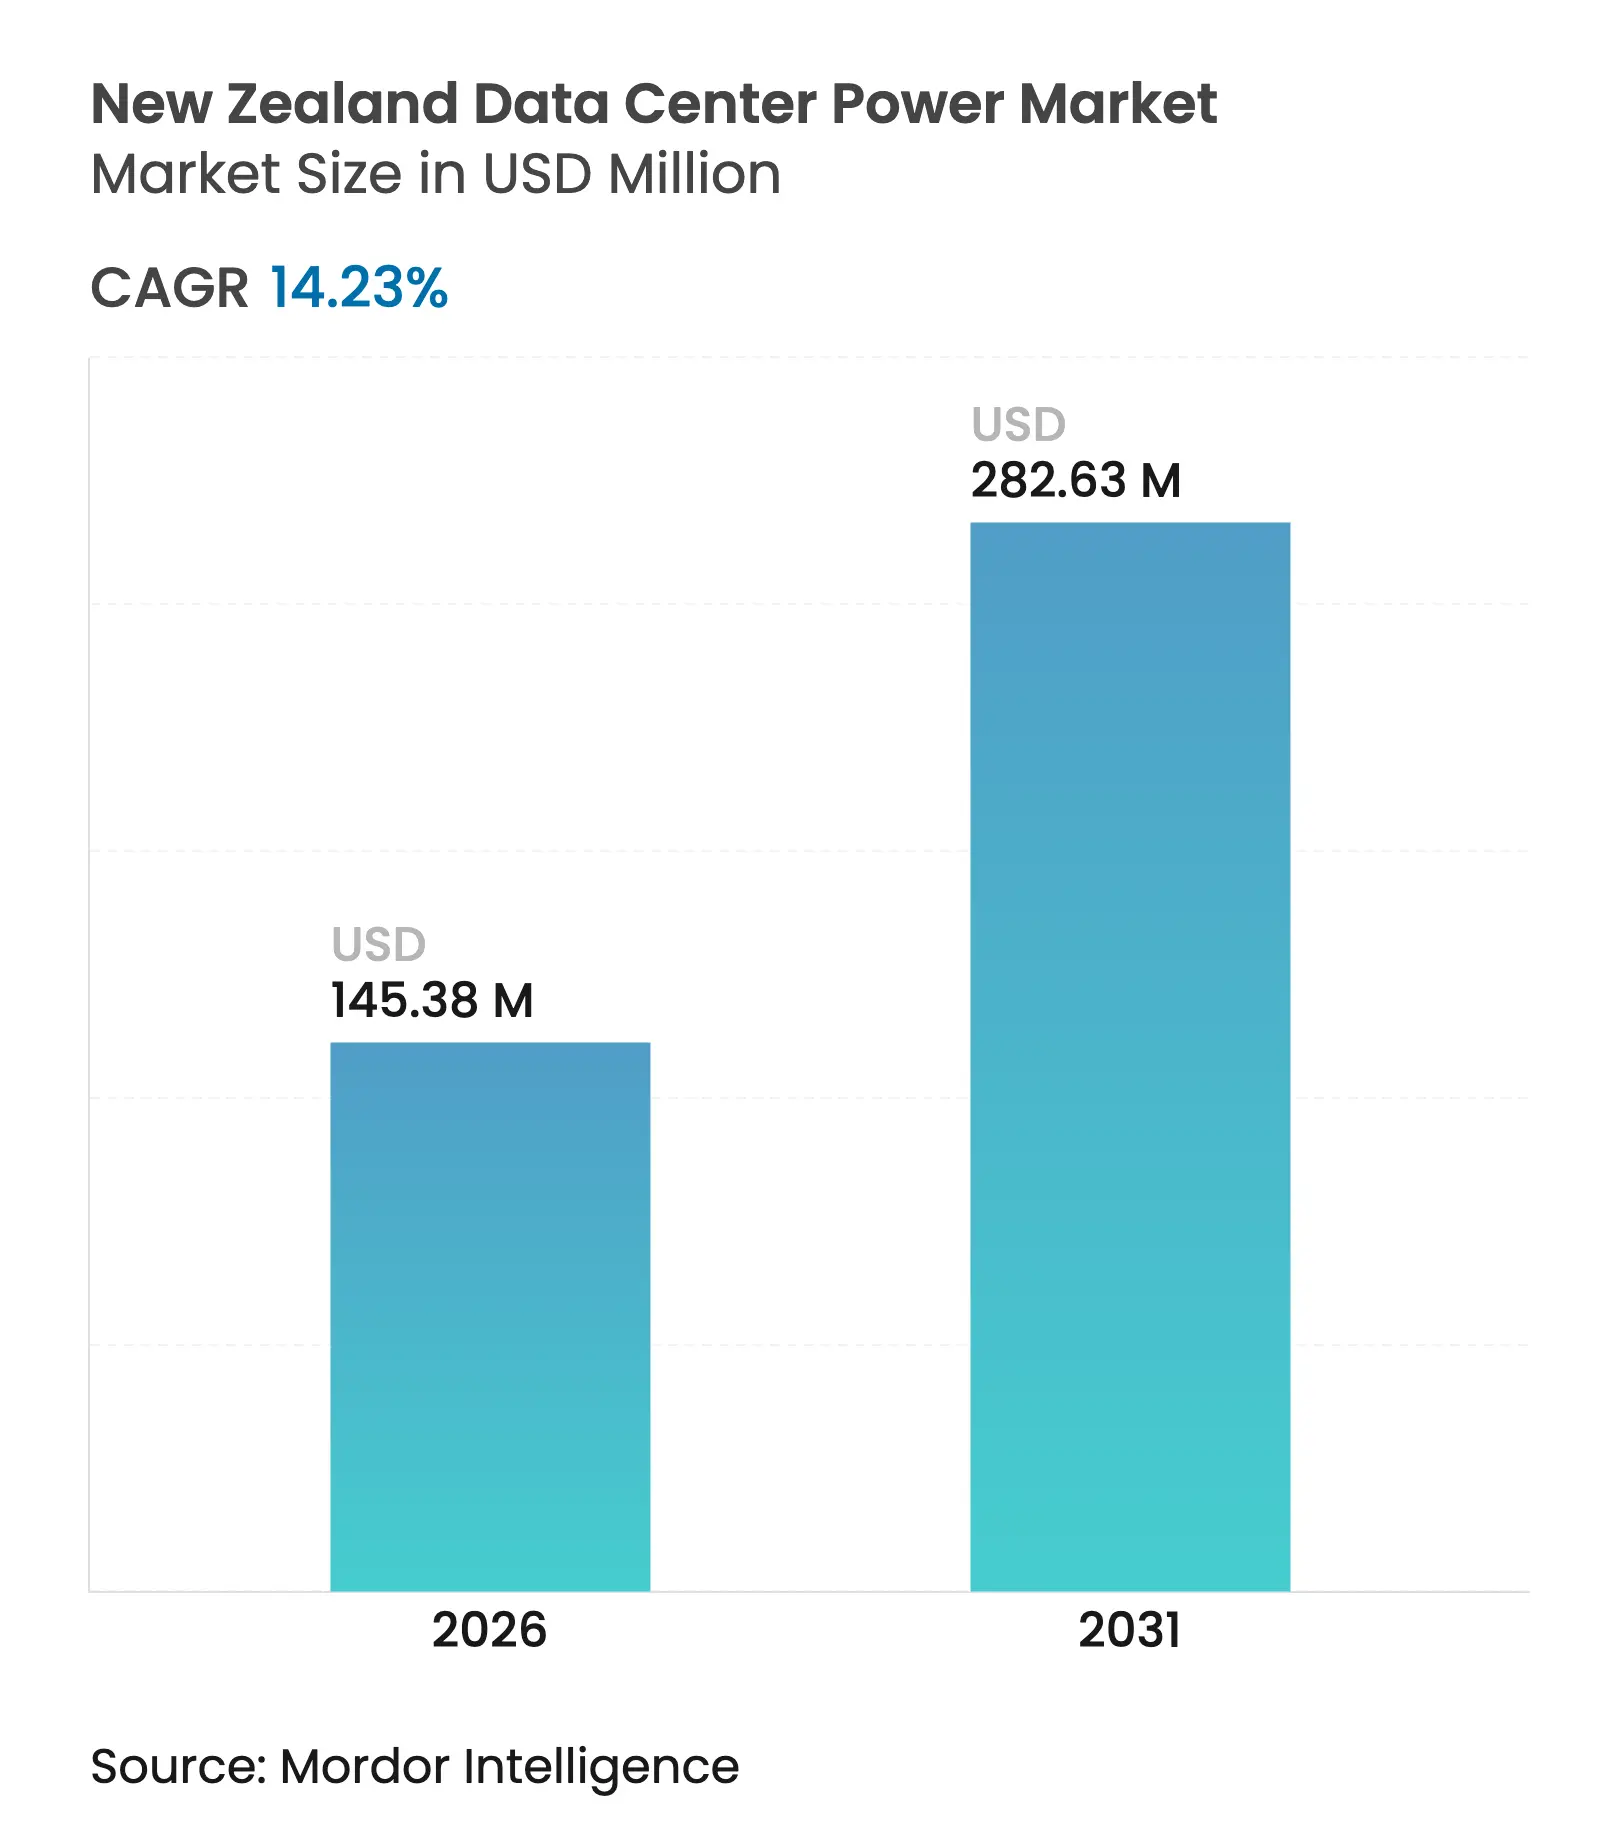
The New Zealand data center power market size is expected to grow from USD 127.28 million in 2025 to USD 145.38 million in 2026 and is forecast to reach USD 282.63 million by 2031 at 14.23% CAGR over 2026-2031. Operators are prioritizing high-efficiency UPS architectures, intelligent PDUs, and on-site storage to trim operating costs and satisfy stringent sustainability targets. Hydrogen fuel-cell pilots and grid-interactive battery systems are also moving from proof-of-concept to early deployment as providers seek resilience in a nation prone to seismic risk. Geographic diversification beyond Auckland has begun, with South Island sites leveraging cooler air for free cooling and abundant hydro capacity to cut power usage effectiveness ratios. Competitive differentiation is shifting toward carbon metrics rather than only PUE, pushing vendors to integrate real-time carbon monitoring and renewable matching into power platforms.
Key Report Takeaways
Note: Market size and forecast figures in this report are generated using Mordor Intelligence's proprietary estimation framework, updated with the latest available data and insights as of 2026.
Drivers Impact Analysis
| Driver | (~) % Impact on CAGR Forecast | Geographic Relevance | Impact Timeline | |||
|---|---|---|---|---|---|---|
Hyperscale and cloud adoption
Hyperscale and cloud adoption
| +4.2% | National; focused in Auckland | Medium term (2-4 years) |
(~) % Impact on CAGR Forecast
:
+4.2%
|
Geographic Relevance
:
National; focused in Auckland
|
Impact Timeline
:
Medium term (2-4 years)
|
High-efficiency power architectures
High-efficiency power architectures
| +3.1% | National | Short term (≤ 2 years) | |||
Renewable-energy and carbon-neutral mandates
Renewable-energy and carbon-neutral mandates
| +2.8% | National | Long term (≥ 4 years) | |||
Submarine-cable expansion for edge services
Submarine-cable expansion for edge services
| +1.9% | Auckland and Wellington coastlines | Medium term (2-4 years) | |||
Off-peak renewable surplus incentives
Off-peak renewable surplus incentives
| +1.3% | South Island emphasis | Medium term (2-4 years) | |||
Cool marine climate for free-air cooling
Cool marine climate for free-air cooling
| +0.7% | South Island coasts | Short term (≤ 2 years) | |||
| Source: Mordor Intelligence | ||||||
Rising adoption of hyperscale and cloud data centers
AWS will bring a USD 4.24 billion region online in Auckland in 2025, and Microsoft’s first Azure region became operational in 2024, each requiring 20–40 MW per campus, twice the typical enterprise load. Auckland’s installed data-center power is therefore projected to double to almost 100 MW by 2027, forcing Transpower to accelerate grid reinforcement programs.[1]Transpower New Zealand Limited, “Transmission Planning Report 2023,” static.transpower.co.nz Hyperscale operators are piloting high-voltage direct-current distribution that offers 10-15% efficiency gains over AC, reflecting a broader pivot toward deep energy savings.
Growing need to cut OPEX via high-efficiency power architectures
Next-generation UPS platforms now exceed 99% efficiency, shaving several megawatt-hours of losses annually compared with legacy 94–96% units. ABB’s PCS100 medium-voltage UPS combines that efficiency with modularity up to 6 MVA, enabling operators to scale capacity as rack density.[2]ABB Ltd., “Complete Power Protection at Medium Voltage,” library.e.abb.com AI-driven power analytics embedded in Vertiv’s SmartAisle 3 allow predictive maintenance that can lower unscheduled downtime and reduce energy outlays.
Government renewable-energy and carbon-neutral mandates
Electricity generation is already 87% renewable and the policy pathway targets 96-98% by 2050. Data-center operators respond by contracting certified zero-carbon electricity, such as Microsoft’s supply agreement with Ecotricity for its three facilities. State-backed initiatives like the NZ Battery Project aim to buffer intermittent wind and hydro, reinforcing power quality for mission-critical loads.
Expansion of submarine cable connectivity enabling edge services
Seven cables in service and three more planned by 2027 are shortening latency to the United States, Australia, and the Pacific Islands. The forthcoming Hawaiki Nui route is prompting edge-node build-outs near landing stations, each demanding compact but highly reliable power blocks. Prefabricated, containerised UPS-battery assemblies are gaining ground because they can be installed in weeks rather than months.[3]
Restraints Impact Analysis
| Restraint | (~) % Impact on CAGR Forecast | Geographic Relevance | Impact Timeline | |||
|---|---|---|---|---|---|---|
High capex and maintenance costs
High capex and maintenance costs
| -2.1% | National | Short term (≤ 2 years) |
(~) % Impact on CAGR Forecast
:
-2.1%
|
Geographic Relevance
:
National
|
Impact Timeline
:
Short term (≤ 2 years)
|
Grid capacity limits and price volatility
Grid capacity limits and price volatility
| -1.8% | Auckland urban cluster | Medium term (2-4 years) | |||
Seismic design premiums
Seismic design premiums
| -1.2% | National; highest in Wellington | Long term (≥ 4 years) | |||
Limited local manufacturing lead-times
Limited local manufacturing lead-times
| -0.9% | National | Medium term (2-4 years) | |||
| Source: Mordor Intelligence | ||||||
High installation and maintenance costs of advanced power systems
Tier IV electrical fit-outs are 25–30% more expensive than Tier III, challenging return-on-investment for smaller operators. The domestic talent pool for servicing MV UPS and STATCOMs is tight, so providers must import expertise or sign premium service contracts, adding to lifetime cost. Power-as-a-service models that shift capex to opex are under trial, yet commercial uptake remains nascent.
Grid capacity constraints and volatile electricity prices
Transpower models a significant climb in national consumption by 2050, with data centers singled out as a top growth driver. Growth concentration in Auckland forces new builds to co-fund substation upgrades, while reliance on coal-fired peakers during winter peaks adds both cost and emissions uncertainty.transpower.co.nz. Hybrid on-site generation coupled with battery storage is gaining traction, though economic viability hinges on facility scale and location.
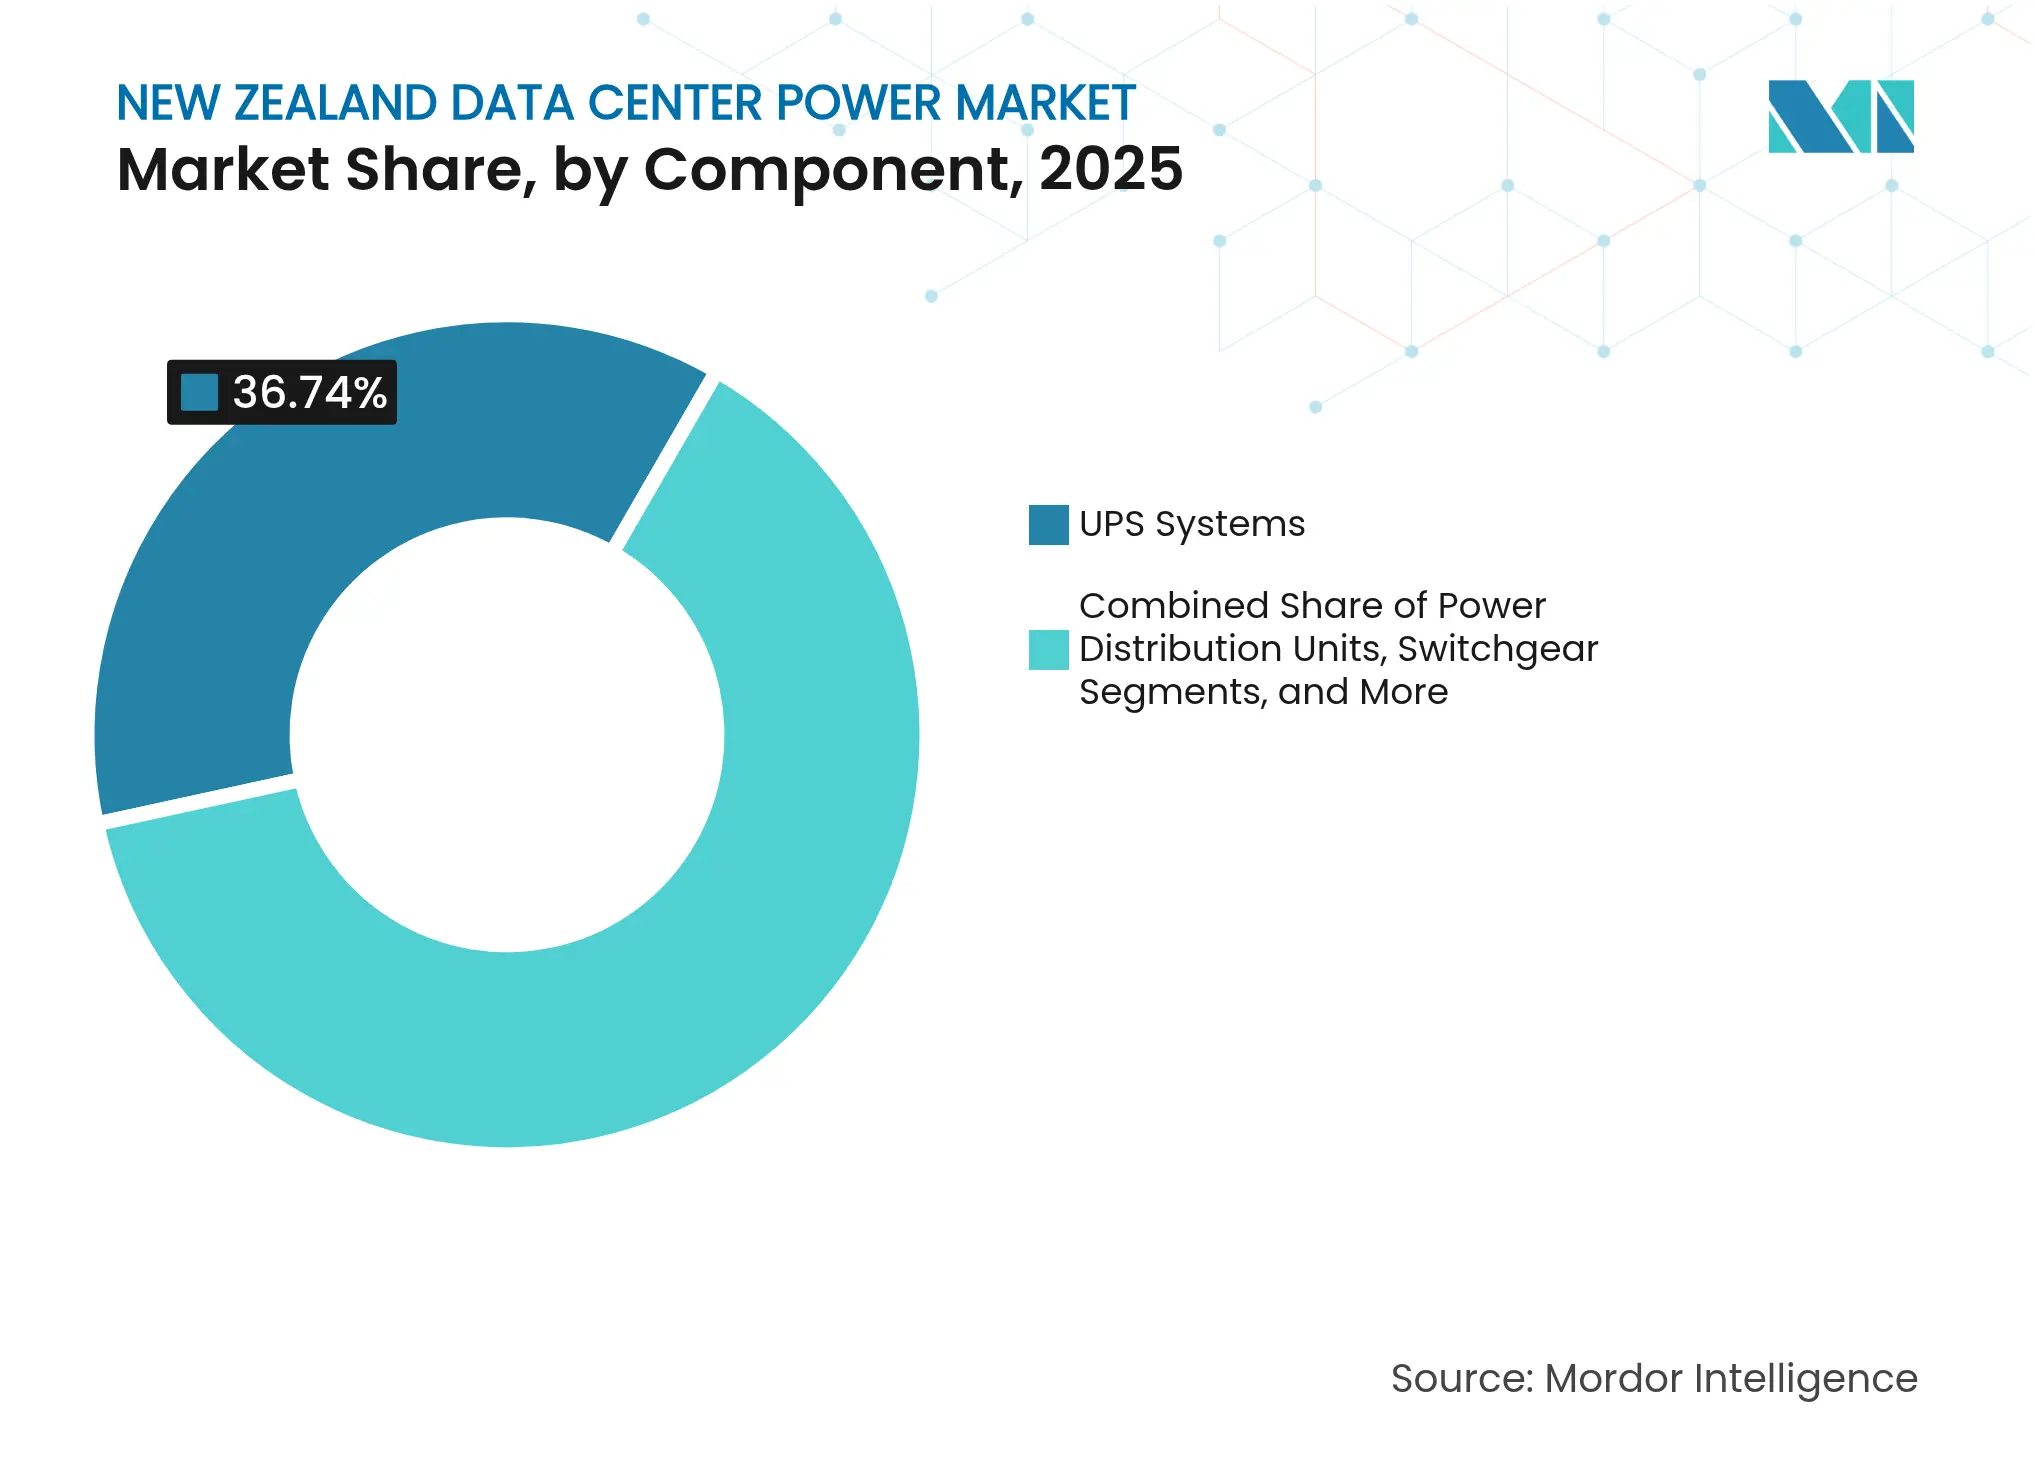
By Component: UPS leadership underpins critical power resilience
The New Zealand data center power market recorded UPS systems capturing 36.74% share in 2025, reflecting their central role in ride-through capability during grid disturbances. Modular designs enable N+1 or 2N topologies without over-provisioning, a priority in seismically active zones where runtime continuity is paramount. ABB’s 99%-efficient PCS100 is popular among mega-site operators because it slots into existing MV switchboards without derating, preserving floor space and reducing cooling loads. Operators pair these UPS blocks with lithium-ion strings that provide higher energy density and faster recharge than legacy VRLA, further enhancing availability.
PDUs are the fastest-growing component, rising at a 15.05% CAGR as intelligent models deliver granular per-outlet monitoring, automated branch-circuit alerts, and remote firmware updates. Such visibility helps operators tune loads in real time, driving lower PUE and meeting carbon reporting requirements. Switchgear, transfer switches, and remote power panels also see steady demand, while fuel-cell generators begin supplanting diesel in pilot deployments for carbon-free backup. Together, these dynamics keep the New Zealand data center power market on a technology-refresh cycle that favours efficiency and resilience upgrades every five to seven years.
Note: Segment shares of all individual segments available upon report purchase
By Data Center Type: Colocation capacity expands fastest
Colocation providers held 41.35% revenue share of the New Zealand data center power market in 2025 and are expanding at 15.9% CAGR, buoyed by enterprise outsourcing and by software-as-a-service firms seeking certified green power. CDC Data Centres’ plan to add 200 MW epitomises the scale of future builds and underscores how operators leverage renewable credentials to win multi-tenant contracts.
Hyperscalers follow close behind, driven by AWS and Microsoft expansions that prioritise fault-tolerant electrical designs and carbon-free backup. Enterprise and edge facilities remain smaller in aggregate capacity but are vital for compliance-sensitive workloads requiring data sovereignty and low latency. Edge deployments rely on prefabricated power pods that can be shipped to cable landing sites, offering <100 kW blocks with integrated lithium-ion storage. The diverse mix of facility types ensures that the New Zealand data center power market remains attractive across the value chain, from multi-megawatt switchgear suppliers to niche PDU innovators.
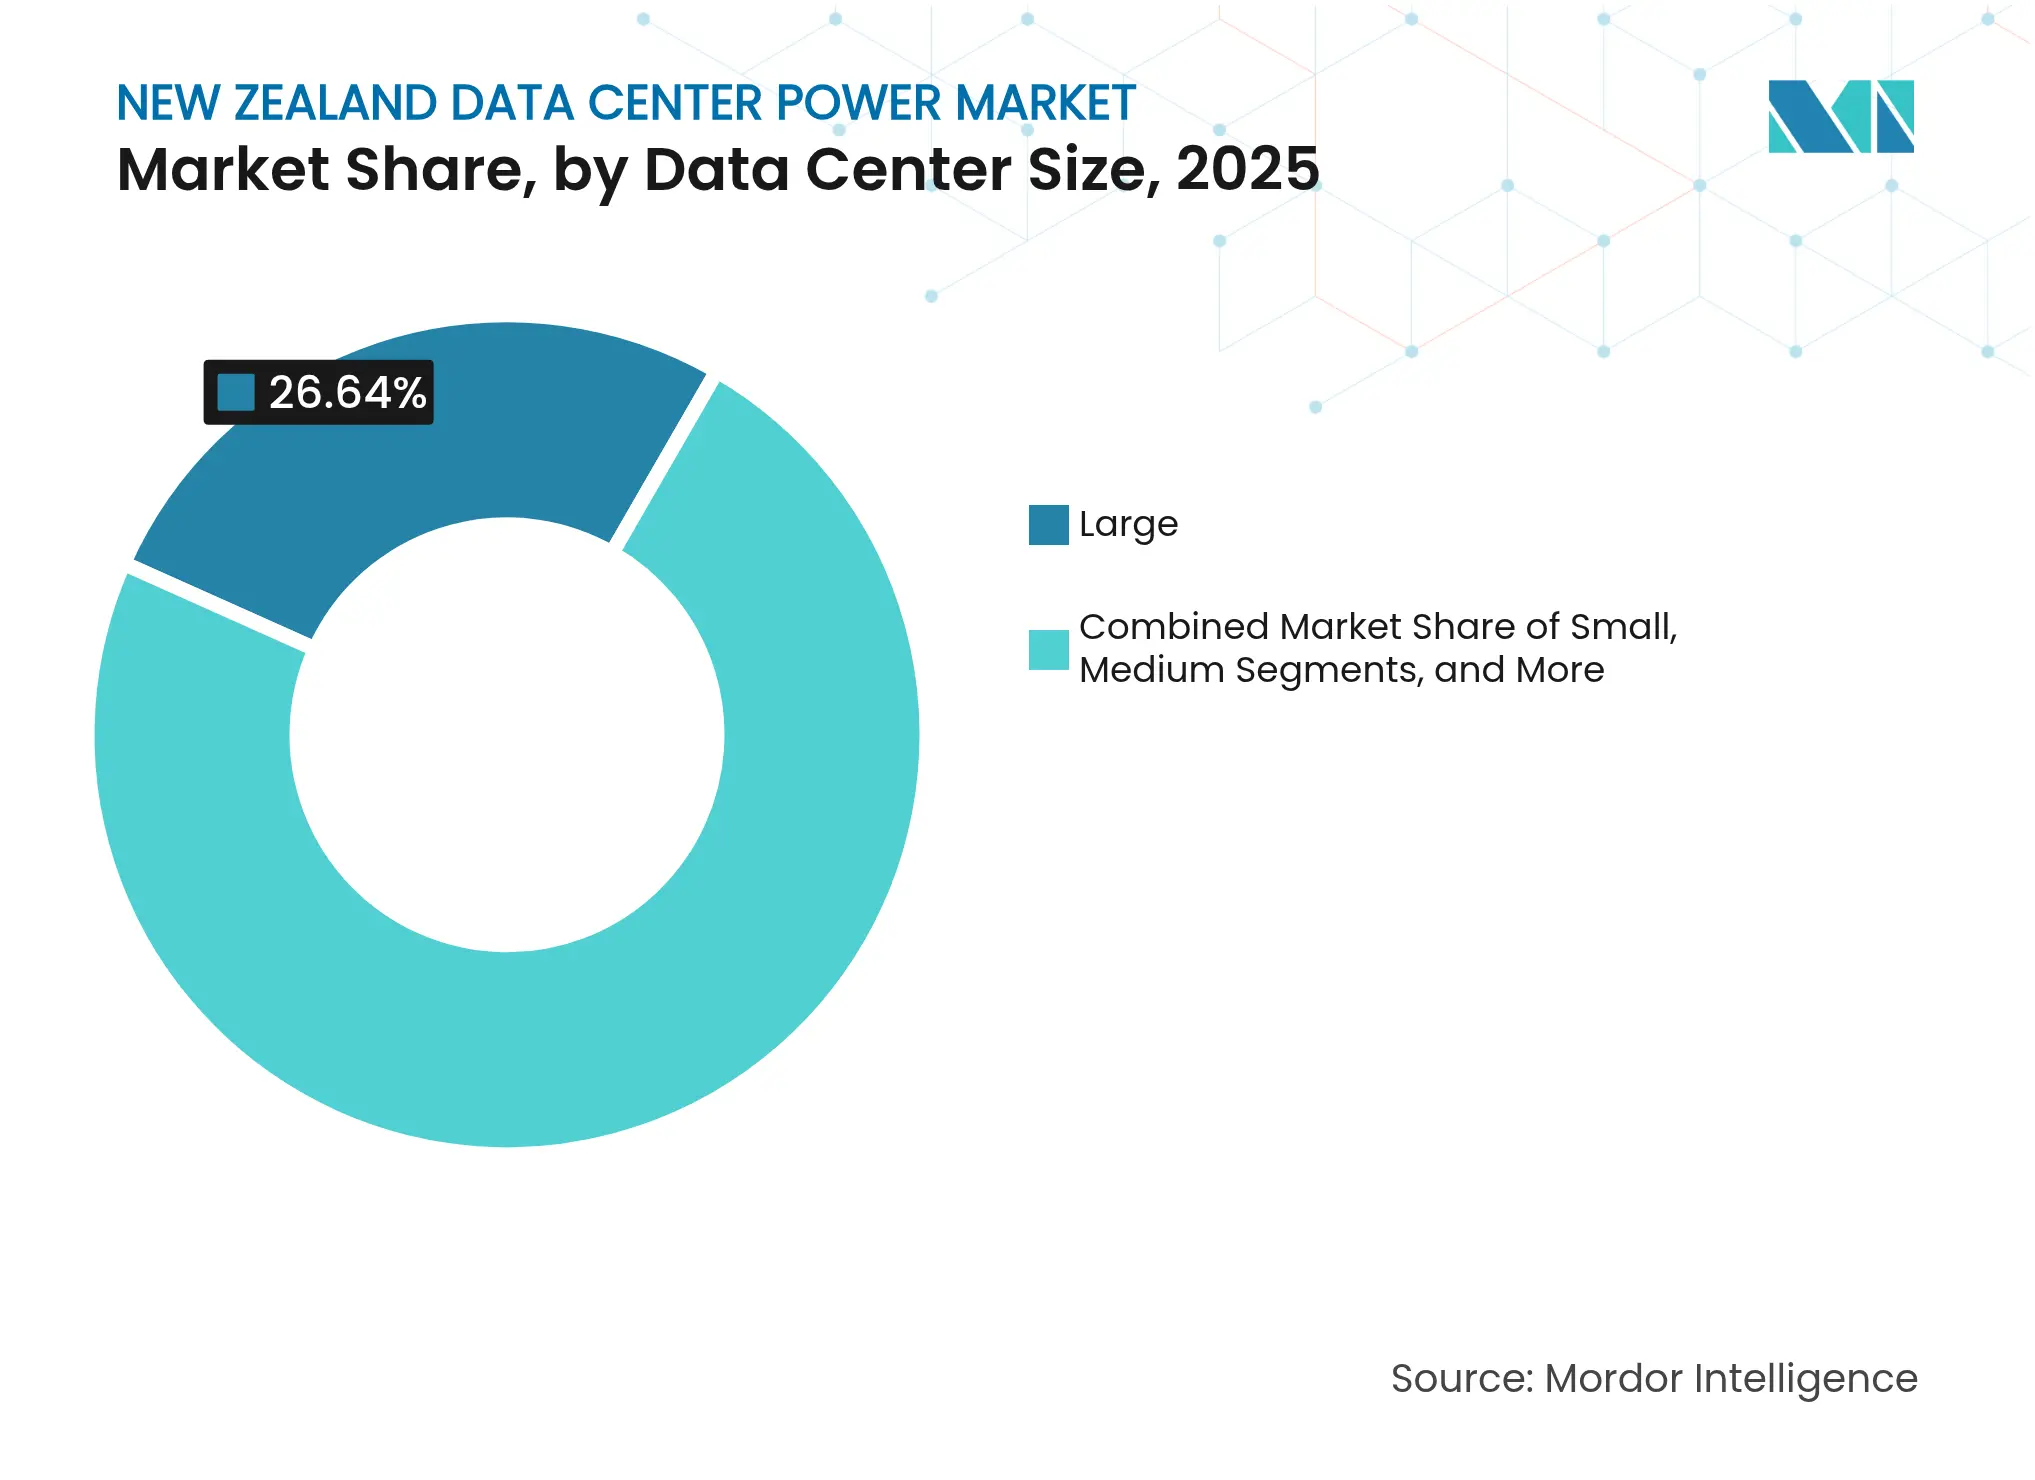
By Data Center Size: Large sites dominate, massive sites accelerate
Large data centers (5-10 MW) commanded a 26.64% share of the New Zealand data center power market size in 2025, striking a balance between scale economies and urban grid constraints. Many serve colocation tenants who demand expandable suites without incurring the risk of oversupply. Design templates typically feature ring-bus MV distribution and modular UPS strings to align capex with utilisation.
Massive sites (>20 MW) are the fastest-growing cohort at a 14.55% CAGR to 2031, driven by hyperscale cloud roadmaps. Their step-change in load density requires early engagement with Transpower to reinforce grid nodes and may include STATCOMs for voltage regulation, as implemented at the Ōtāhuhu substation in 2025. Medium and small facilities continue to serve niche requirements such as government, private cloud, and retail edge caching, ensuring a multi-tier demand structure that keeps the New Zealand data center power market diversified.
Note: Segment shares of all individual segments available upon report purchase
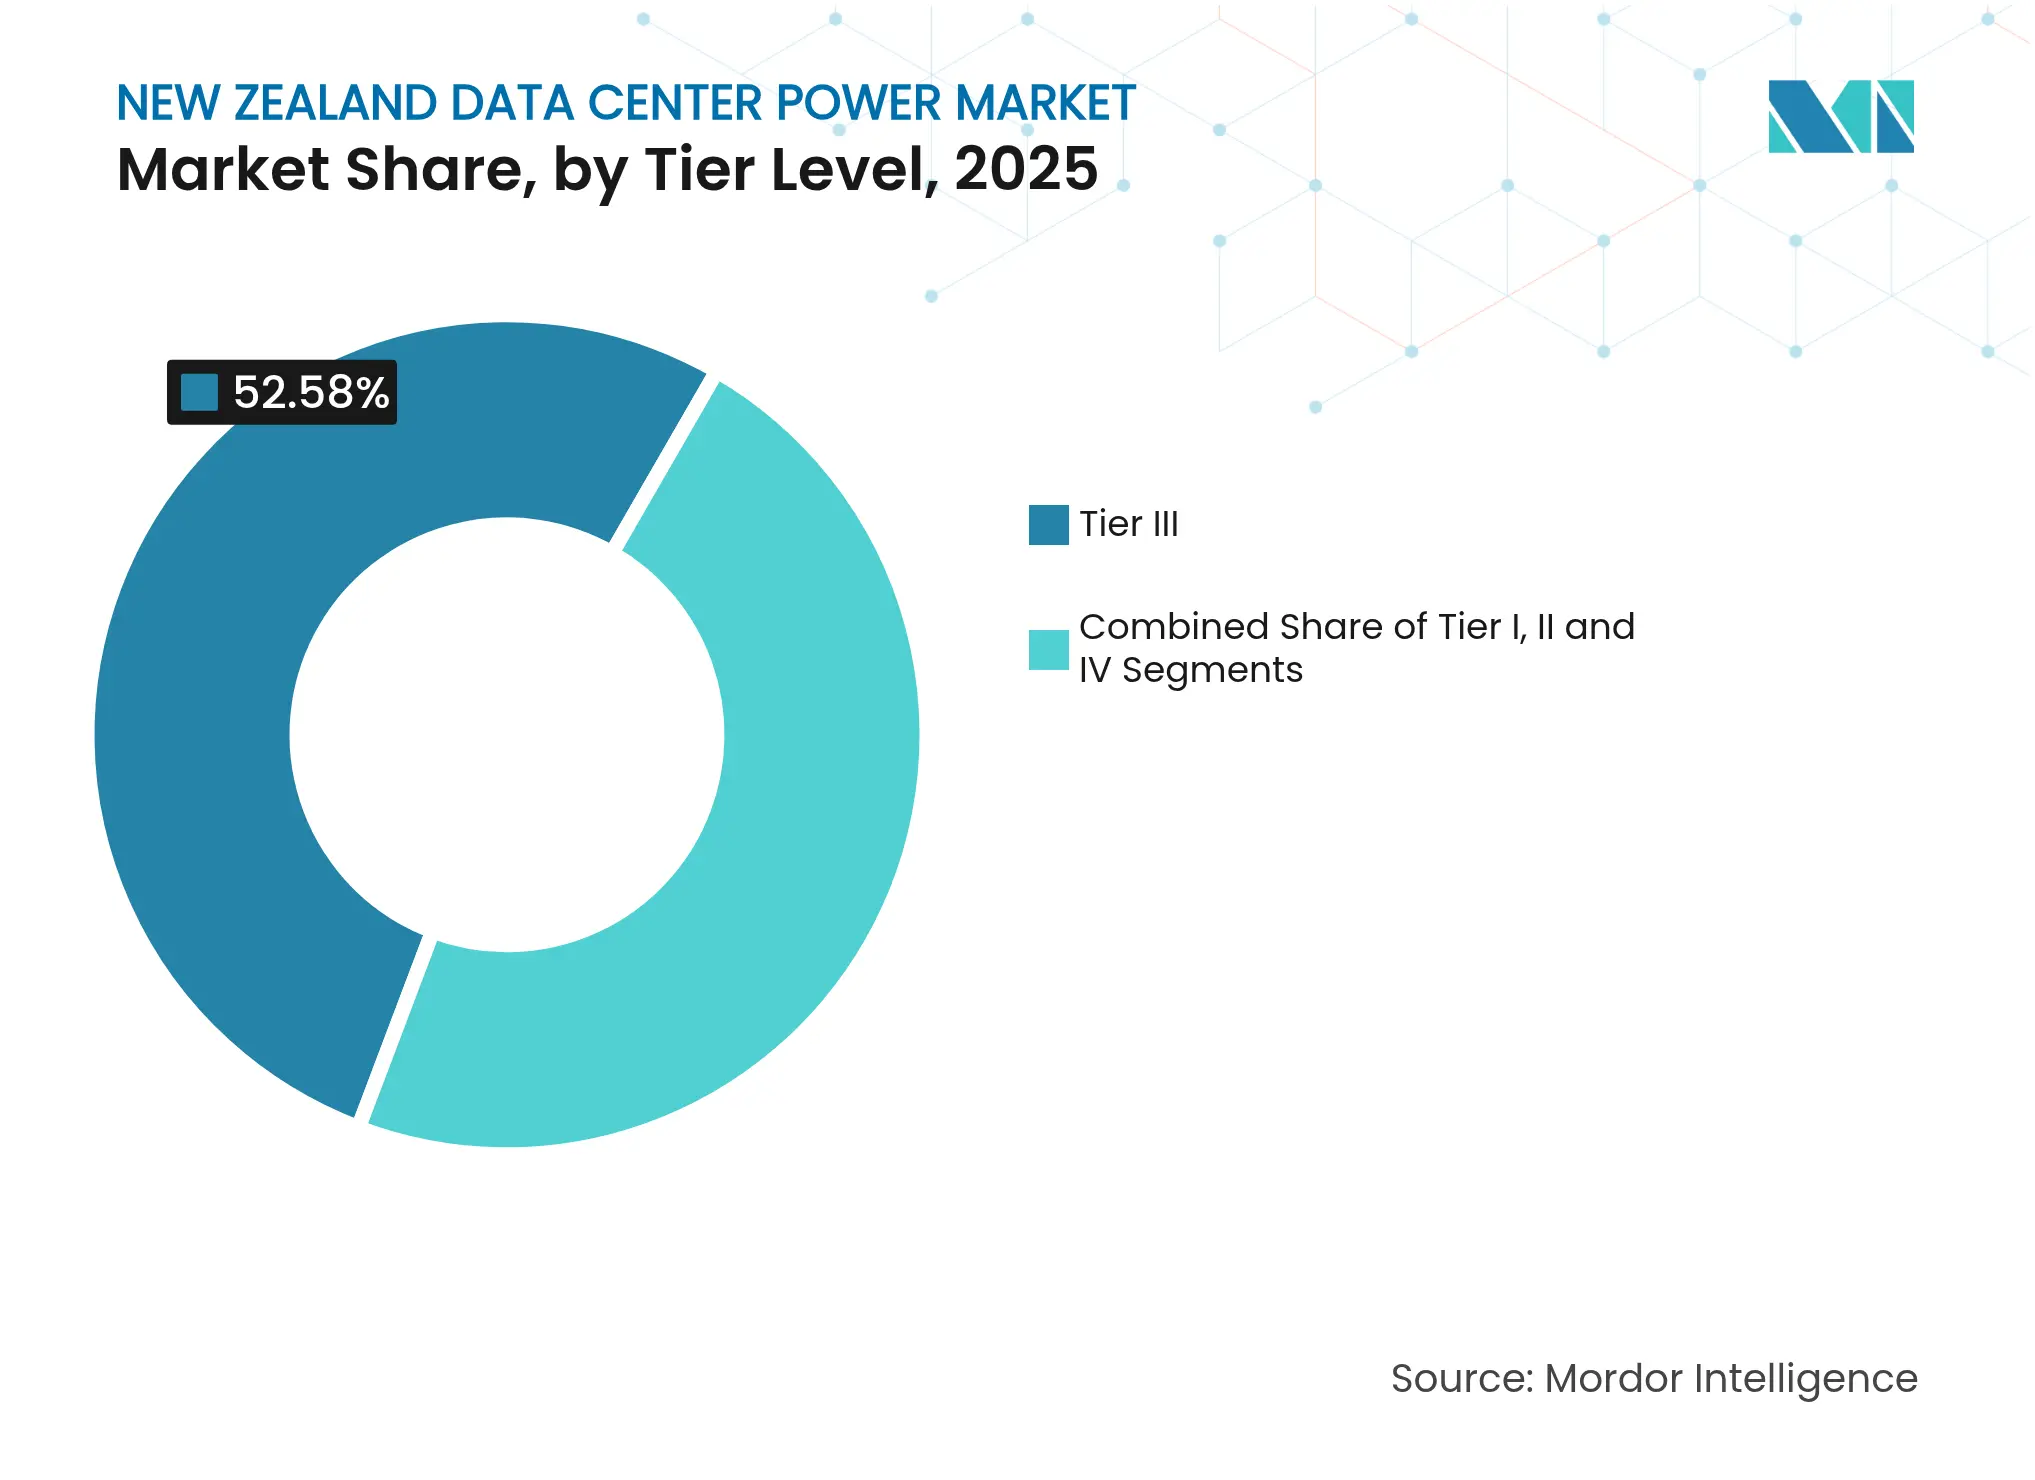
By Tier Level: Tier III remains mainstream while Tier IV gains ground
Tier III facilities held 52.58% of the New Zealand data center power market size in 2025, offering concurrent maintainability without the premium of full fault tolerance. Typical electrical topologies deploy N+1 UPS and multiple utility feeds, a configuration seen as sufficient for most financial services and SaaS clients.
Tier IV growth is strongest at 16.1% CAGR because hyperscalers and critical public-sector workloads require zero downtime. These designs layer 2N+1 UPS redundancy, segregated electrical rooms, and dual MV utility connections. Seismic bracing adds 15-20% to electrical installation costs, but operators accept the premium to guarantee uptime in quake-prone Wellington. Tier I and Tier II footprints continue shrinking as legacy enterprise rooms migrate into colocation footprints aligned with higher resilience expectations.
Note: Segment shares of all individual segments available upon report purchase
Auckland houses seven facilities totaling 49 MW, anchoring the New Zealand data center power market as the nation’s digital gateway. Vector’s ongoing underground-cable projects aim to reduce outage incidence, yet data-center load growth still outpaces distribution upgrades, prompting joint investment models where operators co-finance substations. Cooling relies increasingly on indirect evaporative systems that exploit the city’s temperate marine climate to limit compressor runtime.
Wellington represents an emerging cluster shaped by seismic realities. The Wellington Lifelines study quantifies NZD 3.9 billion in resilience capex that could avert NZD 6 billion in post-quake losses, underscoring the economic case for flexible cable trays, isolated switchgear skids, and quick-couple battery racks. Transpower lists the region as a priority for grid-hardening, with STATCOM installations planned to stabilise voltage amid rising electric-transport and data-center peaks.
South Island sites in Christchurch and Invercargill harness cooler ambient temperatures and proximity to hydro dams, enabling free-air cooling for 11-12 months per year. DLA Piper notes these factors could unlock a wave of sustainable builds once additional subsea cables land in 2026, effectively widening the New Zealand data center power market beyond its North Island stronghold. Transmission limitations remain a bottleneck, however, prompting discussions on dedicated high-voltage spurs to future hyperscale parks.
Market Concentration
Global OEMs dominate the New Zealand data center power market, yet tailor portfolios to local conditions. Schneider Electric combines lithium-ion UPS modules and EcoStruxure DCIM into integrated energy platforms that now embed machine-learning-based failure prediction, delivering 15-20% additional efficiency in pilot rollouts. Vertiv’s Liebert APM2 UPS offers hot-swappable power cores and 97.5% online efficiency, while SmartAisle 3 orchestrates dynamic load balancing for AI workloads. ABB leverages its PCS100 MV UPS for mega-sites where operators seek retrofit-friendly, high-efficiency modules.
Local systems integrators bridge international hardware with New Zealand’s seismic codes, providing flexible cable containment, shock-isolated switchboards, and commissioning services. Emerging niches include hydrogen fuel-cell generator projects led by Microsoft and Renewable Innovations, aiming for zero-carbon backup by 2030. Battery energy-storage vendors are positioning systems that couple UPS strings with peak-shaving algorithms to capture arbitrage from off-peak hydro surplus, aligning cost savings with carbon targets.
Competition is increasingly measured by carbon transparency rather than headline efficiency. Vendors now publish real-time CUE dashboards and interoperate with utility renewable-matching APIs. As green procurement policies tighten, supply-chain provenance and embodied-carbon disclosures have become bid differentiators, ensuring the New Zealand data center power market evolves toward holistic sustainability metrics.

*Disclaimer: Major Players sorted in no particular order
1. INTRODUCTION
2. RESEARCH METHODOLOGY
3. EXECUTIVE SUMMARY
4. MARKET LANDSCAPE
5. MARKET SIZE AND GROWTH FORECASTS (VALUE)
6. COMPETITIVE LANDSCAPE
7. MARKET OPPORTUNITIES AND FUTURE OUTLOOK
Market Definitions and Key Coverage
Segmentation Overview
Detailed Research Methodology and Data Validation
Primary Research
Desk Research
Market-Sizing and Forecasting
Data Validation and Update Cycle
Why Mordor's New Zealand Data Center Power Baseline Commands Reliability
Benchmark comparison
| Market Size | Anonymized source | Primary gap driver | ||
|---|---|---|---|---|
USD 127.8 M (2025) | Mordor Intelligence | - | Anonymized source:Mordor Intelligence | Primary gap driver:- |
USD 250 M (2024) | Global Consultancy A | Includes mechanical infrastructure and uses global ASP benchmarks | ||
USD 814 M (2024) | Industry Publisher B | Values entire data-center investment, not just power stack |
Pricing Strategy for Semiconductor Components
3 Min Read
Accelerating Additive Manufacturing Adoption in India
3 Min Read
Unlocking Saudi Arabia’s Regional Tourism Growth Potential
5 Min Read
When decisions matter, industry leaders turn to our analysts. Let’s talk.