Medical Power Supply Market Size and Share
Market Overview
| Study Period | 2020 - 2031 |
|---|---|
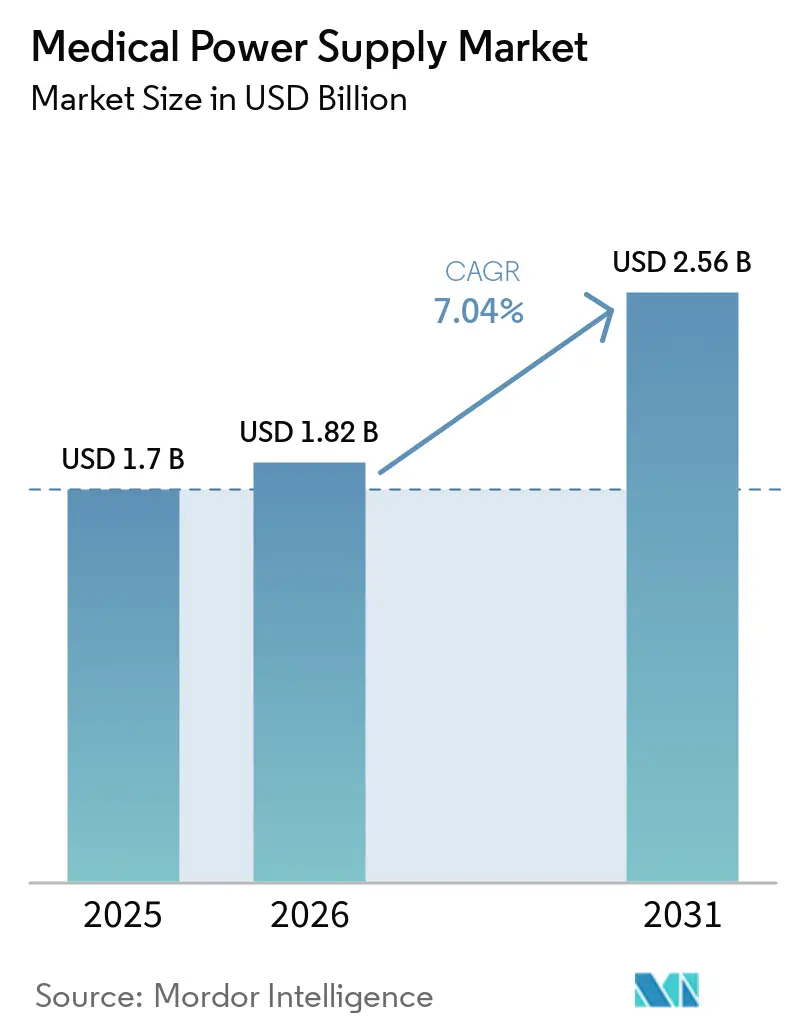
| Market Size (2026) | USD 1.82 Billion |
| Market Size (2031) | USD 2.56 Billion |
| Growth Rate (2026 - 2031) | 7.04% CAGR |
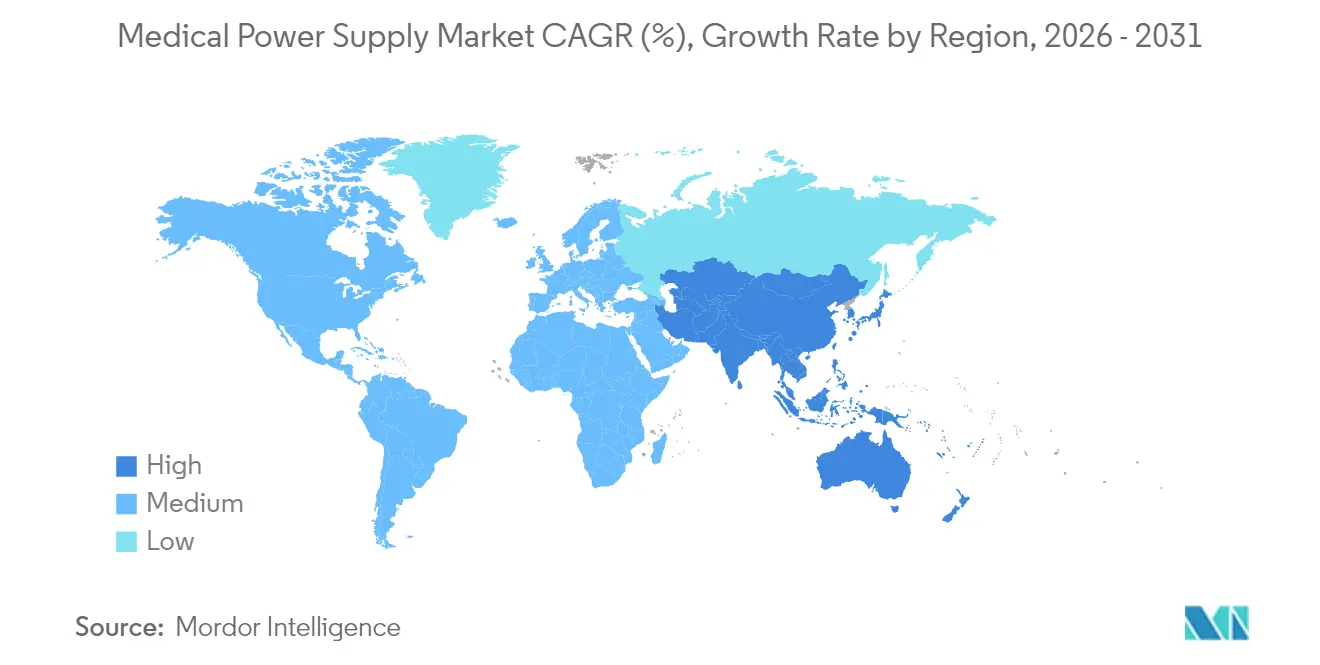
| Fastest Growing Market | Asia Pacific |
| Largest Market | North America |
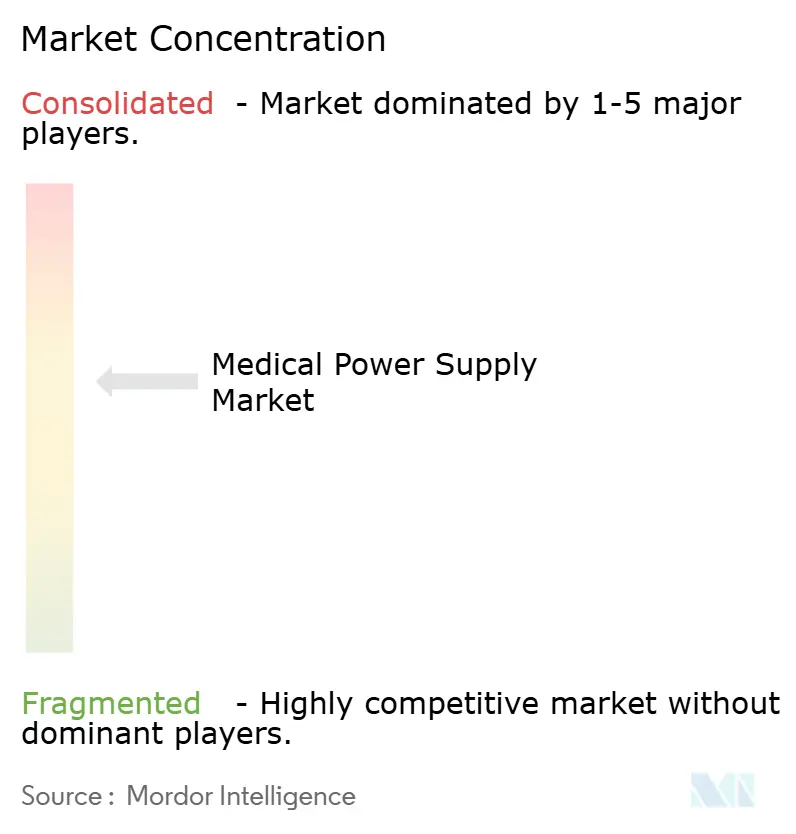
| Market Concentration | Medium |
Major Players
*Disclaimer: Major Players sorted in no particular order Image © Mordor Intelligence. Reuse requires attribution under CC BY 4.0. |
|
Medical Power Supply Market Analysis by Mordor Intelligence
The medical power supply market size was valued at USD 1.70 billion in 2025 and estimated to grow from USD 1.82 billion in 2026 to reach USD 2.56 billion by 2031, at a CAGR of 7.04% during the forecast period (2026-2031). Expansion reflects accelerated healthcare digitization, stricter safety codes, and the push for compact, high-efficiency architectures in portable and clinical equipment. Adoption of wide-bandgap semiconductors, notably GaN and SiC, enables conversion efficiencies above 95% and footprint reductions near 40%, giving suppliers measurable cost and performance advantages. Regulatory demands for >90% efficiency solutions, coupled with rising outpatient imaging fleets and home-based monitoring devices, sustain momentum across mature and emerging economies. North America retains leadership due to robust infrastructure and early technology adoption, while Asia-Pacific leads growth, powered by large-scale manufacturing incentives and policy support.
Key Report Takeaways
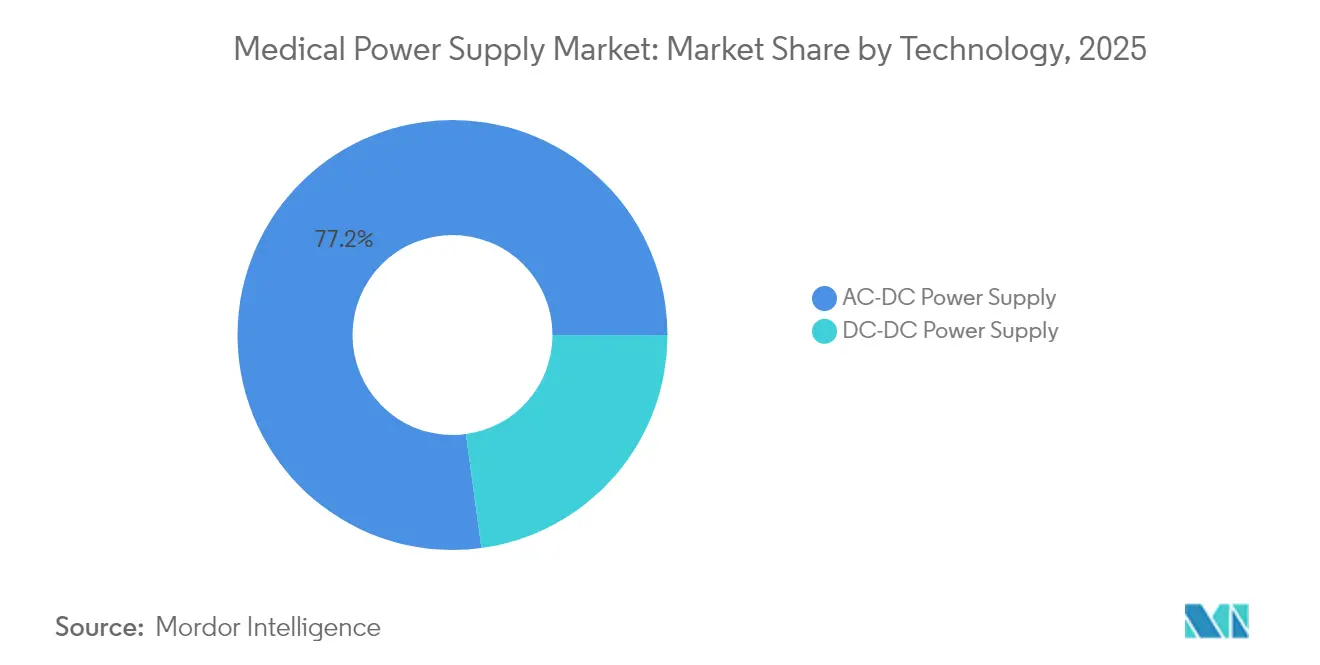
- By technology, AC-DC power supplies held 77.15% of medical power supply market share in 2025; DC-DC options record the highest 10.35% CAGR through 2031.
- By type, enclosed units led with 36.20% revenue share in 2025, whereas external adapters are projected to expand at a 9.25% CAGR to 2031.
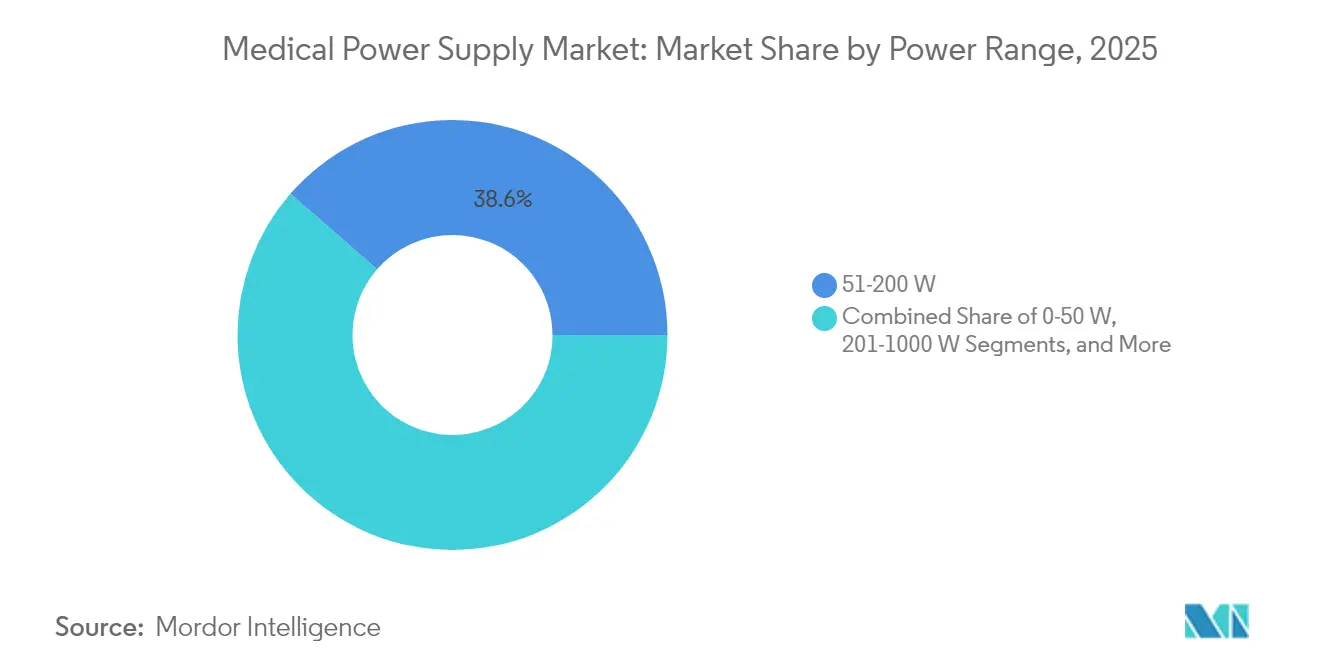
- By power range, 51-200 W devices commanded 38.60% share of the medical power supply market size in 2025, while the 201-1000 W band advances at 8.85% CAGR to 2031.
- By application, diagnostic and imaging systems captured 30.00% share in 2025, but home-healthcare devices represent the fastest 9.05% CAGR through 2031.
- By geography, North America contributed 36.80% of 2025 revenue; Asia-Pacific is set to grow at 9.45% CAGR during the forecast window.
Note: Market size and forecast figures in this report are generated using Mordor Intelligence’s proprietary estimation framework, updated with the latest available data and insights as of 2026.
Global Medical Power Supply Market Trends and Insights
Drivers Impact Analysis*
| Driver | (~) % Impact on CAGR Forecast | Geographic Relevance | Impact Timeline |
|---|---|---|---|
| Rapid miniaturisation via GaN and SiC switching devices | +1.8% | Global; strongest in North America and Asia-Pacific | Medium term (2-4 years) |
| Expansion of diagnostic-imaging fleets in outpatient centres | +1.5% | North America and Europe, expanding to Asia-Pacific | Long term (≥ 4 years) |
| Surge in home-based patient monitoring equipment | +2.1% | Global; accelerated in developed markets | Short term (≤ 2 years) |
| Decarbonisation mandates pushing >90% conversion-efficiency PSUs | +1.2% | Europe and North America; spillover to Asia-Pacific | Long term (≥ 4 years) |
| Digitally-controlled, remotely-monitored supply units (power-as-a-service) | +0.9% | North America and Europe initially; global expansion | Medium term (2-4 years) |
| Source: Mordor Intelligence | |||
Rapid Miniaturisation via GaN and SiC Switching Devices
Wide-bandgap semiconductors raise switching frequencies beyond 1 MHz while sustaining better than 95% conversion efficiency, enabling smaller, lighter supplies for clinical and portable gear. [1]Navitas Semiconductor, “GaN and SiC Technologies at PCIM 2025,” navitassemi.com Transitioning to 300 mm GaN wafers trims production cost 30%, encouraging uptake beyond premium platforms. Investor backing, such as the USD 32 million Series C secured by Cambridge GaN Devices, signals confidence in further 30% energy-saving potential. Medical device OEMs leverage these gains to shrink product footprints up to 40% and introduce compact CT and MRI systems suited to smaller clinics, broadening diagnostic access across underserved regions.
Expansion of Diagnostic-Imaging Fleets in Outpatient Centres
Migration of imaging services away from hospitals increases demand for power supply units designed for variable electrical environments. Vizient reports double-digit volume growth in CT and PET scans as ambulatory centres broaden capacity. [2]Vizient Inc., “Growing Demand for Imaging Services,” vizientinc.com Converting research scanners to clinical use, like recent actions at North Carolina Baptist Hospital, illustrates this decentralisation trend. Power supplies must deliver strong EMI suppression, flexible input ranges, and modular scalability to support phased equipment roll-outs and AI-enabled imaging workflows.
Surge in Home-Based Patient Monitoring Equipment
Provider use of remote monitoring hit 81% in 2023, buoyed by new reimbursement codes that pair RPM with chronic care management services. Devices demand ultra-low leakage currents (<10 µA) and Type BF/CF isolation for patient safety. Advances in context-aware biosensors by STMicroelectronics extend battery life while enabling richer datasets. Power-as-a-service frameworks emerge, shifting ownership of power assets to suppliers who bill based on usage, easing capital outlays for healthcare providers.
Decarbonisation Mandates Pushing >90% Conversion-Efficiency PSUs
Healthcare contributes nearly 5% of worldwide emissions, driving energy-efficiency mandates across facilities. Massachusetts’ USD 4.99 billion plan for 2025-2027 targets high-efficiency electrification in hospitals, creating a pull for >92% efficient power solutions. The U.S. Department of Energy highlights medical devices as a prime sector for 20-30% energy savings via wide-bandgap electronics. Vendors respond with GaN-based architectures touching 98% efficiency, aligning product portfolios with emerging green-procurement metrics at leading health systems.
Restraints Impact Analysis*
| Restraint | (~) % Impact on CAGR Forecast | Geographic Relevance | Impact Timeline |
|---|---|---|---|
| IEC 60601-1 "4th-edition" EMC upgrade costs | -1.1% | Global; highest impact in Europe | Short term (≤ 2 years) |
| Semiconductor supply-chain volatility for high-voltage MOSFETs | -0.8% | Global; concentration in Asia-Pacific manufacturing | Medium term (2-4 years) |
| Tariff-driven cost spikes on Chinese magnetics & capacitors | -0.6% | North America and Europe importing from China | Short term (≤ 2 years) |
| Thermal management limits in sub-1-inch open-frame designs | -0.4% | Global; affecting miniaturised applications | Long term (≥ 4 years) |
| Source: Mordor Intelligence | |||
IEC 60601-1 “4th-Edition” EMC Upgrade Costs
Enhanced EMC rules and risk-management protocols impose significant compliance complexity. Test cycles of roughly three weeks and sparse notified-body capacity in Europe raise direct costs by 15-25% for smaller firms. Many OEMs prioritise the U.S. route to market while navigating EU MDR bottlenecks that slow product launches and dampen innovation. Investment in in-house regulatory teams and early design-for-compliance practices becomes essential to manage timelines and preserve margin.
Semiconductor Supply-Chain Volatility for High-Voltage MOSFETs
Extended lead times and episodic pricing swings persist for critical MOSFETs as geopolitical pressures impact Asian foundries. Vishay’s acquisition of a wafer fab in 2024 exemplifies vertical-integration moves to secure supply, yet the company still reported softer revenues from diminished volumes and price erosion. The U.S. Chamber of Commerce warns that deeper decoupling with China could cut the broader medical device sector’s revenue by USD 23.6 billion annually. Medical power supply vendors hedge risk via dual-sourcing, higher buffer stock, and strategic partnerships with specialty semiconductor houses.
*Our forecasts treat driver/restraint impacts as directional, not additive. The impact forecasts reflect baseline growth, mix effects, and variable interactions.
Segment Analysis
By Technology: AC-DC Dominance Amid DC-DC Innovation
AC-DC devices accounted for 77.15% of medical power supply market share in 2025 thanks to their ubiquity in large imaging and surgical systems that tap direct facility mains. DC-DC supplies are forecast to post a 10.35% CAGR through 2031, riding the wave of modular electronics that demand multiple regulated rails with tight efficiency budgets. The medical power supply market continues to value AC-DC reliability, yet OEM roadmaps increasingly embed on-board DC-DC stages to distribute power and mitigate thermal hotspots. GaN-based DC-DC converters from Traco and Recom now achieve >95% efficiency and 500 kHz switching, unlocking 40% board-area savings. As portable infusion pumps, oxygen concentrators, and wearable diagnostics gain complexity, suppliers widen DC-DC portfolios to capture incremental revenue streams within the broader medical power supply market.
In hospital capital equipment, multi-kilowatt AC-DC blocks remain indispensable. Yet distributors report a steady shift in order mix toward smaller DC-DC modules for handheld ECG and endoscopy systems, reinforcing future demand for miniature high-frequency designs. By 2031, DC-DC units could exceed 30% revenue, reshaping competitive positioning within the medical power supply market. Continuous efficiency hikes, galvanic isolation techniques, and integration of digital tele-metrics drive differentiation between incumbents and specialist entrants.


By Type: Enclosed Solutions Lead Amid External Adapter Growth
Enclosed architectures captured 36.20% revenue in 2025, a reflection of stringent infection-control norms and EMI shielding needs inside operating rooms and intensive care. However, external adapters exhibit a robust 9.25% CAGR between 2026 and 2031 as care settings migrate to homes and community clinics. The medical power supply market rewards designs that isolate patients from high voltages, prompting OEMs to adopt Class II external bricks certified for Type BF applications. SL Power’s ME series illustrates adapter evolution, meeting 2×MOPP insulation and <50 µA leakage thresholds for home devices.
Open-frame boards continue in cost-sensitive analyzers where airflow and chassis integration offset enclosure needs. Configurable platforms allow rapid SKU customisation, cutting design cycles for specialty imaging and lab automation systems. Environmental legislation encouraging repairability and recyclability further strengthens modular approaches across the medical power supply market. Suppliers accordingly expand digital telemetry options that feed maintenance dashboards, supporting power-as-a-service models rolled out in pilot schemes across North America and Europe.
By Power Range: Mid-Range Dominance with High-Power Growth
Units rated 51-200 W provided 38.60% of the medical power supply market size in 2025, reflecting widespread use in patient monitors, ventilators, and mid-tier diagnostics. The 201-1000 W bracket is expected to deliver the fastest 8.85% CAGR, underpinned by AI-assisted imaging suites that integrate GPUs and real-time reconstruction engines requiring dense compute. Designers achieve compliance with IEC 60601 leakage limits via resonant architectures and digital current sharing that supports N+1 redundancy. Vapour-chamber heat sinks and low-noise fans improve thermal performance, critical as power density climbs toward 30 W/in³ in space-limited carts.
Growth in sub-50 W supplies remains steady, driven by wearable cardiac and glucose monitors demanding super-low idle draw. Energy-harvesting concepts, such as piezoelectric gait-powered units, promise longer device intervals between charges, but commercial impact remains nascent. High-power (>1000 W) segments serve robotic surgery and hybrid OR suites, where stringent hold-up times and harmonic distortion constraints encourage custom PFC stages using SiC MOSFETs. Suppliers who master these nuanced design regimes secure higher ASPs within the medical power supply market.
By Application: Imaging Equipment Leadership with Home-Care Acceleration
Diagnostic and imaging equipment dominated 30.00% of 2025 sales, encompassing CT, MRI, and PET platforms that rely on multi-kilowatt conversion blocks and low-ripple auxiliary rails. These systems demand high peak current capability and tight voltage regulation to prevent artefacts in image data streams. Vendors embed digital droop sharing and hot-swap functionality to reduce maintenance downtime, reinforcing stickiness within the medical power supply market.
Home-healthcare devices are slated for a 9.05% CAGR to 2031, buoyed by policy incentives, demographic pressure, and 5G-enabled monitoring ecosystems. New APCM reimbursement codes fuel provider procurement of connected spirometers and smart infusion pumps, each requiring compact, isolated adapters with real-time telemetry ports. Academic work demonstrates 97.25% data accuracy in secure 5G RPM frameworks, confirming viability for large-scale deployment. These trends sustain parallel growth in battery management ICs and wireless charging accessories linked to the medical power supply market.
Geography Analysis
North America retained 36.80% revenue in 2025, supported by USD 156 billion in domestic device spending and streamlined FDA pathways that shorten time to market. The FY 2025 Defense Health Program’s USD 40.27 billion allocation for equipment modernisation further boosts demand. High focus on decarbonisation drives rapid uptake of >90% efficient GaN supplies across hospitals implementing ESG scorecards.
Asia-Pacific charts the quickest 9.45% CAGR to 2031 as India’s devices market aims for USD 50 billion valuation under Production-Linked Incentive benefits. Regional OEMs expand GaN and SiC capacity, yet challenges persist: R&D outlay sits at only 0.5% of expenses and import reliance remains high for precision magnetics and capacitors. Trade-tension scenarios could subtract USD 23.6 billion from sector revenue yearly, emphasising the need for supply-chain resilience.
Europe’s stringent MDR framework complicates conformity, with just 43 notified bodies covering roughly 500,000 devices, creating significant approval delays. Nevertheless, strong sustainability mandates and public-sector energy targets sustain interest in ultra-efficient medical power supply market solutions. MedTech Europe advocates regulatory reform to preserve innovation pipelines while supporting health-system investments in green infrastructure.

Competitive Landscape
The medical power supply market is moderately concentrated, with Delta Electronics, Mean Well, TDK-Lambda, and Advanced Energy Industries shaping global standards through broad portfolios and cross-regional compliance expertise. Delta provides enclosed and external units spanning 5 W to 3 kW, pairing high-density topologies with IEC 60601 certifications. Advanced Energy added 35 platform products in 2024 and acquired Airity Technologies to deepen high-voltage competency, aligning with semiconductor equipment and life-science customers. [4]Advanced Energy Industries, “2024 Annual Report,” sec.gov
Players seek differentiation via integration of digital control, remote firmware updates, and predictive maintenance analytics. Patent landscapes in GaN and SiC gain strategic priority; Cambridge GaN Devices’ recent funding positions it to license breakthrough IP to OEMs targeting 30% system energy savings. Supply-chain turbulence drives vertical integration and multi-year wafer agreements, enabling top firms to secure allocation and preserve lead times below industry average. Meanwhile, niche vendors penetrate growth pockets in home-care, leveraging modular, patient-safe external adapters to compete in sections of the medical power supply market underserved by conglomerates.
Emergent power-as-a-service models gain trial deployments, particularly for hospital groups managing fleets of infusion pumps and dialysis devices. Subscription pricing linked to uptime and energy consumption offers suppliers recurring revenue while helping providers shift capital to operating expense. Early pilots report double-digit reductions in unplanned downtime, bolstering the business case for broader rollout in the medical power supply market.
Medical Power Supply Industry Leaders
-
Advanced Energy Industries Inc.
-
Astrodyne TDI Corp.
-
Bel Power Solutions (CUI Inc.)
-
Chroma Systems Solutions Inc.
-
Cincon Electronics Co. Ltd
- *Disclaimer: Major Players sorted in no particular order

Recent Industry Developments
- June 2025: HEALWELL AI entered the U.S. market with Orion Health data infrastructure integration, extending AI decision-support tools for preventative care.
- May 2025: Knowles outlined 8-10% revenue CAGR targets built on ceramic capacitors and RF filters critical to implantable devices.
- April 2025: Navitas Semiconductor showcased the first production 650 V bi-directional GaNFast ICs at PCIM 2025, targeting wireless-charging medical implants.
- April 2025: MedTech Europe urged structural MDR reforms in its submission to the EC Life Sciences Strategy consultation.
- March 2025: Boston Scientific reported USD 16.7 billion 2024 net sales, propelled by 100 product launches and targeted acquisitions.
- March 2025: Advanced Energy Industries launched 35 new platform products in 2024 and finalized the Airity Technologies acquisition, expanding high-voltage offerings for medical and semiconductor sectors.
- February 2025: Cambridge GaN Devices raised USD 32 million Series C to scale GaN production for medical, EV, and data-center uses.
- February 2025: Eli Lilly announced a USD 3 billion Wisconsin capacity expansion alongside 45% higher Q4 2024 revenue.
- January 2025: Infineon Technologies forecast surging GaN adoption in power semiconductors, citing efficiency and size advantages for high-demand medical platforms.


Research Methodology Framework and Report Scope
Market Definitions and Key Coverage
Our study defines the medical power supply market as the worldwide sales of factory-built AC-DC and DC-DC units that deliver regulated low-voltage power inside or alongside diagnostic imaging, patient monitoring, therapeutic, and home-care devices. The scope follows IEC 60601-1 safety and EMI rules, which Mordor Intelligence analysts validate with product certificates. We group units by form factor, power band, and clinical end-use so clients can link demand directly to equipment shipments and retrofit cycles.
Scope Exclusions: We purposely leave out uninterruptible power systems, hospital-room wiring, and generic adapters sold for consumer wearables, because these carry different reliability codes and would distort pricing comparisons.
Segmentation Overview
-
By Technology
- AC-DC Power Supply
- DC-DC Power Supply
-
By Type
- Open-Frame
- Enclosed
- External/Adapter
- Configurable/Modular
-
By Power Range
- 0–50 W
- 51–200 W
- 201–1000 W
- >1000 W
-
By Application
- Diagnostic and Imaging Equipment
- Patient Monitoring
- Surgical and Life-support
- Home-Healthcare Devices
- Others
-
By Geography
-
North America
- United States
- Canada
- Mexico
-
South America
- Brazil
- Argentina
- Chile
- Rest of South America
-
Europe
- Germany
- United Kingdom
- France
- Italy
- Spain
- Russia
- Rest of Europe
-
Asia-Pacific
- China
- India
- Japan
- South Korea
- Singapore
- Malaysia
- Australia
- Rest of Asia-Pacific
-
Middle East and Africa
-
Middle East
- United Arab Emirates
- Saudi Arabia
- Turkey
- Rest of Middle East
-
Africa
- South Africa
- Nigeria
- Rest of Africa
-
Middle East
-
North America
Detailed Research Methodology and Data Validation
Primary Research
Mordor analysts conducted structured interviews with power-design engineers, regulatory consultants, purchasing heads at hospitals, and distributors across North America, Europe, and Asia-Pacific. These conversations helped us test duty-cycle assumptions, warranty failure rates, and price corridors, giving our model region-specific realism.
Desk Research
We began with public statistical pillars, using sources such as the U.S. FDA 510(k) database for new device clearances, Eurostat trade codes for HS 8504 converters, and the World Bank's healthcare capital-expenditure tables to size installation pools. Industry associations, including the Association for the Advancement of Medical Instrumentation and Japan's JAMME, provided annual production tallies that our team matched with regional safety listings.
Financial filings, investor decks, and procurement contracts were mined through D&B Hoovers and Dow Jones Factiva to confirm average selling prices, while patent analytics from Questel highlighted the growing share of GaN-based topologies. This list is illustrative, not exhaustive; many additional open datasets supported validation and clarification.
Market-Sizing & Forecasting
We employed a top-down reconstruction that starts with installed bases of imaging and monitoring devices, applies typical power-supply replacement ratios, and layers in new equipment shipments captured from trade data before translating units to revenue through blended ASP curves. Selected bottom-up checks, supplier roll-ups and channel spot quotes, were run to fine-tune totals. Key variables driving volume include MRI and CT scanner shipments, home ventilator demand, IEC 60601 revision adoption dates, hospital-bed additions, and GaN converter penetration. A multivariate regression with scenario analysis projects these drivers through 2030, letting us adjust for policy or economic shocks.
Data Validation & Update Cycle
Every draft model passes three-level peer review; anomalies against import volumes or corporate earnings trigger re-work. We refresh figures annually, and when recalls, regulation shifts, or material M&A occur, our team re-contacts sources so clients receive the very latest view.
Why Mordor's Medical Power Supply Baseline Earns Trust
Published values often diverge because firms choose unlike device sets, price levels, or refresh cadences. Clients seek clarity, and we provide it.
Key gap drivers include differing treatment of aftermarket adapters, one-time currency conversions, and whether refurbished systems are counted. Mordor reports the broadest compliant unit set and updates every twelve months, whereas others may freeze models for longer or lift figures directly from vendor shipments without ASP normalization.
Benchmark comparison
| Market Size | Anonymized source | Primary gap driver |
|---|---|---|
| USD 1.70 B | Mordor Intelligence | - |
| USD 1.67 B | Regional Consultancy A | Relies on vendor shipment counts; minimal price harmonization; limited update cadence |
| USD 2.04 B | Trade Journal B | Uses revenue extrapolation from top manufacturers and omits aftermarket adapter segment |
These comparisons show that Mordor's disciplined scope selection, dual-path validation, and timely refresh create a balanced, transparent baseline decision-makers can reproduce with confidence.


Key Questions Answered in the Report
What is the current value of the medical power supply market?
The medical power supply market size reached USD 1.82 billion in 2026 and is projected to hit USD 2.56 billion by 2031.
Which technology segment leads the market?
AC-DC supplies led with 77.15% medical power supply market share in 2025, driven by widespread use in imaging and surgical systems.
Why are external adapters growing quickly?
Home-care expansion and patient-safe isolation requirements push external adapters to a forecast 9.25% CAGR through 2031.
Which region shows the fastest growth?
Asia-Pacific is expected to post a 9.45% CAGR due to manufacturing incentives and expanding healthcare infrastructure.
How do GaN and SiC devices influence market growth?
These wide-bandgap semiconductors deliver >95% efficiency and 40% size reduction, enabling miniaturisation and compliance with decarbonisation goals.
What are the main regulatory challenges?
Compliance with IEC 60601-1 4th-edition EMC standards increases testing costs and time-to-market, especially in Europe under MDR.
Page last updated on:


