Atomic Spectroscopy Market Size and Share
Market Overview
| Study Period | 2019 - 2030 |
|---|---|
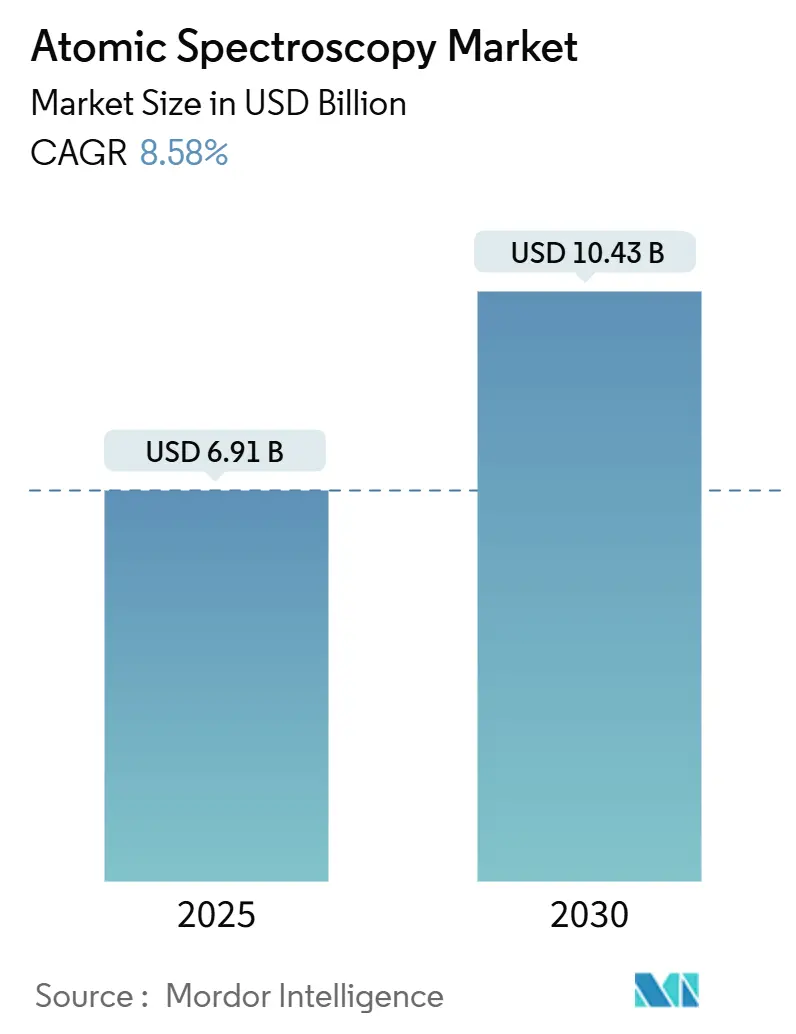
| Market Size (2025) | USD 6.91 Billion |
| Market Size (2030) | USD 10.43 Billion |
| Growth Rate (2025 - 2030) | 8.58% CAGR |
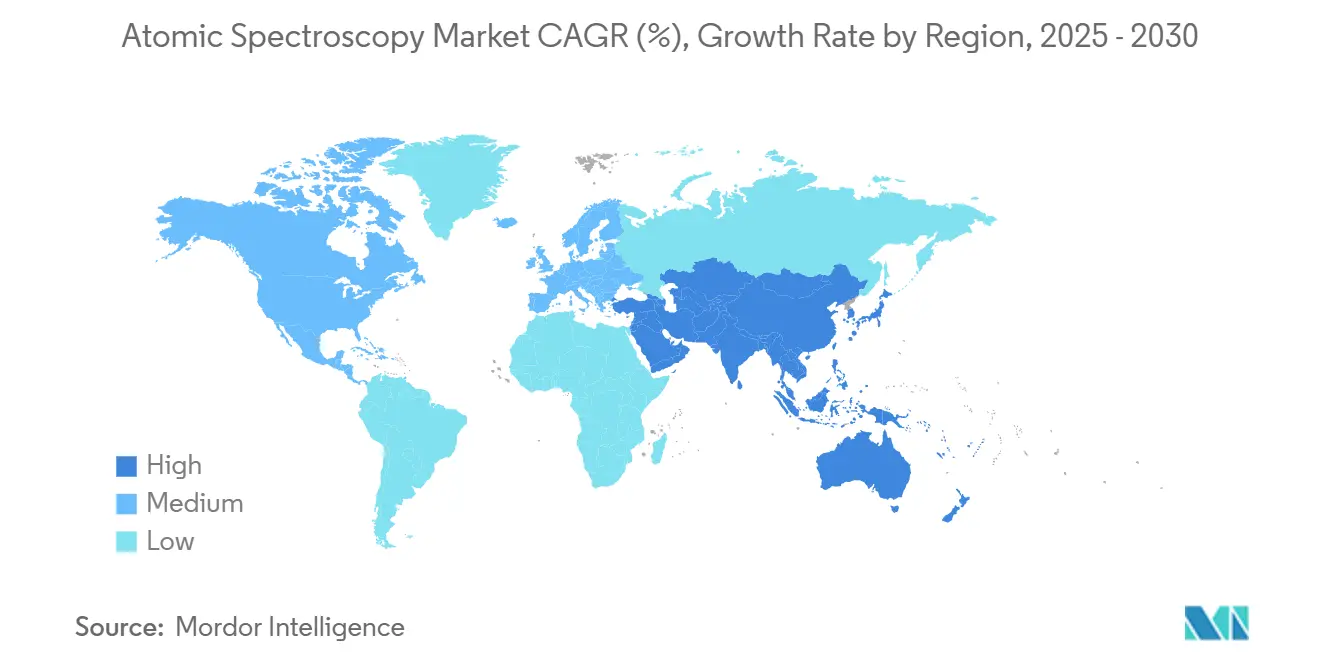
| Fastest Growing Market | Asia Pacific |
| Largest Market | North America |
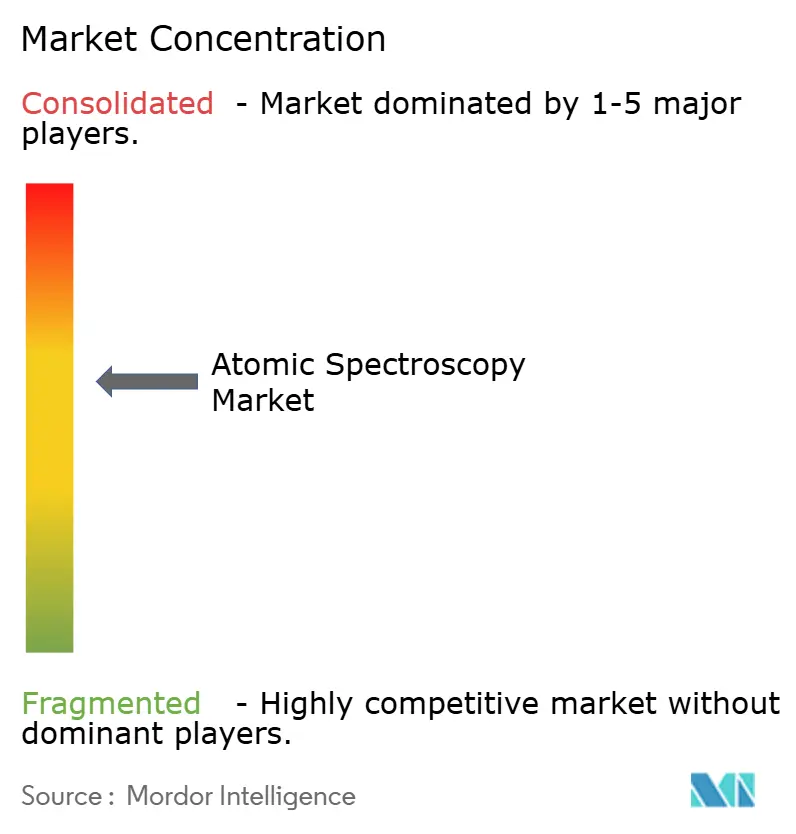
| Market Concentration | Medium |
Major Players *Disclaimer: Major Players sorted in no particular order Image © Mordor Intelligence. Reuse requires attribution under CC BY 4.0. | |
Atomic Spectroscopy Market Analysis by Mordor Intelligence
The atomic spectroscopy market size stands at USD 6.91 billion in 2025 and is projected to reach USD 10.43 billion by 2030, reflecting an 8.58% CAGR during the forecast period. The expansion is propelled by stringent global regulations that oblige ultra-trace elemental detection, surging demand from lithium exploration, and AI-enabled automation that lifts laboratory throughput. Pharmaceutical quality control needs under ICH Q3D, tighter environmental monitoring thresholds, and the semiconductor sector’s drive for nano-scale purity collectively reinforce recurring equipment upgrades across public and private laboratories. Robust capital investments in analytical infrastructure, particularly across Asia-Pacific, offset headwinds linked to helium and argon supply constraints and shortages of skilled spectroscopists. Vendors mitigate gas volatility through conservation technologies and rental models that lower upfront cost barriers while maintaining growth momentum for the atomic spectroscopy market.
Key Report Takeaways
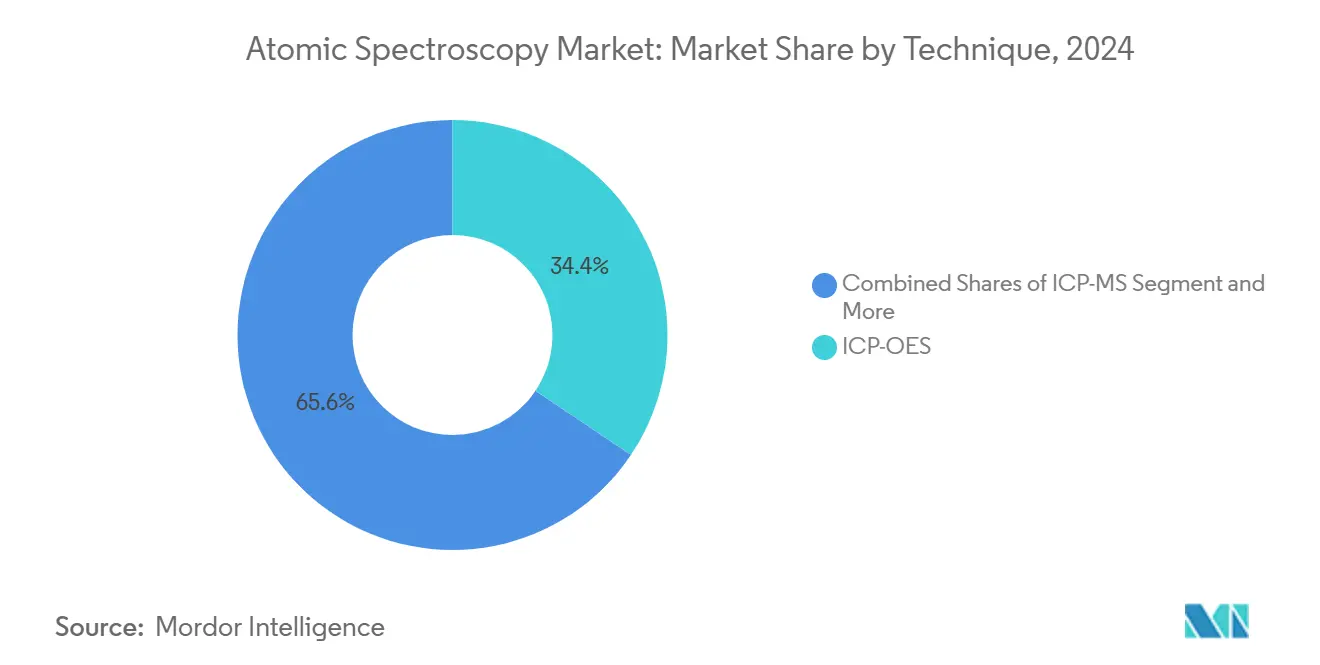
- By technique, ICP-OES led with a 34.4% revenue share of the atomic spectroscopy market in 2024; ICP-MS is forecast to expand at a 9.8% CAGR through 2030.
- By instrument design, benchtop systems accounted for 72.8% of the atomic spectroscopy market share in 2024, while portable formats are advancing at a 10.4% CAGR to 2030.
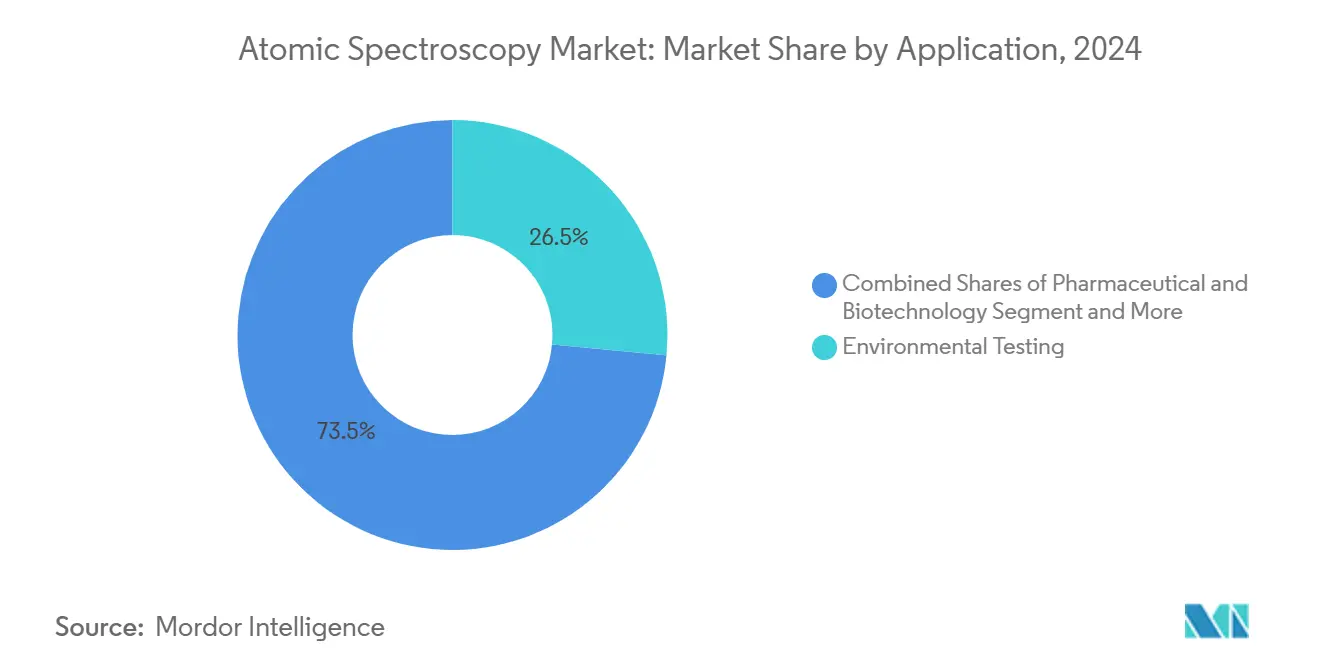
- By application, environmental testing captured 26.5% of the atomic spectroscopy market size in 2024, and lithium and rare-earth exploration is rising at a 12.6% CAGR through 2030.
- By end-user, government and regulatory laboratories held 29.4% of the atomic spectroscopy market share in 2024; contract testing laboratories exhibit the fastest growth, climbing at an 11.2% CAGR to 2030.
- By geography, North America retained 38.2% of the atomic spectroscopy market share in 2024, whereas Asia–Pacific is projected to record an 11.7% CAGR over the forecast period.
Global Atomic Spectroscopy Market Trends and Insights
Drivers Impact Analysis*
| Driver | (~) % Impact on CAGR Forecast | Geographic Relevance | Impact Timeline |
|---|---|---|---|
| Stringent environmental regulations mandating trace-level elemental analysis | +2.10% | Global, with strongest impact in North America & EU | Medium term (2-4 years) |
| Growing pharmaceutical QC requirements (ICH Q3D) | +1.80% | Global, concentrated in major pharmaceutical hubs | Short term (≤ 2 years) |
| Increasing demand for food safety and heavy-metal testing | +1.40% | Global, with emphasis on APAC and North America | Medium term (2-4 years) |
| Proliferation of lithium and rare-earth exploration projects | +1.70% | APAC core, spill-over to South America and Africa | Long term (≥ 4 years) |
| AI-driven automation boosting throughput and adoption | +1.20% | North America and EU, expanding to APAC | Medium term (2-4 years) |
| Nano-scale elemental mapping for semiconductor packaging | +0.60% | APAC core, with secondary impact in North America | Long term (≥ 4 years) |
| Source: Mordor Intelligence | |||
Stringent Environmental Regulations Mandating Trace-Level Elemental Analysis
Environmental statutes across the United States and the European Union continue to tighten discharge and emission thresholds, compelling laboratories to replace legacy atomic absorption units with high-resolution ICP platforms that achieve parts-per-trillion sensitivity[1]United States Federal Register, “Clean Water Act Methods Update Rule for the Analysis of Effluent,” FEDERALREGISTER.GOV. Regulatory amendments under the 2024 Clean Water Act Methods Update Rule require simultaneous multi-element reporting, which accelerates the migration toward ICP-OES and ICP-MS systems able to process larger sample batches per shift. In air quality, the National Emission Standards for Hazardous Air Pollutants obliges metals speciation at lower detection limits, elevating demand for advanced optical designs that resolve spectral interferences. Contract environmental labs report a 40% surge in sample workloads after the rule changes, prompting capacity expansion and driving incremental instrument sales across the atomic spectroscopy market.
Growing Pharmaceutical QC Requirements (ICH Q3D)
The ICH Q3D guideline obliges measurement of 24 elemental impurities at strict oral, parenteral, and inhalation thresholds, solidifying ICP-MS as the default compliance platform for cadmium and mercury quantification at below-ppm levels [2]Yves Peeraer, “ICP-MS vs ICP-OES: choosing the right elemental impurity test,” QBD GROUP, qbdgroup.com. FDA enforcement since 2024 has catalyzed instrument retrofits across global drug-manufacturing sites, with many firms outsourcing to contract testing laboratories to avoid capital expenditure spikes. Benchtop ICP-OES units remain relevant for high-conce¬nt¬ra-tion elements, while portable XRF offers rapid raw material screening, shortening batch-release timelines. The alignment of Q2(R2) validation protocols with spectroscopic workflows standardizes method development and strengthens audit readiness in pharmaceutical facilities worldwide.
Proliferation of Lithium and Rare-Earth Exploration Projects
Soaring battery demand stimulates exploration budgets across Argentina, Australia, China, and Africa, elevating field-based LIBS and handheld XRF as frontline tools that deliver near-real-time ore-grade information with 98.4% classification accuracy. Mining firms overlay geospatial data with portable assay results to optimize drill targeting, reducing exploration spending by up to 30%. Ultra-low-level detection of rare-earth elements uses high-resolution ICP-OES instruments like the PlasmaQuant 9100 Elite, which achieves parts-per-trillion sensitivity necessary for resource valuation. New sustainability mandates encourage energy-efficient plasma systems, aligning capital purchasing with corporate ESG objectives and sustaining long-term demand for the atomic spectroscopy market.
AI-Driven Automation Boosting Throughput and Adoption
Instrument makers embed machine-learning algorithms that auto-optimize plasma conditions, correct spectral overlaps, and predict maintenance windows, cutting unplanned downtime and raising sample throughput by up to 35% in high-volume labs [3]Shimadzu, “Analytical Intelligence,” shimadzu.com. Such productivity gains amplify return on investment and justify premium pricing models. Cloud-enabled diagnostics support remote troubleshooting, shortening service intervention cycles and lowering the overall cost of ownership. As AI modules mature, mid-tier labs in emerging economies can access sophisticated analytics without the need for deep spectroscopic expertise, broadening the addressable base for the atomic spectroscopy market.
Restraints Impact Analysis*
| Restraint | (~) % Impact on CAGR Forecast | Geographic Relevance | Impact Timeline |
|---|---|---|---|
| High capital and maintenance costs | -1.50% | Global, with strongest impact in emerging markets | Short term (≤ 2 years) |
| Shortage of skilled spectroscopists in emerging markets | -0.80% | APAC emerging markets, Africa, Latin America | Medium term (2-4 years) |
| Supply-chain vulnerability for high-purity argon and helium | -0.90% | Global, with acute impact in North America and EU | Short term (≤ 2 years) |
| Lab-waste compliance burden from acidic digestion reagents | -0.40% | Global, concentrated in regulated industries | Medium term (2-4 years) |
| Source: Mordor Intelligence | |||
High Capital and Maintenance Costs
Price points for premium ICP-MS units exceed USD 400,000 for triple-quadrupole configurations, positioning financing as the single largest barrier to entry for smaller labs [4]Trevor Henderson, “The Best ICP-MS Systems: A Buyer’s Guide to Price and Features,” LabX, labx.com. Annual service agreements add 8–12% of the purchase price, and consumable spend routinely breaches USD 10,000 per year for high-throughput operations. The atomic spectroscopy industry increasingly promotes leasing and reagent-rental models that flatten spending curves but raise lifecycle costs by 20–30%. Shared-use centers and outsourcing trends temper direct equipment demand, moderating near-term growth despite the technology’s intrinsic value.
Shortage of Skilled Spectroscopists in Emerging Markets
The pipeline of trained analysts lags instrument deployment, especially in Southeast Asia and parts of Africa, prolonging method-development timelines and elevating error risk. Unplanned downtime linked to operator errors raises per-sample costs, dissuading prospective entrants to the atomic spectroscopy market. Vendor-led training programs and remote AI assistants partly offset the talent gap, yet competitive hiring destabilizes staff retention at many contract labs.
*Our forecasts treat driver/restraint impacts as directional, not additive. The impact forecasts reflect baseline growth, mix effects, and variable interactions.
Segment Analysis
By Technique: ICP-MS Accelerates While ICP-OES Holds Scale
ICP-OES remains the workhorse technique, commanding 34.4% of 2024 revenue, yet ICP-MS is accelerating at a 9.8% CAGR as pharmaceutical, semiconductor, and nuclear forensics users demand parts-per-trillion detection and isotopic ratio capabilities. The atomic spectroscopy market size for ICP-MS exceeded USD 2 billion in 2025 and is slated to outpace the overall market through 2030. High-resolution variants penetrate niche segments such as lead-free solder monitoring and geological dating, reinforcing technology diversity. Concomitantly, ICP-OES leverages lower operating costs and unrivaled throughput, sustaining large installed bases across contract labs.
Atomic absorption spectroscopy is now mostly confined to routine metal assays in dairy and water utilities. Handheld XRF expands in scrapyards and mineral sorting, contributing incremental revenue but not displacing core lab platforms. LIBS garners attention for real-time geological exploration, delivering near-lab accuracy in field settings and diversifying revenues for the atomic spectroscopy market. AI-enabled data processing across all techniques reduces calibration overhead and democratizes sophisticated analytics for mid-tier laboratories.


By Instrument Design: Portables Challenge Benchtop Supremacy
Benchtop systems still represent 72.8% of 2024 shipments, justified by unmatched detection limits and automation readiness suitable for high-throughput environments. However, the atomic spectroscopy market witnesses a 10.4% CAGR in portable instruments as rugged XRF and LIBS devices deliver usable sensitivity in situ. Upstream mining firms adopt GPS-enabled handheld spectrometers for immediate grade control, trimming assay turnaround from days to minutes. Pharmaceutical QC teams deploy cart-mounted ICP-OES units in cleanrooms for batch-side metal verification, circumventing sample-transport delays.
Battery runtime improvements and IP54 ruggedization further elevate field utility, compelling vendors to harmonize firmware and data formats with laboratory systems. Meanwhile, benchtop platforms integrate AI-driven smart diagnostics that forecast component fatigue, reducing unscheduled downtime by up to 25% and anchoring their dominance in the atomic spectroscopy market.
By Application: Environmental Testing Dominates While Battery Metals Surge
Environmental testing maintained a 26.5% share in 2024, underpinned by regulatory frameworks that stipulate routine multi-element monitoring of water, air, and soil. Elevated sample volumes and simultaneous analysis needs favor ICP-OES purchases, sustaining a robust baseline for the atomic spectroscopy market. Conversely, lithium and rare-earth exploration exhibits a 12.6% CAGR, reflecting critical-mineral strategies worldwide. Field-deployable LIBS units verify ore signatures in real time, shortening exploration cycles and de-risking investments.
Pharmaceutical QC, bolstered by ICH Q3D mandates, accounts for a rising proportion of the atomic spectroscopy market size. Food safety testing gains traction amid retailer demands for metal-free certification, requiring sub-ppb precision that only advanced plasma-based instruments can deliver. Semiconductor production employs ultra-high‐purity gas analytics and wafer contamination mapping, anchoring niche yet high-margin applications for equipment vendors.
By End-User: Contract Labs Narrow the Gap with Government Facilities
Government and regulatory labs retained 29.4% of 2024 revenue owing to statutory monitoring obligations and stable public funding. However, contract analytical labs are growing at 11.2% CAGR, propelled by pharmaceutical outsourcing and capacity pressures in environmental testing. The atomic spectroscopy market size accruing to contract labs is expected to eclipse USD 3 billion by 2030 as sample-throughput economies and advanced automation attract clients seeking lower total analytical costs.
Industrial manufacturers leverage in-house spectroscopy for process control, particularly in petrochemical and metal alloy production. Academic institutes shape next-generation methodologies yet remain budget-constrained, often sharing high-end ICP-MS instruments through core facilities. Equipment makers tailor service contracts for each user type, maximizing uptime and aligning with diverse operational profiles across the atomic spectroscopy market.
Geography Analysis
North America, with a 38.2% 2024 share, benefits from entrenched semiconductor fabs and strict regulatory regimes enforcing periodic elemental analysis. Laboratories prioritize replacement of aging units with AI-integrated models, offsetting helium and argon price pressures through consumption-reduction features. The atomic spectroscopy market share here is unlikely to shrink, yet growth rates lag the global average as installed bases mature.
Asia–Pacific posts an 11.7% CAGR through 2030, fueled by China’s vast analytical infrastructure build-out and India’s pharmaceutical expansion. Investments in greenfield labs, combined with national policies promoting critical-mineral self-sufficiency, create fertile ground for equipment vendors. Europe experiences moderate growth, with harmonized standards fostering steady replacement demand and a pivot toward greener analytical chemistries. Emerging markets in the Middle East and Africa adopt portable platforms for mining and environmental surveillance, though limited skilled manpower restrains full-scale lab deployment.

Competitive Landscape
The atomic spectroscopy market is moderately consolidated. Agilent Technologies, Thermo Fisher Scientific, and PerkinElmer anchor the top tier through broad product portfolios across ICP-OES, ICP-MS, and atomic absorption. Recent acquisitions such as Agilent’s USD 925 million BioVectra deal reinforce vertical integration, offering combined manufacturing and analytical solutions. Thermo Fisher expands its semiconductor footprint via the Vulcan Automated Lab, pairing robotic handling with spectroscopic characterization to support advanced packaging yields[5]Innovations in Pharmaceutical Technology, “Thermo Fisher Scientific Introduces the Vulcan Automated Lab,” iptonline.com. Shimadzu differentiates through its Analytical Intelligence platform, embedding machine learning to streamline method creation and error detection[6]Shimadzu, “Analytical Intelligence,” shimadzu.com.
Mid-tier firms like Analytik Jena scale vertically following the 2025 ICP-MS business acquisition, while Bruker pushes into small-molecule and environmental contaminants with the timsMetabo platform[7]Bruker Corporation, “Bruker Applied MS Unveils Strategic Innovations at ASMS 2025,” bruker.com. Portable specialists such as SciAps carve out high-growth niches by delivering laboratory-grade LIBS in handheld form factors. Supply-chain resilience emerges as a competitive lever; companies invest in proprietary cone and torch manufacturing to buffer gas and component shortages. Service differentiation—remote diagnostics, subscription consumables, and method libraries—bolsters customer retention and widens moat around leading vendors in the atomic spectroscopy market.
Atomic Spectroscopy Industry Leaders
Agilent Technologies, Inc.
Thermo Fisher Scientific Inc.
PerkinElmer, Inc.
Shimadzu Corporation
Bruker Corporation
- *Disclaimer: Major Players sorted in no particular order

Recent Industry Developments
- June 2025: Bruker Corporation launched the timsMetabo platform to enhance PFAS and small-molecule detection, strengthening its portfolio in emerging contaminant analysis and capturing new revenue in environmental testing.
- April 2025: Thermo Fisher Scientific reported USD 10.36 billion Q1 2025 revenue and unveiled the Vulcan Automated Lab, a strategic move to deepen its presence in semiconductor analytics through AI-driven ultra-high-purity assessment.
- March 2025: Thermo Fisher introduced the iCAP MXS ICP-MS, targeting high-throughput labs with intelligent matrix and interference removal technologies that lower per-sample costs and improve detection limits.
- February 2025: Analytik Jena completed an ICP-MS unit acquisition, expanding its product suite and reinforcing its stance in environmental and academic markets.


Global Atomic Spectroscopy Market Report Scope
| ICP-OES |
| ICP-MS |
| Atomic Absorption Spectroscopy (AAS) |
| X-Ray Fluorescence (XRF) |
| Other Techniques (Arc/Spark OES, LIBS, etc.) |
| Benchtop Instruments |
| Portable/Hand-held Instruments |
| Pharmaceutical and Biotechnology |
| Food and Beverage Testing |
| Environmental Testing |
| Material Analysis and Mining |
| Petrochemical and Oil and Gas |
| Other Applications |
| Academic and Research Institutes |
| Industrial Manufacturing |
| Government and Regulatory Laboratories |
| Contract Testing Laboratories |
| Other End-users |
| North America | United States | |
| Canada | ||
| Mexico | ||
| South America | Brazil | |
| Argentina | ||
| Rest of South America | ||
| Europe | Germany | |
| United Kingdom | ||
| France | ||
| Italy | ||
| Spain | ||
| Russia | ||
| Rest of Europe | ||
| Asia-Pacific | China | |
| Japan | ||
| India | ||
| South Korea | ||
| Australia | ||
| Rest of Asia-Pacific | ||
| Middle East and Africa | Middle East | Saudi Arabia |
| United Arab Emirates | ||
| Turkey | ||
| Rest of Middle East | ||
| Africa | South Africa | |
| Nigeria | ||
| Rest of Africa | ||
| By Technique | ICP-OES | ||
| ICP-MS | |||
| Atomic Absorption Spectroscopy (AAS) | |||
| X-Ray Fluorescence (XRF) | |||
| Other Techniques (Arc/Spark OES, LIBS, etc.) | |||
| By Instrument Design | Benchtop Instruments | ||
| Portable/Hand-held Instruments | |||
| By Application | Pharmaceutical and Biotechnology | ||
| Food and Beverage Testing | |||
| Environmental Testing | |||
| Material Analysis and Mining | |||
| Petrochemical and Oil and Gas | |||
| Other Applications | |||
| By End-user Industry | Academic and Research Institutes | ||
| Industrial Manufacturing | |||
| Government and Regulatory Laboratories | |||
| Contract Testing Laboratories | |||
| Other End-users | |||
| By Geography | North America | United States | |
| Canada | |||
| Mexico | |||
| South America | Brazil | ||
| Argentina | |||
| Rest of South America | |||
| Europe | Germany | ||
| United Kingdom | |||
| France | |||
| Italy | |||
| Spain | |||
| Russia | |||
| Rest of Europe | |||
| Asia-Pacific | China | ||
| Japan | |||
| India | |||
| South Korea | |||
| Australia | |||
| Rest of Asia-Pacific | |||
| Middle East and Africa | Middle East | Saudi Arabia | |
| United Arab Emirates | |||
| Turkey | |||
| Rest of Middle East | |||
| Africa | South Africa | ||
| Nigeria | |||
| Rest of Africa | |||


Key Questions Answered in the Report
What is the current atomic spectroscopy market size?
The atomic spectroscopy market size is USD 6.91 billion in 2025 and is forecast to reach USD 10.43 billion by 2030.
Which technique is growing fastest in the atomic spectroscopy market?
ICP-MS is the fastest-growing technique, advancing at a 9.8% CAGR through 2030.
How is helium scarcity affecting laboratories?
Helium price spikes have doubled operating costs since 2020, prompting labs to invest in argon-saving ICP-OES designs and gas-recycling systems.
Why are contract testing laboratories gaining share?
Pharmaceutical and environmental firms outsource elemental analysis to avoid high capital outlays, driving an 11.2% CAGR for contract labs.
Which region will see the highest growth to 2030?
AsiaPacific will post the quickest expansion, registering an 11.7% CAGR on the back of pharmaceutical manufacturing, mining, and environmental monitoring demand.
How are AI tools changing atomic spectroscopy workflows?
AI-driven platforms automate method optimization, predict maintenance needs, and cut analytical turnaround times by up to 35%, enhancing lab productivity.
Page last updated on:


