Confocal Raman Spectroscopy Market Size and Share
Market Overview
| Study Period | 2020 - 2031 |
|---|---|
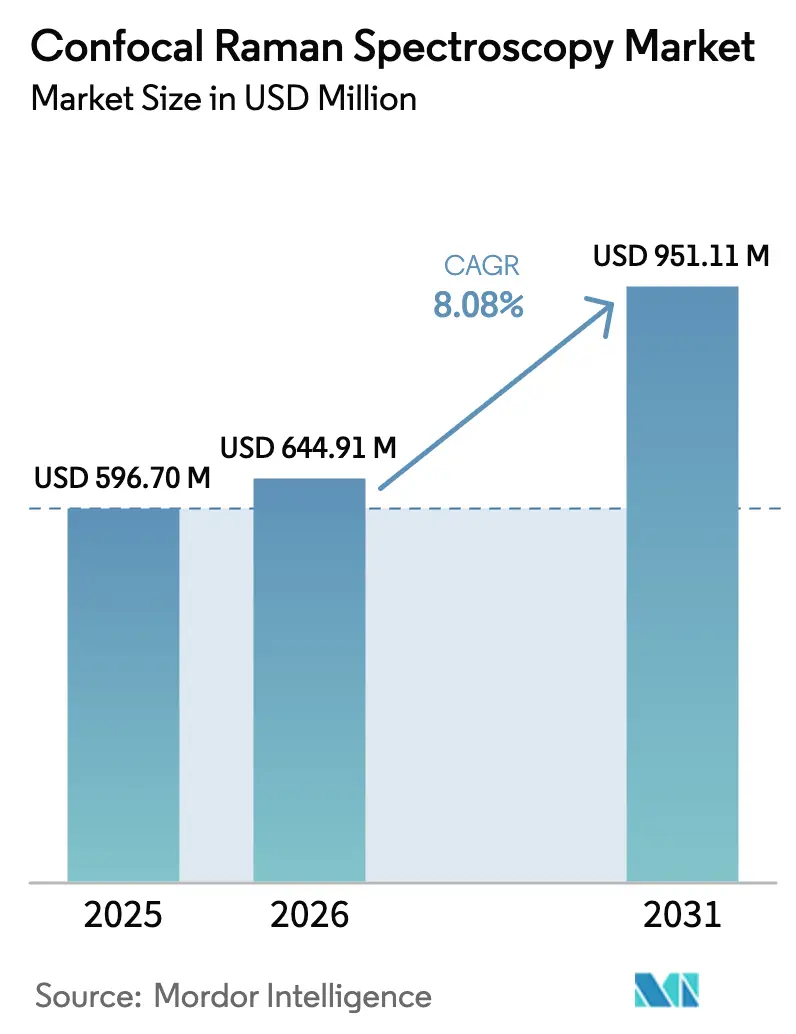
| Market Size (2026) | USD 644.91 Million |
| Market Size (2031) | USD 951.11 Million |
| Growth Rate (2026 - 2031) | 8.08% CAGR |
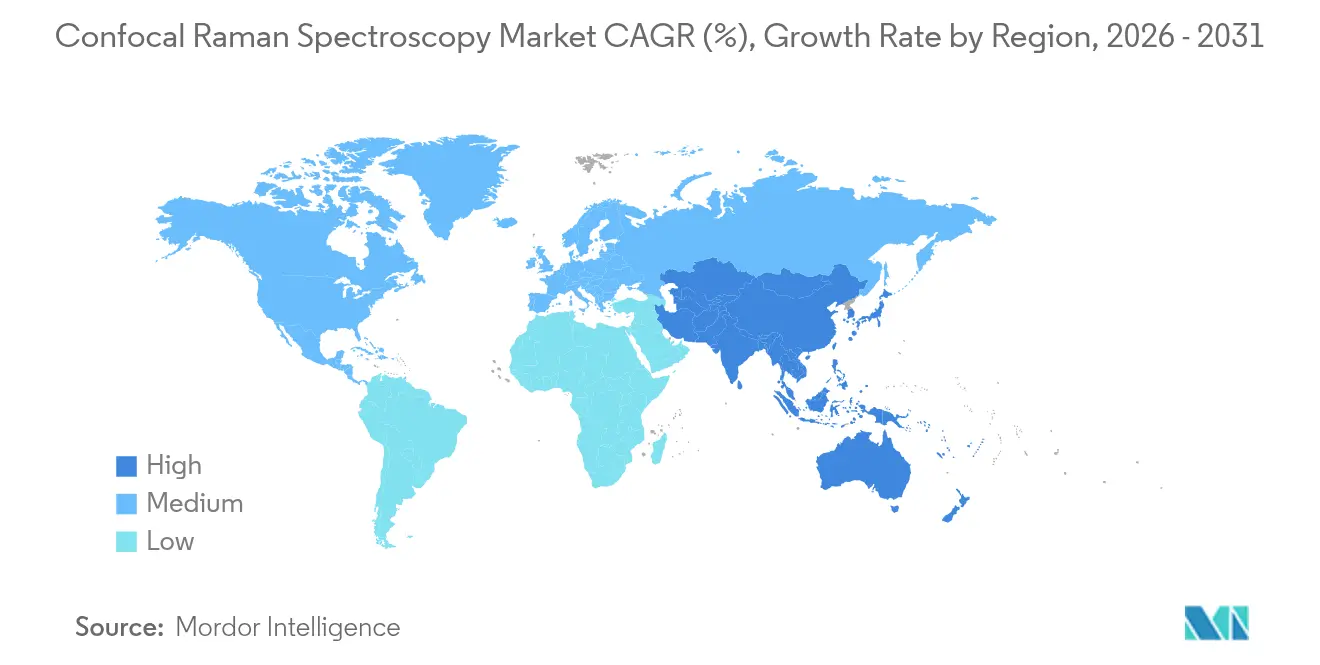
| Fastest Growing Market | Asia Pacific |
| Largest Market | North America |
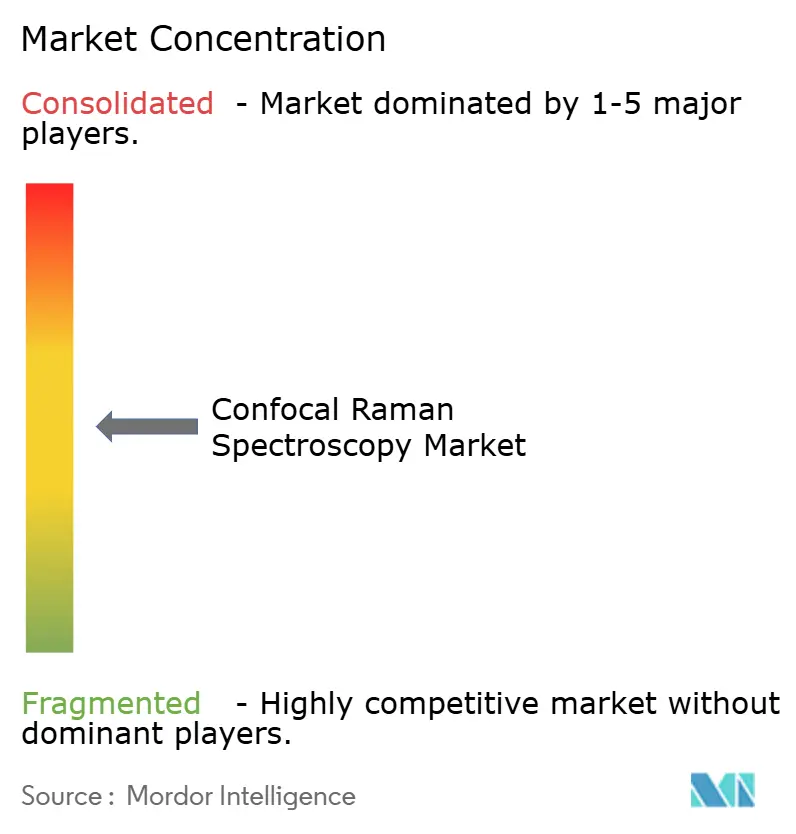
| Market Concentration | Medium |
Major Players *Disclaimer: Major Players sorted in no particular order Image © Mordor Intelligence. Reuse requires attribution under CC BY 4.0. | |
Confocal Raman Spectroscopy Market Analysis by Mordor Intelligence
The confocal Raman spectroscopy market size in 2026 is estimated at USD 644.91 million, growing from 2025 value of USD 596.7 million with 2031 projections showing USD 951.11 million, growing at 8.08% CAGR over 2026-2031. Wide-ranging use in pharmaceutical drug development, semiconductor quality control, and battery research is underpinning this expansion. Growth has been reinforced by the integration of artificial intelligence into high-throughput spectral analytics, which enabled drug makers to shorten discovery timelines while keeping regulatory compliance. Portable instruments broadened adoption in field settings, while surface-enhanced Raman systems opened new trace-level applications. Competition intensified as vendors pursued acquisitions and regional manufacturing partnerships to tap high-growth Asian demand. Meanwhile, price-sensitive buyers explored leasing models and pay-per-use service contracts that eased budget constraints yet preserved access to advanced analytical capabilities.
Key Report Takeaways
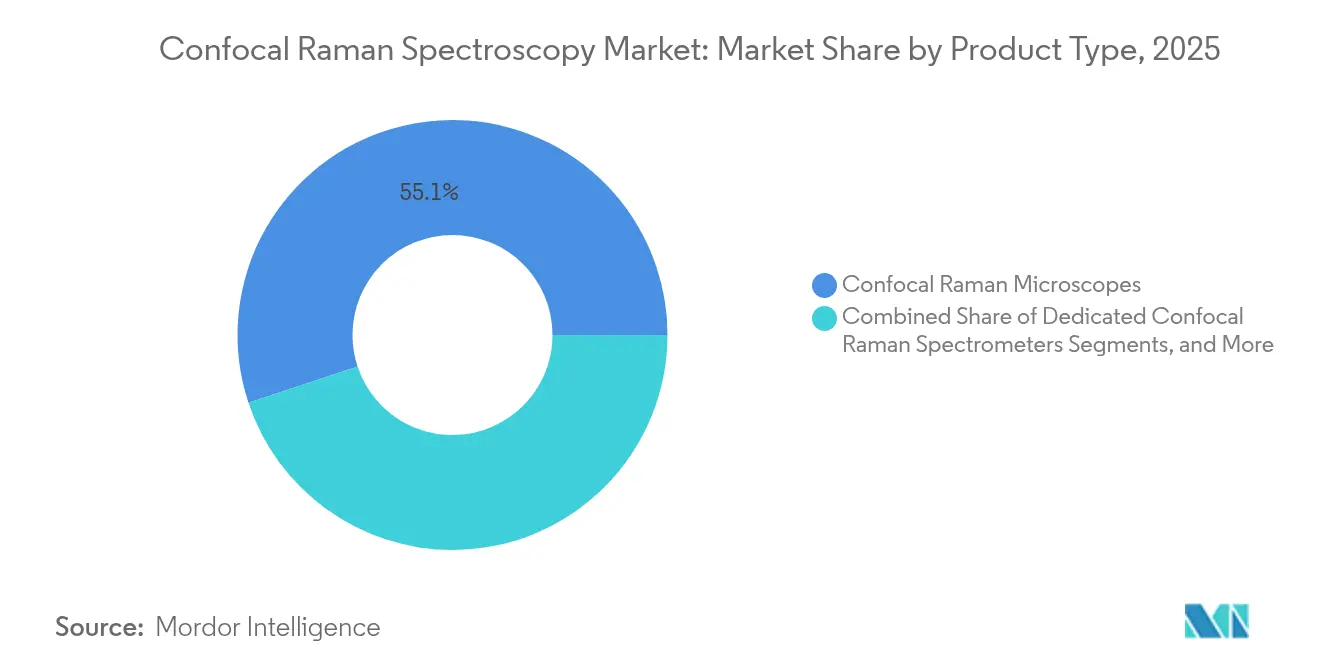
- By product type, confocal Raman microscopes held 55.10% of the confocal Raman spectroscopy market share in 2025, whereas Raman imaging systems are forecast to register the fastest 11.33% CAGR through 2031.
- By configuration, benchtop and desktop units accounted for 59.20% of revenue in 2025; portable and handheld devices are set to expand at a 12.6% CAGR to 2031.
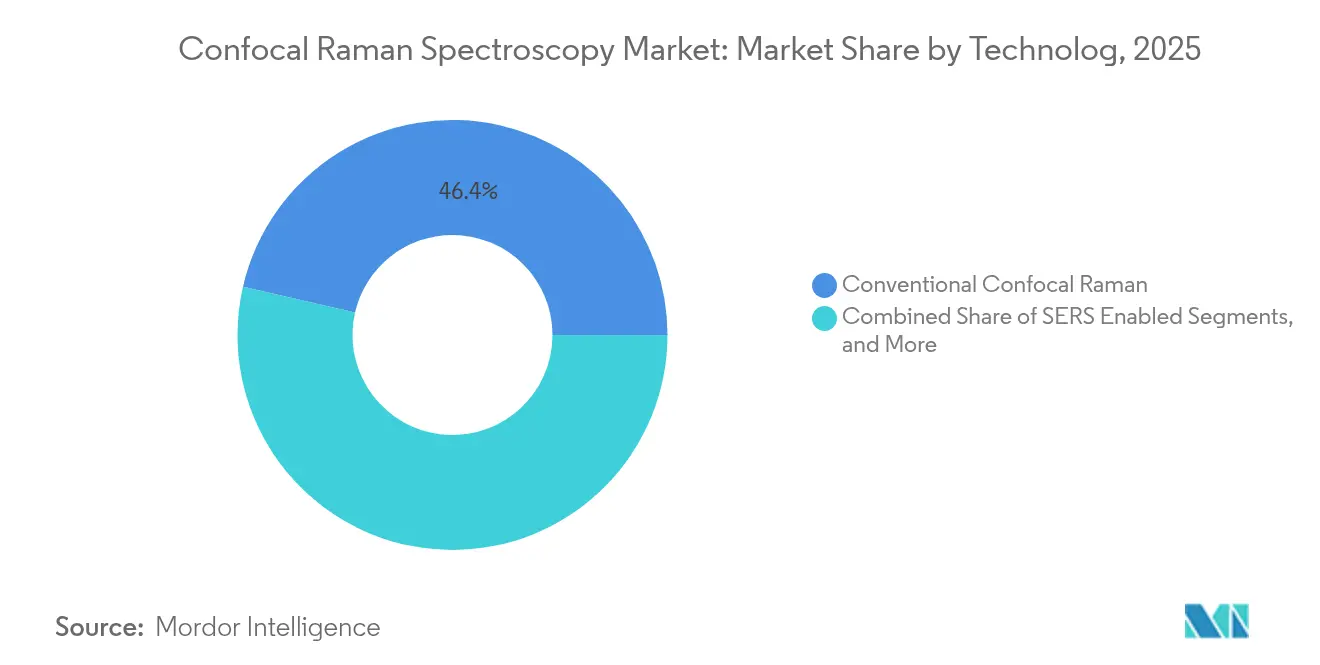
- By technology, conventional confocal platforms captured 46.40% share in 2025, while SERS-enabled systems are projected to grow at a 13.35% CAGR.
- By application, pharmaceutical and biotech workflows commanded 33.10% of revenue in 2025; battery and energy-storage research is expected to post the highest 14.16% CAGR.
- By end user, pharmaceutical and biotechnology companies led with a 37.00% share in 2025, whereas industrial manufacturing enterprises are poised to advance at a 10.15% CAGR.
- By geography, North America contributed 38.90% of global revenue in 2025; Asia-Pacific is projected to expand at an 11.65% CAGR, the fastest worldwide.
Note: Market size and forecast figures in this report are generated using Mordor Intelligence’s proprietary estimation framework, updated with the latest available data and insights as of 2026.
Global Confocal Raman Spectroscopy Market Trends and Insights
Drivers Impact Analysis*
| Driver | (~) % Impact on CAGR Forecast | Geographic Relevance | Impact Timeline |
|---|---|---|---|
| Escalating pharmaceutical R&D spend | +2.1% | Global, with a concentration in North America and Europe | Medium term (2-4 years) |
| Expanding semiconductor quality-control needs | +1.8% | Asia-Pacific core, spill-over to North America | Short term (≤ 2 years) |
| Rapid adoption of portable Raman systems | +1.5% | Global, with early adoption in North America | Short term (≤ 2 years) |
| AI-driven high-throughput spectral analytics | +1.3% | North America and the EU, expanding to Asia-Pacific | Medium term (2-4 years) |
| Battery-grade material demand for EVs | +1.0% | Asia-Pacific and Europe | Long term (≥ 4 years) |
| Source: Mordor Intelligence | |||
Escalating Pharmaceutical R&D Spend
Drug makers increasingly embed confocal Raman tools in process analytical technology frameworks to verify raw materials and monitor critical quality attributes. Inline systems helped attain 100% inspection compliance under FDA GMP rules while trimming batch-release times.[1]Rigaku, “Pharmaceutical Manufacturing Using Raman,” rigaku.com Dermatopharmacokinetic studies used the technique to track drug diffusion up to 80 µm within living skin, supplying bioavailability data vital for topical formulation decisions. Spectral-interpretation algorithms further uncovered subtle polymorphic changes linked to stability, strengthening quality-by-design approaches.
Expanding Semiconductor Quality-Control Needs
Sub-7 nm chip production required nanoscale stress and defect analysis that confocal Raman delivered non-destructively. Inline units identified contamination on silicon wafers, protecting high-value substrates without halting fabrication flows. Chip-scale Raman engines, recently demonstrated on photonic platforms, paved the way for embedded monitoring directly on production tools.
Rapid Adoption of Portable Raman Systems
Miniaturized devices now match laboratory-grade resolution in footprints as small as 7 × 2 × 0.8 cm. Forensics teams used handheld analyzers to identify narcotics in under a minute without sample prep. The 2024 launch of WITec’s alphaCART showed how field-deployable units could even operate through protective glass, opening art-conservation and hazardous-site use cases.
AI-Driven High-Throughput Spectral Analytics
Machine-learning models automate complex pattern recognition, lowering the expertise barrier in routine QC. Pharmaceutical plants applied AI-enhanced Raman readers to differentiate culture media faster than traditional microbiological tests. Synthetic-data techniques bolstered model robustness across diverse matrices, while deep-learning solutions in SERS distinguished electromagnetic from chemical enhancement routes, lifting detection sensitivity.
Restraints Impact Analysis*
| Restraint | (~) % Impact on CAGR Forecast | Geographic Relevance | Impact Timeline |
|---|---|---|---|
| High capital and maintenance costs | -1.4% | Global, particularly impacting smaller laboratories | Short term (≤ 2 years) |
| Scarcity of skilled spectroscopists | -1.1% | Global, with acute shortages in emerging markets | Medium term (2-4 years) |
| Intense competition from alternative imaging | -0.8% | Global, technology-dependent variations | Medium term (2-4 years) |
| Cybersecurity risks in connected instruments | -0.5% | Global, with heightened concerns in regulated industries | Long term (≥ 4 years) |
| Source: Mordor Intelligence | |||
High Capital and Maintenance Costs
System prices ranged from USD 50,000 to beyond USD 300,000, and annual service contracts added 10–15% of purchase value, making acquisition onerous for cash-constrained labs. Tariff-driven increases for semiconductor lasers further inflated budgets. Leasing and instrument-as-a-service arrangements emerged as practical offsets.
Scarcity of Skilled Spectroscopists
Complex vibrational-analysis workflows demanded expertise that remained scarce, especially in developing regions. Vendors responded by bundling intuitive software and remote-training programs, yet workforce gaps persisted.
*Our forecasts treat driver/restraint impacts as directional, not additive. The impact forecasts reflect baseline growth, mix effects, and variable interactions.
Segment Analysis
By Product Type: Microscopes Lead Innovation Wave
Confocal Raman microscopes anchored 55.10% of the confocal Raman spectroscopy market in 2025, a position secured by unrivalled sub-micrometre imaging that suited tablet mapping and fine-line semiconductor inspection. The confocal Raman spectroscopy market size for this segment is projected to expand steadily, while Raman imaging systems are poised for an 11.33% CAGR owing to their high-throughput mosaicking capability. Hybrid Raman-FTIR instruments, though smaller in revenue, appealed to laboratories needing complementary vibrational fingerprints.
Advances in portable microscopes blurred traditional boundaries. WITec’s alphaCART demonstrated field-ready confocal performance through glass barriers, broadening cultural-heritage and hazardous-site use cases. Renishaw’s inVia InSpect targeted forensic labs with automated workflows that safeguarded evidence integrity. Software upgrades featuring AI-assisted spectral deconvolution became an important value driver for instrument refresh cycles.


By Configuration: Portability Drives Market Evolution
Benchtop and desktop platforms held a 59.20% share thanks to stable optics, low noise, and extended acquisition runs, keeping them indispensable in regulated QC suites. Yet portable units earned the fastest 12.6% CAGR as companies pursued in-situ testing. The confocal Raman spectroscopy market size for handheld devices is forecast to widen as miniaturized spectrometers achieve sub-10 cm footprints without sacrificing 7 cm⁻¹ resolution.
Pharmaceutical shippers integrated handheld readers to validate raw materials on loading docks, securing supply chains in real time. Inline probes penetrated bioreactor walls to track nutrient utilization continuously, reducing sample extraction delays. Combined with leasing models, portability changed procurement priorities toward operational flexibility over floor-standing precision.
By Technology: SERS Enhancement Accelerates Adoption
Conventional platforms remained the revenue mainstay with 46.40% of the confocal Raman spectroscopy market. SERS devices, however, are forecast to record the highest 13.35% CAGR as trace detection of pesticides, biomarkers, and explosives commanded premium pricing. Cost-effective colloidal substrates and roll-to-roll nano-molding fostered scalable manufacturing, enabling disposable test cards.
Wearable SERS patches for sweat analysis reached physiological-concentration sensitivity, signalling entry into digital-health monitoring. Metamaterial-based amplifiers improved hotspot reproducibility, broadening their appeal to industrial QC lines. Machine-learning classification handled the dense spectra typical of SERS, making routine deployment feasible even for novice operators.
By Application: Battery Research Emerges as Growth Driver
Pharmaceutical and biotech workflows retained the largest 33.10% revenue share, relying on Raman to validate raw materials, track polymorph transitions, and comply with PAT mandates. Battery and energy-storage R&D is projected to post a 14.16% CAGR, the highest across applications, as the EV industry races to optimize cathode chemistry and electrolyte stability. Inline Raman probes now monitor electrode coating uniformity on production lines, correlating process deviations with downstream cell performance.
Micro-electronics fabrication also remained a reliable user, deploying mapping routines to locate stress gradients that foreshadow wafer bow. Forensics benefited from portable systems verifying narcotic identity on-scene, while food-quality labs used SERS to detect pesticide residues down to parts-per-billion. Environmental scientists adopted fluorescent-tagged nanoparticles paired with Raman to track microplastics in water samples.
By End User: Industrial Manufacturing Gains Momentum
Pharmaceutical and biotechnology firms commanded 37.00% of revenue in 2025, but industrial manufacturers are on course for a 10.15% CAGR as process analytics migrate into chemical, polymer, and advanced-materials plants. The confocal Raman spectroscopy market share for industrial users will rise as inline sensors validate composition in seconds, preventing off-spec batches.
Battery cell factories demonstrated how real-time Raman saved scrap costs by flagging electrode slurry inconsistencies. Food and beverage processors used handheld readers to screen raw produce for adulterants at receiving bays, avoiding laboratory delays. AI-assisted interfaces reduced the skill barrier, allowing on-shift technicians to run procedures once reserved for PhD spectroscopists.
Geography Analysis
North America retained the largest regional revenue share at 38.90% in 2025. Federal quality-by-design regulations kept pharmaceutical producers investing in inline Raman systems for batch release, while domestic chipmakers installing cutting-edge lithography lines required nanoscale stress characterization. Academic grants supported method-development projects, sustaining instrument refresh cycles despite budget scrutiny.
Asia-Pacific delivered the fastest 11.65% CAGR outlook, with China, Japan, and South Korea pouring capital into EV battery plants, compound-semiconductor fabs, and CDMO facilities. Bruker’s purchase of Japan-based Nanophoton underscored the region’s innovation base and channel importance. HORIBA’s double-digit Asian revenue growth likewise indicated how local demand buoyed premium instrumentation. Government subsidies for new-energy vehicles and semiconductor self-sufficiency further incentivized analytical-instrument purchases.
Europe maintained steady expansion anchored by stringent GMP and environmental-monitoring rules. Continental automakers tested Raman to validate battery material purity, while cultural-heritage labs adopted portable units for on-site artwork conservation assessments. Brexit-related regulatory divergence created minor customs delays but did not mute long-term demand, as pharmaceutical clusters in Ireland, Germany, and Belgium continued new-facility construction.

Competitive Landscape
The confocal Raman spectroscopy market remained moderately fragmented. HORIBA, Renishaw, and Bruker formed the technology vanguard, yet emerging Asian suppliers offered price-aggressive alternatives that spurred differentiation moves. HORIBA’s 2024 net sales grew 9.2% to JPY 317.369 billion amid semiconductor and automotive tailwinds.[4]HORIBA Ltd., “2024 Consolidated Financial Results,” horiba.com Renishaw posted GBP 691.301 million in revenue, demonstrating resilience despite component shortages.
Bruker’s February 2024 acquisition of Nanophoton signalled intensified consolidation aimed at speeding product pipelines and regional penetration. Vendors increasingly bundled AI analysis suites and cloud-based collaboration portals to lock in service contracts. Portable platforms became another battleground as miniaturization achievements let smaller entrants capture niche markets, prompting incumbents to launch ruggedized variants. Patent filings in dynamic SERS and integrated photonic Raman modules suggested that next-round competition will hinge on sensitivity, speed, and footprint rather than incremental resolution gains.
Confocal Raman Spectroscopy Industry Leaders
HORIBA Ltd.
Renishaw plc
Bruker Corporation
Thermo Fisher Scientific Inc.
WITec Wissenschaftliche Instrumente und Technologie GmbH
- *Disclaimer: Major Players sorted in no particular order

Recent Industry Developments
- April 2025: Thermo Fisher Scientific released application notes on inline Raman for lithium-ion battery manufacturing.
- March 2025: Nature reported on a 7 cm⁻¹-resolution chip-scale Raman spectrometer measuring only 7 × 2 × 0.8 cm.
- August 2024: HORIBA reported record sales, with the Scientific segment, including Raman, up 4.7% year on year.
- May 2024: Renishaw introduced the inVia InSpect microscope for forensic labs, offering automated dual-laser workflows.


Research Methodology Framework and Report Scope
Market Definitions and Key Coverage
Our study defines the confocal Raman spectroscopy market as the total annual revenue realized from the sale of new, factory-calibrated confocal Raman spectrometers and microscopes that generate depth-resolved chemical images. The equipment spectrum embraces desktop and portable formats together with supplied objective lenses, integrated laser modules, and starter analytical software; upgrades, aftermarket services, and classic non-confocal Raman benches remain outside scope.
Scope Exclusion. The valuation purposefully omits contract analytical services and standalone fiber-optic Raman probes sold without confocal optics.
Segmentation Overview
- By Product Type
- Confocal Raman Microscopes
- Dedicated Confocal Raman Spectrometers
- Raman Imaging Systems
- Hybrid Raman-FTIR Systems
- Accessories and Software
- By Configuration (Form Factor)
- Benchtop/Desktop Systems
- Portable/Handheld Systems
- In-line/Process Raman Systems
- By Technology
- Conventional Confocal Raman
- Surface-Enhanced Raman Spectroscopy (SERS) Enabled
- Tip-Enhanced Raman Spectroscopy (TERS) Enabled
- Coherent Anti-Stokes Raman Scattering (CARS)
- Stimulated Raman Scattering (SRS)
- By Application
- Pharmaceutical and Biotech Drug Development
- Semiconductor and Micro-electronics QC
- Battery and Energy-Storage Research
- Forensic Science and Security
- Food and Agriculture Quality Assurance
- Gemology and Mineralogy
- Environmental and Geology
- Life Sciences and Medical Diagnostics
- Art and Cultural Heritage Conservation
- By End User
- Pharmaceutical and Biotechnology Companies
- Academic and Research Institutes
- Industrial Manufacturing Enterprises
- Government and Regulatory Laboratories
- Clinical and Diagnostic Laboratories
- Others
- By Geography
- North America
- United States
- Canada
- Mexico
- South America
- Brazil
- Argentina
- Rest of South America
- Europe
- Germany
- United Kingdom
- France
- Italy
- Spain
- Rest of Europe
- Asia-Pacific
- China
- Japan
- India
- South Korea
- Rest of Asia-Pacific
- Middle East and Africa
- Middle East
- Saudi Arabia
- United Arab Emirates
- Rest of Middle East
- Africa
- South Africa
- Egypt
- Rest of Africa
- Middle East
- North America
Detailed Research Methodology and Data Validation
Primary Research
Mordor analysts interviewed instrument OEM engineers, procurement heads at pharmaceutical QC labs across North America, Europe, and Asia, plus senior academics running shared Raman facilities. Conversations clarified real-world average selling prices, upgrade cycles, and emerging use cases, informing the variable selection and sanity checks applied to secondary data.
Desk Research
We began by mapping the installed base and shipment trends using open datasets such as United States International Trade Commission HS statistics, Eurostat PRODCOM codes, and Japan's Ministry of Finance trade tables. Industry metrics from associations, including the Laser Institute of America, Spectroscopy Society of Canada, and the International Confederation for Thermal Analysis, helped us frame unit mix by laser class and detector type. Company 10-Ks, SEC S-1 filings, and selected patents accessed through Questel provided price corridors and technology adoption timelines. News aggregations on Dow Jones Factiva rounded out competitive signals. This list is illustrative; additional public records and proprietary notes supported fact-checking throughout the build.
Market-Sizing & Forecasting
A top-down reconstruction from production and trade data set our starting pool, which we then aligned with bottom-up snapshots, sampled OEM revenues multiplied by implied ASPs, to tighten totals. Key drivers in the model include 1) annual pharmaceutical R&D outlay, 2) global semiconductor wafer starts requiring nondestructive QC, 3) growth in battery research publications using Raman, 4) median instrument ASP deflation, and 5) patent filings that signal technology refresh rates. Multivariate regression, supplemented by scenario analysis for regulatory or funding shocks, produced the 2025-2030 curve; gaps in bottom-up data were bridged by calibrated uptake ratios from expert interviews.
Data Validation & Update Cycle
Outputs pass three levels of variance checks, peer review, and a final analyst sign-off before release. The model is refreshed every twelve months, and we trigger interim revisions if material events, such as major M&A, funding spikes, or trade policy shifts, move any core driver.
Why Mordor's Confocal Raman Spectroscopy Baseline Commands Reliability
Published figures often diverge because firms pick dissimilar product mixes, currency bases, and forecast cadences.
We anchor our view on clearly disclosed scope, consistent 2025 USD, and an interview-vetted driver set.
Benchmark comparison
| Market Size | Anonymized source | Primary gap driver |
|---|---|---|
| USD 596.7 million (2025) | Mordor Intelligence | |
| USD 270 million (2024) | Regional Consultancy A | Excludes microscope-integrated hybrids and relies mainly on selective fiscal filings |
| USD 314 million (2023) | Trade Journal B | Uses historic averages without currency or inflation normalization |
| USD 281.9 million (2023) | Global Consultancy C | Counts sample shipment surveys but ignores replacement demand and channel inventory |
Differences largely trace back to scope trimming, dated currency conversions, or unvalidated volume proxies. Our disciplined triangulation, yearly refresh, and transparent driver logic give decision-makers a balanced, reproducible baseline they can trust.


Key Questions Answered in the Report
What is the current size of the confocal Raman spectroscopy market?
The market stood at USD 644.91 million in 2026 and is forecast to reach USD 951.11 million by 2031.
Which region is growing the fastest?
Asia-Pacific is projected to record the highest 11.65% CAGR through 2031, driven by semiconductor and battery-manufacturing investments.
Which application area is expected to grow most quickly?
Battery and energy-storage research is set to post a 14.16% CAGR as electric-vehicle demand fuels advanced materials analysis.
How are portable Raman systems influencing market growth?
Handheld and portable units are expanding at a 12.6% CAGR because they deliver laboratory-grade resolution in field settings, opening new forensic, supply-chain, and environmental uses.
What technological trend is having the greatest impact on data analysis?
AI-driven spectral analytics is automating pattern recognition, cutting interpretation time, and widening adoption among non-experts.
How fragmented is the competitive landscape?
The market is moderately fragmented; the top five firms hold under 50% share, and acquisitions such as Bruker–Nanophoton indicate ongoing consolidation efforts.
Page last updated on:


