Optical Emission Spectroscopy Market Size and Share
Market Overview
| Study Period | 2019 - 2030 |
|---|---|
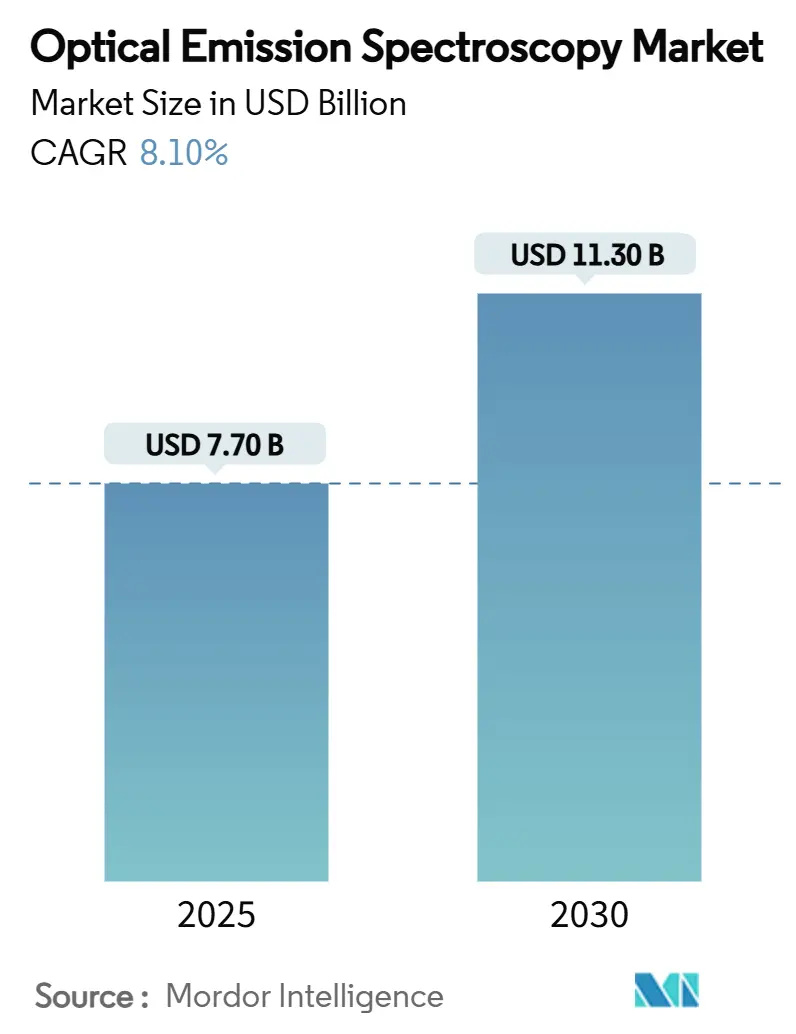
| Market Size (2025) | USD 7.70 Billion |
| Market Size (2030) | USD 11.30 Billion |
| Growth Rate (2025 - 2030) | 8.10% CAGR |
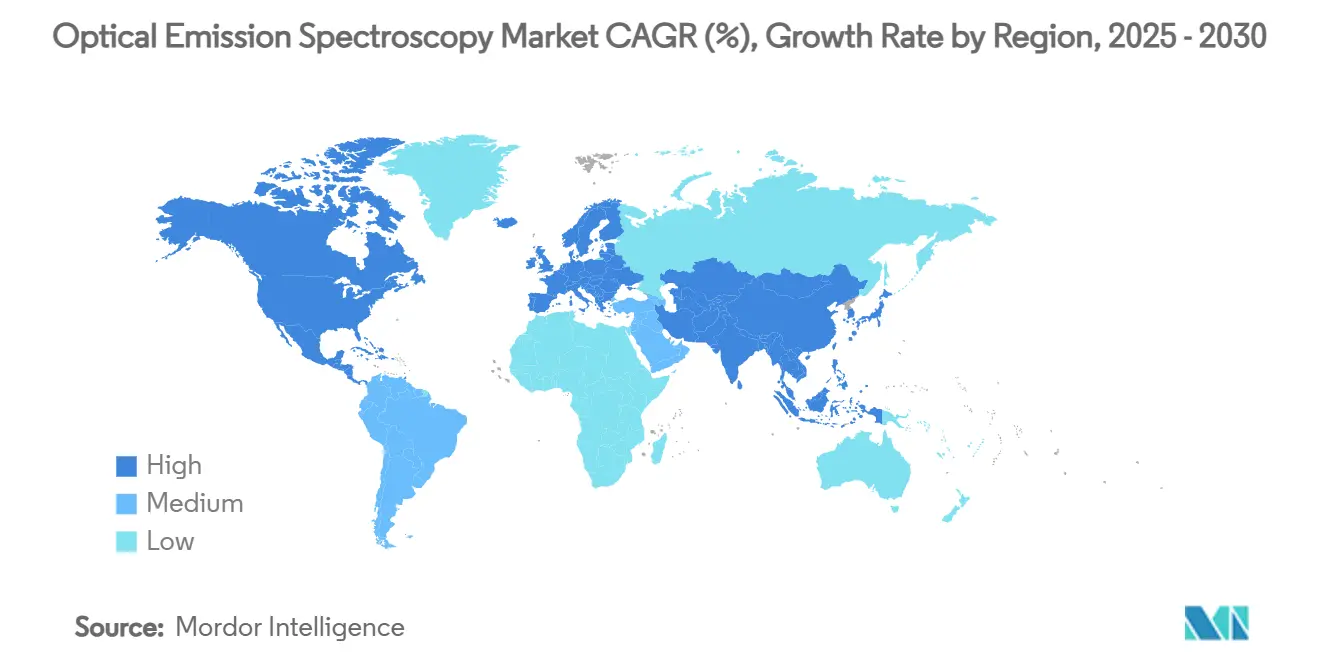
| Fastest Growing Market | North America |
| Largest Market | Asia Pacific |
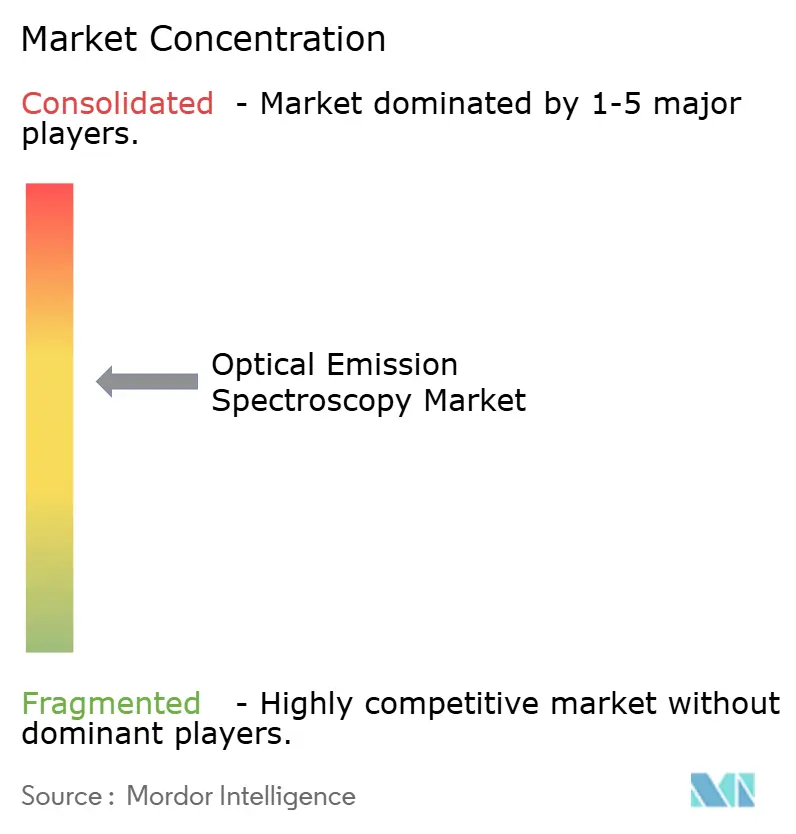
| Market Concentration | Medium |
Major Players *Disclaimer: Major Players sorted in no particular order Image © Mordor Intelligence. Reuse requires attribution under CC BY 4.0. | |
Optical Emission Spectroscopy Market Analysis by Mordor Intelligence
The optical emission spectroscopy market size is estimated at USD 7.7 billion in 2025 and is projected to reach USD 11.3 billion by 2030, growing at an 8.1% CAGR during the forecast period. Robust capital expenditure in smart manufacturing, stricter quality-assurance protocols in metal processing, and the growing need for trace-level environmental monitoring are sustaining demand. Industrial automation programs in the Asia-Pacific region are pairing artificial intelligence with elemental analytics to create closed-loop quality control, while government regulations on air- and water-borne contaminants are increasing instrumentation thresholds for sensitivity. The circular economy push has doubled the importance of alloy verification in metal recycling streams, encouraging the adoption of portable spectrometers that can characterize scrap on-site. At the same time, semiconductor and electric-vehicle producers are moving toward part-per-trillion impurity limits, accelerating laboratory upgrades to ICP-OES platforms with higher precision. Competitive intensity is moderate; however, vertically integrated service portfolios and investments in U.S. manufacturing facilities are widening capability gaps between market leaders and mid-tier suppliers.
Key Report Takeaways
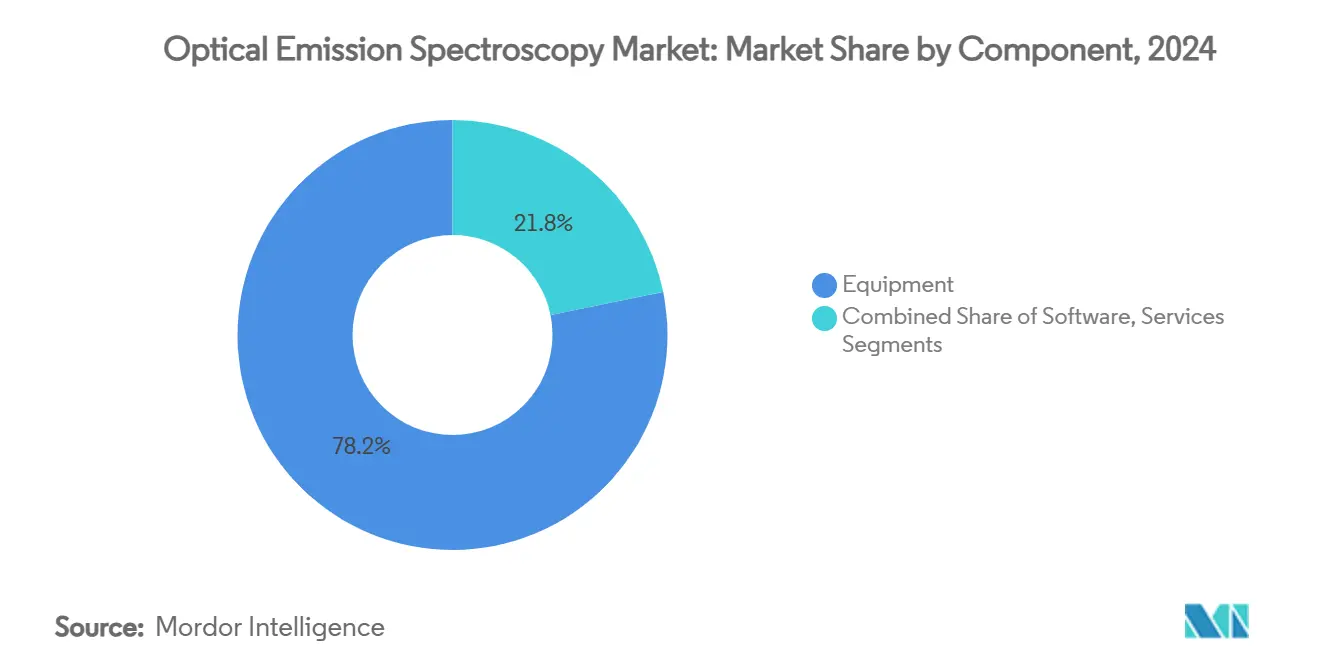
- By component, equipment held 78.2% of the optical emission spectroscopy market share in 2024, while services are projected to expand at a 10.3% CAGR through 2030.
- By technique, Arc/Spark OES led with a 55.8% revenue share in 2024; ICP-OES is forecast to record the fastest growth, with a 9.7% CAGR to 2030.
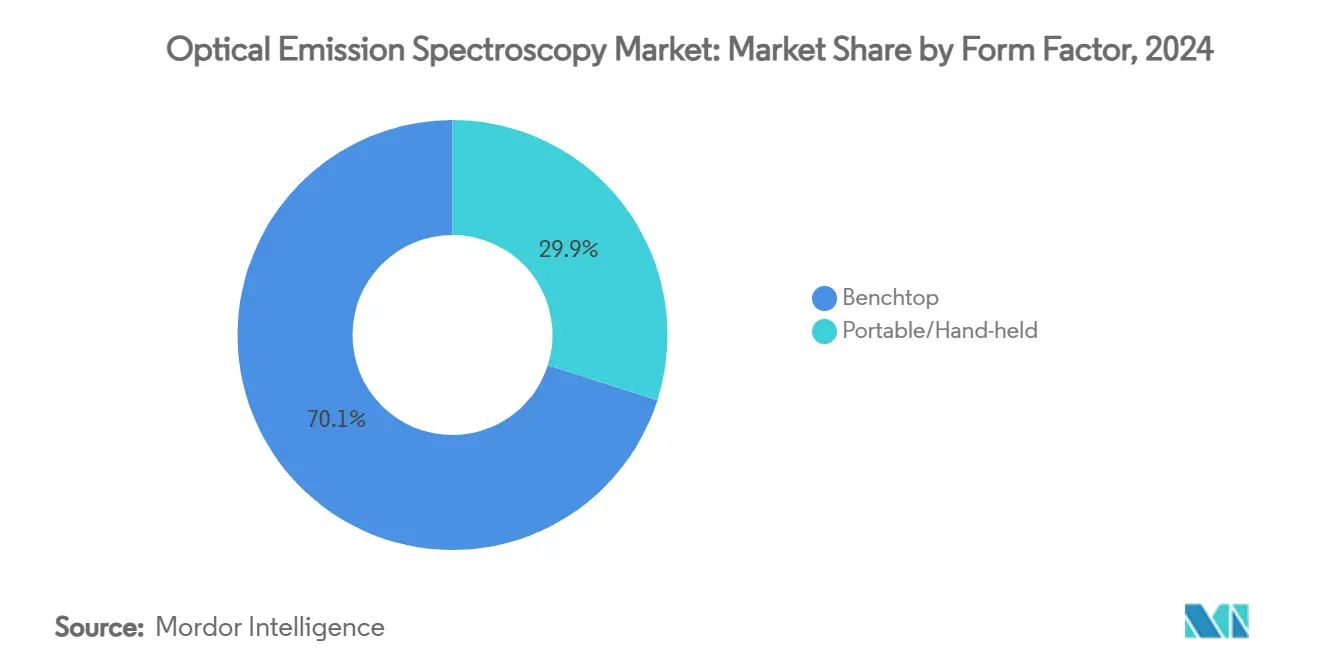
- By form factor, benchtop systems dominated the market with a 70.1% revenue share in 2024; portable and handheld solutions are poised to grow at a 11.8% CAGR through 2030.
- By end-user, metal manufacturing accounted for 31.2% of the optical emission spectroscopy market size in 2024, while environmental testing and recycling are expected to accelerate at a 10.9% CAGR through 2030.
- Geographically, the Asia-Pacific region commanded a 32.7% revenue share in 2024 and is expected to advance at a leading 9.3% CAGR through 2030.
Global Optical Emission Spectroscopy Market Trends and Insights
Drivers Impact Analysis*
| Driver | (~) % Impact on CAGR Forecast | Geographic Relevance | Impact Timeline |
|---|---|---|---|
| Rapid Industrial Automation And Quality Assurance Requirements | +1.50% | Global, with APAC leading adoption | Medium term (2-4 years) |
| Stringent Environmental And Safety Regulations On Metal Production | +0.50% | North America & EU, expanding to APAC | Long term (≥ 4 years) |
| Expansion Of Metal Recycling And Circular Economy Initiatives | +1.80% | Global, with China and EU driving policy | Short term (≤ 2 years) |
| Rising Demand For High-Purity Materials In Electric Vehicles And Semiconductors | +1.20% | APAC core, spill-over to North America | Medium term (2-4 years) |
| Growing Adoption Of Real-Time Process Analytics In Manufacturing | +0.80% | Global, with early gains in Germany, Japan, South Korea | Short term (≤ 2 years) |
| Continuous Technological Innovations In Optical Emission Spectrometers | +1.10% | Global, concentrated in technology hubs | Long term (≥ 4 years) |
| Source: Mordor Intelligence | |||
Rapid Industrial Automation and Quality Assurance Requirements
Factories are introducing cyber-physical production lines where digital twins synchronize machine parameters every second, trimming unplanned downtime by 10% and feeding predictive-maintenance algorithms.[1]D. Daraba, F. Pop, and C. Daraba, “Digital Twin Used in Real-Time Monitoring of Operations Performed on CNC Technological Equipment,” Applied Sciences, mdpi.com Automotive and aerospace assemblers, which operate zero-defect policies, now embed inline spectrometers at each melt station to validate alloy composition before casting. Intelligent quality control software links spectral fingerprints with enterprise resource planning systems to unlock real-time statistical process control. In addition, lean manufacturing programs that integrate automated inspection with process mining are reducing cycle times while enhancing traceability. These advances firmly place the optical emission spectroscopy market at the center of Industry 4.0 deployments.
Stringent Environmental and Safety Regulations on Metal Production
The United States Environmental Protection Agency capped fugitive particulate emissions from copper smelting at 6.3 pounds per hour, obliging smelters to verify trace metals continuously.[2]Environmental Protection Agency, “National Emission Standards for Hazardous Air Pollutants: Primary Copper Smelting,” epa.gov European directives addressing non-ferrous effluents likewise mandate elemental profiling down to parts-per-trillion for lead and cadmium. Laboratories, therefore, favor ICP-OES instruments featuring vertical plasma torches that handle complex matrices without cross-contamination. Analytical suppliers are also developing methods to quantify emerging contaminants, such as PFAS, thereby broadening the application range of optical emission spectroscopy for compliance monitoring.
Expansion of Metal Recycling and Circular-Economy Initiatives
Global scrap-steel use hit 630 million tonnes in 2022 and is projected to double by 2050, compelling scrapyards to verify alloy chemistry on site.[3]OECD, “Unlocking Potential in the Global Scrap Steel Market,” oecd.org Portable spectrometers that deliver instant grade identification now underpin fast sorting lines and reduce contamination penalties. China is expected to supply 45% of global scrap by mid-century, intensifying quality-verification needs across cross-border trade. Electric-arc furnaces rely on such instruments to guarantee recycled steel meets safety thresholds for automotive frames. The circular economy push, therefore, fuels rapid uptake of handheld optical emission systems.
Rising Demand for High-Purity Materials in EVs and Semiconductors
Chip fabrication requires more than 100 specialty chemicals, and spending on these materials is set to triple to USD 13 billion by 2030. Semiconductor-grade metals must now meet part-per-billion impurity limits, prompting fabs to install ICP-OES units with vertical plasma for enhanced matrix tolerance. Electric-vehicle cathode manufacturers apply similar scrutiny since minute contamination degrades battery capacity and safety. Direct solid-analysis methods, including electrothermal vaporization, now cut sample prep time and raise throughput. Collectively, these trends lift demand for spectrometers that combine lower detection limits with high matrix flexibility.
Restraints Impact Analysis*
| Restraint | (~) % Impact on CAGR Forecast | Geographic Relevance | Impact Timeline |
|---|---|---|---|
| High Capital Investment And Maintenance Costs | -1.20% | Global, particularly impacting SMEs | Short term (≤ 2 years) |
| Availability Of Alternative Elemental Analysis Techniques | -0.70% | Global, with technology substitution in specific applications | Medium term (2-4 years) |
| Shortage Of Skilled Analytical Personnel | -0.50% | Global, acute in developed markets | Long term (≥ 4 years) |
| Volatility In Raw Material Supply For Spectrometer Components | -0.40% | Global, concentrated in semiconductor supply chains | Short term (≤ 2 years) |
| Source: Mordor Intelligence | |||
High Capital Investment and Maintenance Costs
Annual running expenses for ICP-OES average USD 5,700, whereas ICP-MS ownership can climb to USD 13,250 once argon, electricity, and consumables are factored in. Preventive maintenance demands skilled operators who can replace plasma torches, sample cones, and peristaltic tubing before blockages occur. Proposed import tariffs on semiconductor chips threaten to inflate spare part prices, adding uncertainty to purchasing decisions among academic laboratories and small foundries. Consequently, some buyers delay upgrades or turn to refurbished units, modestly constraining the optical emission spectroscopy market until cost-of-ownership models improve.
Availability Of Alternative Elemental Analysis Techniques
Handheld X-ray fluorescence, laser-induced breakdown spectroscopy, and ICP-MS are widening their application scope across scrap yards, mining sites, and semiconductor cleanrooms, challenging the dominance of spark and ICP-OES systems. XRF guns deliver instant alloy identification without sample preparation, while LIBS instruments detect light elements such as lithium that conventional spark OES struggles to quantify. Fabs that need sub-ppb accuracy for ultrapure process chemicals are shifting to ICP-MS even though annual running costs can reach USD 13,250, more than double typical ICP-OES expenses. The expanding performance envelope and falling price points of these alternatives persuade some small and mid-sized laboratories to defer optical-emission upgrades. Consequently, competition from substitute techniques is expected to shave about 0.7% off the market’s projected CAGR over the medium term as vendors race to differentiate on speed, automation, and matrix tolerance.
*Our forecasts treat driver/restraint impacts as directional, not additive. The impact forecasts reflect baseline growth, mix effects, and variable interactions.
Segment Analysis
By Component: Services Accelerate Despite Equipment Dominance
Equipment contributed 78.2% revenue in 2024, underlining high upfront spending on advanced spectrometers by steel mills, automotive foundries, and aerospace casting houses. Nevertheless, service contracts encompassing installation, calibration, and operator training are growing at a 10.3% CAGR as manufacturers seek turnkey analytical solutions. Software, although currently the smallest slice, is emerging as the glue that merges spectral data with MES platforms. Artificial-intelligence modules capable of classifying spectral anomalies in seconds are enhancing the value proposition, facilitating the optical emission spectroscopy market's transition from instrument sales to life-cycle performance agreements.
The optical emission spectroscopy market is projected to grow, reflecting the downward pressure equipment owners face to meet audit trails and uptime guarantees. Vendors now bundle SaaS dashboards that monitor argon flow, torch usage, and detector drift remotely. This proactive approach reduces unplanned outages and secures recurring revenue, reinforcing the market’s pivot toward outcome-based service models.


By Technique: ICP-OES Gains Ground Against Arc/Spark Dominance
Arc/Spark instruments held 55.8% revenue share in 2024 due to their rugged design and ability to analyze solid metal samples without dissolution. Foundries value the 30-second analysis cycle that confirms melt chemistry before ladle tapping. Yet ICP-OES systems are gaining at a 9.7% CAGR, fueled by semiconductor and battery plants where part-per-billion precision is non-negotiable. Innovations such as vertical plasma orientation and intelligent rinse protocols are pushing matrix tolerance higher, removing historical barriers to adoption.
Consequently, the optical emission spectroscopy market size for ICP-OES is expected to hit USD 4.9 billion in 2030, narrowing the gap with Arc/Spark. Glow-discharge OES remains a niche tool for depth-profiling coatings but benefits from aerospace interest in surface-treatment validation. The technique mix is therefore broadening, providing users with a spectrum of capability versus cost trade-offs.
By Form Factor: Portable Solutions Transform Field Analysis
Benchtop systems generated 70.1% of 2024 revenue, anchored in metallurgical laboratories that prioritize spectral coverage and lower detection limits. Yet recyclable-metal traders and environmental inspectors are turning toward handheld units that couple micro-optics with CMOS detectors. Sales of portable analyzers are forecast to rise 11.8% annually, underscoring an appetite to perform verification at scrapyard gates or mining sites without transporting samples off-site.
The optical emission spectroscopy market share commanded by portable devices is projected to reach 34% by 2030 as device mass falls below 1 kg and battery life extends beyond 8 hours. Smartphone-attachable spectrometers capable of 5 nm resolution demonstrate future potential to democratize elemental analysis, enabling technicians to instantly confirm alloy grade before downstream processing.
By End-User: Environmental Testing Outpaces Traditional Manufacturing
Metal manufacturing and foundry operations accounted for 31.2% of revenue in 2024, reflecting continuous use in molten-metal control. Automotive engineers rely on spark OES to validate chassis alloys prior to stamping, and aerospace OEMs deploy ICP-OES to ensure turbine-blade superalloys meet fatigue resistance standards. However, environmental laboratories and recycling facilities will grow the fastest at 10.9% CAGR through 2030 as regulators impose tighter limits on heavy-metal discharges.
The optical emission spectroscopy market size for environmental testing is forecast to surpass USD 1.6 billion by 2030. Advanced non-targeted characterization workflows can now screen surface water for up to 65 elements in a single run. Portable spectrometers that perform positive-material identification at scrap yards reduce alloy mix-ups, underpinning circular-economy targets and lowering carbon footprints for downstream manufacturers.
Geography Analysis
The Asia-Pacific region led the optical emission spectroscopy market with 32.7% revenue share in 2024, and its 9.3% CAGR outlook remains the strongest worldwide. China’s dominance in steel recycling and India’s Make in India initiatives are translating into sustained investment in elemental analytics. Japanese and South Korean fabs are commissioning new ICP-OES suites to meet semiconductor-grade purity specifications. Shimadzu’s plan to open an analytical instrument factory in Karnataka by 2027 signifies a growing momentum for local production. Regional governments also provide incentives for smart manufacturing upgrades, bolstering demand for real-time spectroscopic quality control.
North America comprises a mature yet innovative-heavy segment. U.S. producers are reshoring chip fabrication, tripling demand for ultra-pure process chemicals that require stringent impurity screening. Thermo Fisher’s USD 2 billion investment to expand domestic manufacturing will improve delivery lead times and support regulatory compliance for both pharmaceutical and metals customers. Europe follows a similar trajectory, but strict environmental directives are pushing the adoption of portable OES in scrapyards and foundries that seek audit-ready test records.
Emerging economies in the Middle East, Africa, and South America are upgrading metallurgical infrastructure for construction and energy projects. These regions favor rugged, low-maintenance spectrometers tolerant of dust and temperature extremes. Shimadzu’s Mexican subsidiary expects 150% growth by FY2028, underscoring latent demand once local service and application support networks mature.

Competitive Landscape
Industry structure is moderately consolidated; the top five suppliers collectively hold about 65% of revenue. Thermo Fisher, AMETEK, and Hitachi High-Tech leverage large R&D budgets to refresh product lines every two to three years, making it difficult for smaller entrants to match performance tiers. Recent acquisitions illustrate portfolio expansion trends: AMETEK bought Kern Microtechnik to integrate precision machining know-how that complements its spectrometer offerings, and Virtek Vision to add laser-based inspection capabilities.
Technology differentiation hinges on automation readiness, spectral resolution, and cloud-based data analytics. AMETEK’s new spark-OES models feature automatic argon purging sequences that cut gas consumption by 30%. Hitachi High-Tech has introduced SEM-integrated elemental mapping to provide combined morphology and chemistry insights in one station. Portable-instrument specialists are disrupting field analysis by miniaturizing optical benches and deploying AI-powered alloy libraries downloadable over cellular networks.
Service breadth is an increasingly decisive factor. Vendors that offer online monitoring dashboards, calibration reminders, and consumable logistics support are securing multi-year contracts. Market leaders are also localizing manufacturing in high-growth regions to avoid tariff uncertainty and reduce carbon emissions tied to transcontinental shipping, further tightening client relationships.
Optical Emission Spectroscopy Industry Leaders
Thermo Fisher Scientific Inc.
AMETEK Inc.
Hitachi High-Tech Analytical Science
Shimadzu Corporation
HORIBA Ltd.
- *Disclaimer: Major Players sorted in no particular order

Recent Industry Developments
- April 2025: Thermo Fisher Scientific committed USD 2 billion over four years to expand U.S. instrument manufacturing and R&D, covering optical emission spectrometers and related platforms.
- February 2025: AMETEK acquired Kern Microtechnik, strengthening its precision-machining and optical-inspection capabilities for semiconductor and medical markets.
- January 2025: Bruker Corporation launched the timsMetabo mass spectrometer featuring trapped ion mobility spectrometry for 4D-Metabolomics research, adding an automated QSee quality-control suite.
- November 2024: AMETEK acquired Virtek Vision International, integrating 3D laser projection and inspection technologies into its Electronic Instruments Group.


Global Optical Emission Spectroscopy Market Report Scope
| Equipment |
| Software |
| Services |
| Arc/Spark OES |
| ICP-OES |
| Glow Discharge OES |
| Benchtop |
| Portable/Hand-held |
| Automotive & Transportation |
| Aerospace & Defence |
| Metal Manufacturing & Foundry |
| Oil, Gas & Petrochemical |
| Environmental Testing & Recycling |
| Research & Academics |
| North America | United States |
| Canada | |
| Mexico | |
| Europe | Germany |
| United Kingdom | |
| France | |
| Italy | |
| Spain | |
| Russia | |
| Rest of Europe | |
| Asia Pacific | China |
| Japan | |
| India | |
| South Korea | |
| Australia | |
| Rest of Asia Pacific | |
| Middle East and Africa | GCC |
| South Africa | |
| Rest of Middle East & Africa | |
| South America | Brazil |
| Argentina | |
| Rest of South America |
| By Component | Equipment | |
| Software | ||
| Services | ||
| By Technique | Arc/Spark OES | |
| ICP-OES | ||
| Glow Discharge OES | ||
| By Form Factor | Benchtop | |
| Portable/Hand-held | ||
| By End-user | Automotive & Transportation | |
| Aerospace & Defence | ||
| Metal Manufacturing & Foundry | ||
| Oil, Gas & Petrochemical | ||
| Environmental Testing & Recycling | ||
| Research & Academics | ||
| By Geography | North America | United States |
| Canada | ||
| Mexico | ||
| Europe | Germany | |
| United Kingdom | ||
| France | ||
| Italy | ||
| Spain | ||
| Russia | ||
| Rest of Europe | ||
| Asia Pacific | China | |
| Japan | ||
| India | ||
| South Korea | ||
| Australia | ||
| Rest of Asia Pacific | ||
| Middle East and Africa | GCC | |
| South Africa | ||
| Rest of Middle East & Africa | ||
| South America | Brazil | |
| Argentina | ||
| Rest of South America | ||


Key Questions Answered in the Report
What is the current value of the optical emission spectroscopy market?
The market is valued at USD 7.7 billion in 2025 and is expected to reach USD 11.3 billion by 2030.
Which region leads the optical emission spectroscopy market?
Asia-Pacific holds 32.7% of revenue in 2024 and is projected to grow at a 9.3% CAGR through 2030.
Why are ICP-OES instruments gaining popularity?
They offer part-per-billion detection limits required for semiconductor and electric-vehicle production, driving a 9.7% CAGR for the technique.
How are portable spectrometers impacting recycling?
Handheld units verify alloy composition on site, supporting circular-economy goals and registering an 11.8% CAGR.
What are the major restraints for new buyers?
High capital and maintenance costs, with annual ICP-MS operating expenses around USD 13,250, pose barriers for small and medium enterprises.
Which component segment is growing fastest?
Services, including maintenance and calibration, will expand at a 10.3% CAGR as users demand turnkey analytical solutions.
Page last updated on:


