Infrared Sensor Market Size and Share
Market Overview
| Study Period | 2020 - 2031 |
|---|---|
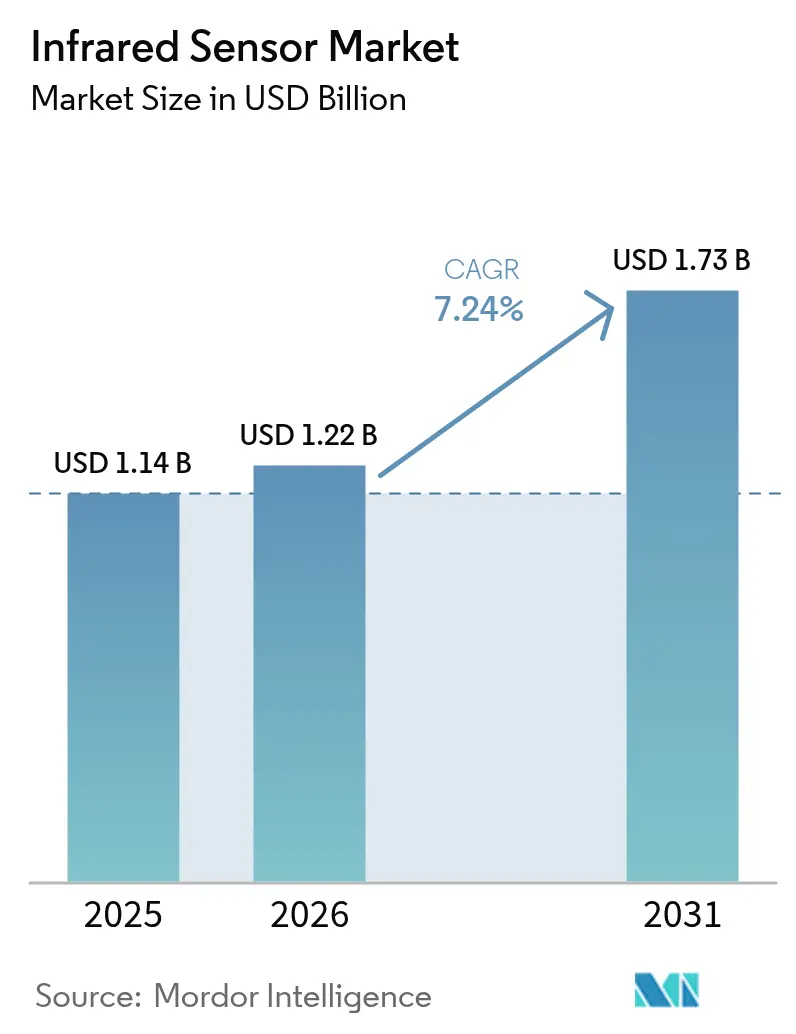
| Market Size (2026) | USD 1.22 Billion |
| Market Size (2031) | USD 1.73 Billion |
| Growth Rate (2026 - 2031) | 7.24% CAGR |
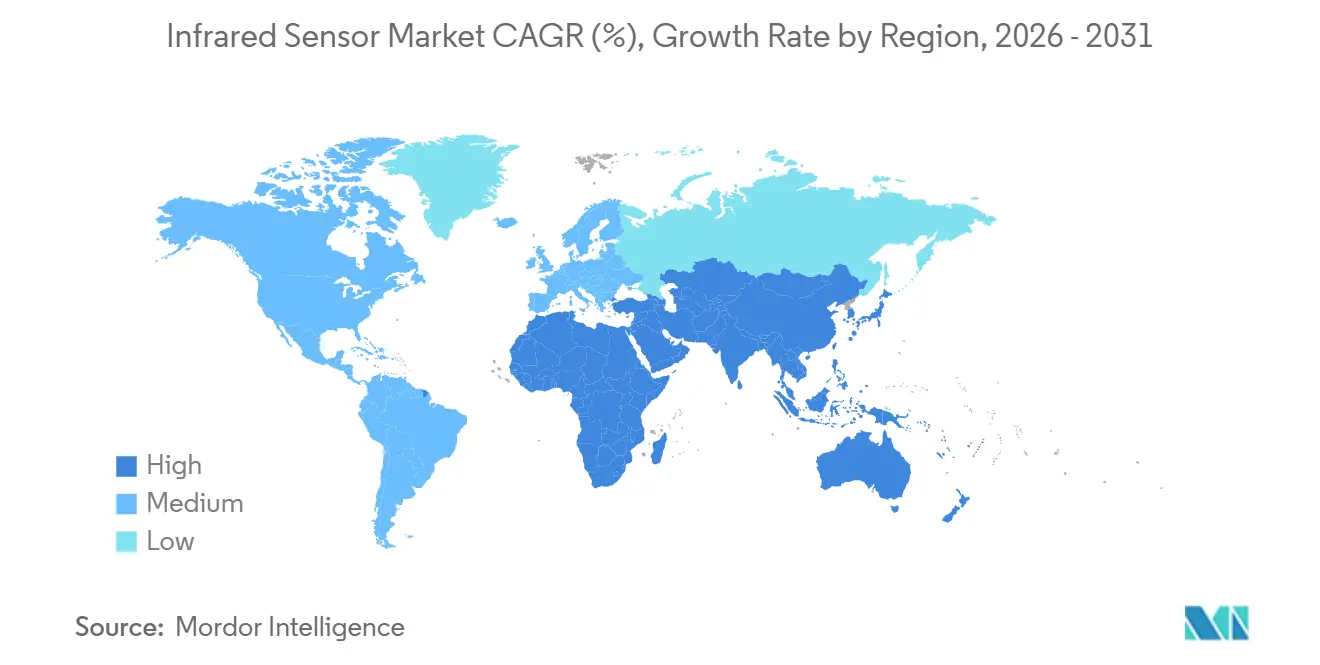
| Fastest Growing Market | Africa |
| Largest Market | Asia Pacific |
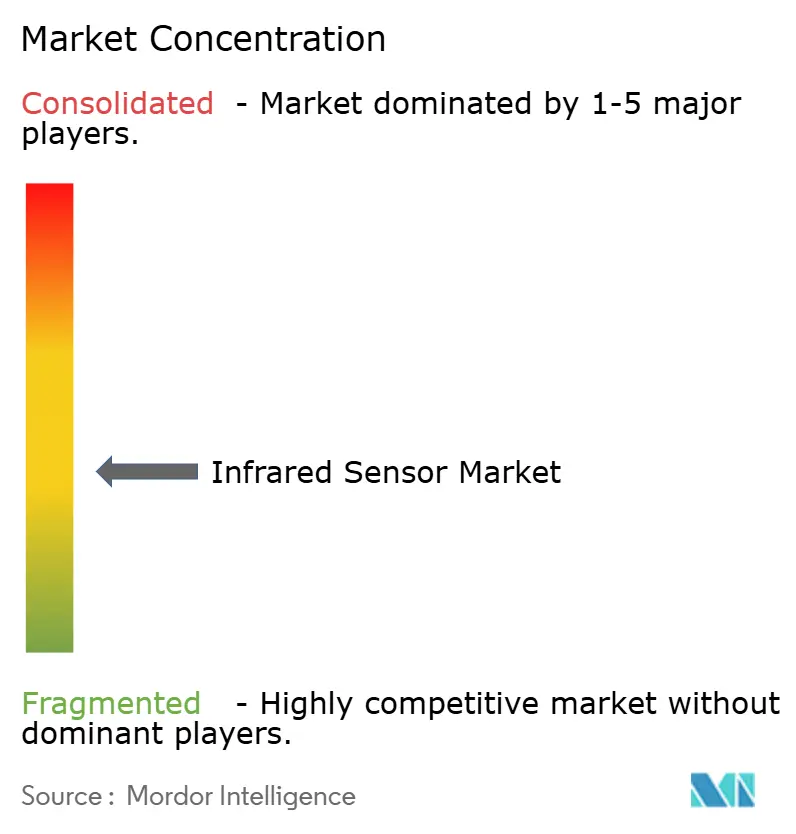
| Market Concentration | Medium |
Major Players *Disclaimer: Major Players sorted in no particular order Image © Mordor Intelligence. Reuse requires attribution under CC BY 4.0. | |
Infrared Sensor Market Analysis by Mordor Intelligence
The infrared sensor market size is expected to increase from USD 1.14 billion in 2025 to USD 1.22 billion in 2026 and reach USD 1.73 billion by 2031, growing at a CAGR of 7.24% over 2026-2031. The uptick reflects how continuously improving edge intelligence is widening demand beyond legacy motion-detection and temperature-measurement roles. Chip-scale quantum cascade detectors, wafer-level packaging, and colloidal-quantum-dot imagers are collapsing the bill of materials, while sovereign data mandates in the European Union and China are steering integrators toward on-device inference that favors ultra-low-power uncooled arrays. At the same time, automotive safety regulations, precision agriculture pilots, and hospital infection-control protocols are creating new use cases that are pulling the infrared sensor market into consumer, industrial, and healthcare wearables. Competitive intensity is rising as start-ups commercialize neuromorphic signal processing and as incumbents shift capital toward heterogeneous integration to protect margins while meeting new performance targets.
Key Report Takeaways
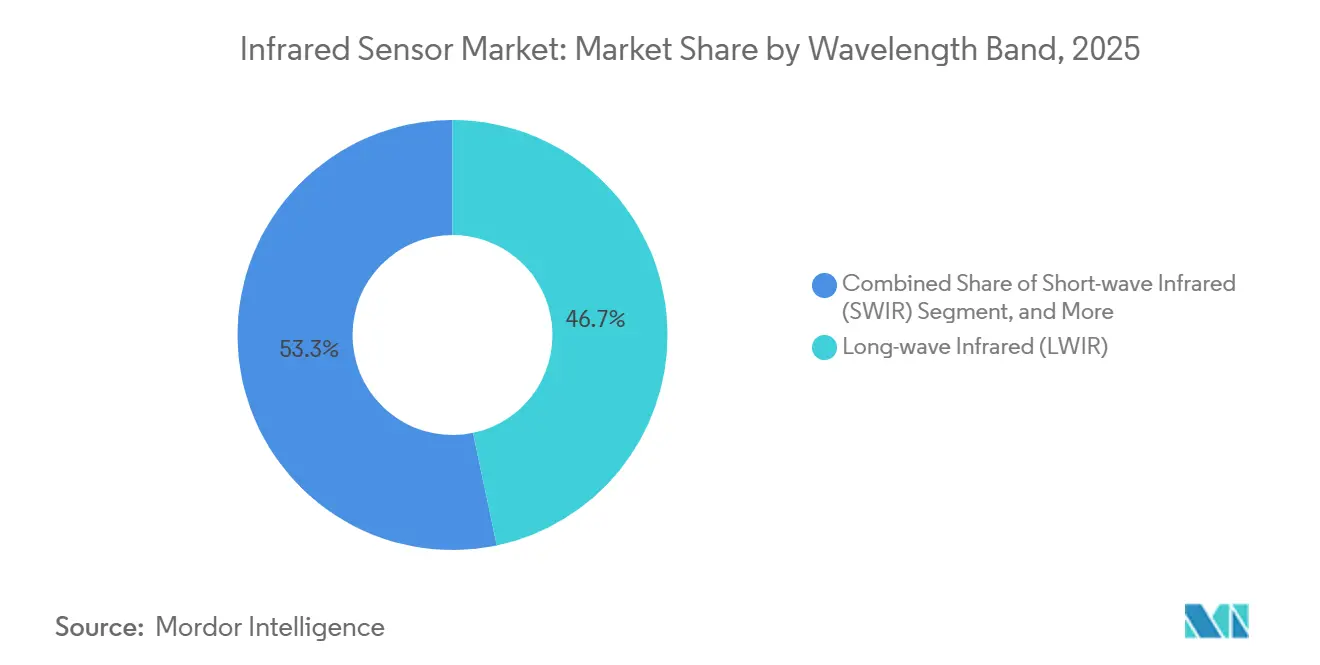
- By wavelength band, long-wave infrared led with 46.71% revenue share in 2025, while short-wave infrared is forecast to expand at a 7.82% CAGR to 2031.
- By technology, uncooled detectors held 64.51% of the infrared sensor market share in 2025, whereas cooled focal-plane arrays are advancing at a 7.66% CAGR through 2031.
- By working mechanism, passive architectures accounted for 59.34% of deployments in 2025, while active time-of-flight systems are projected to grow at a 7.61% CAGR.
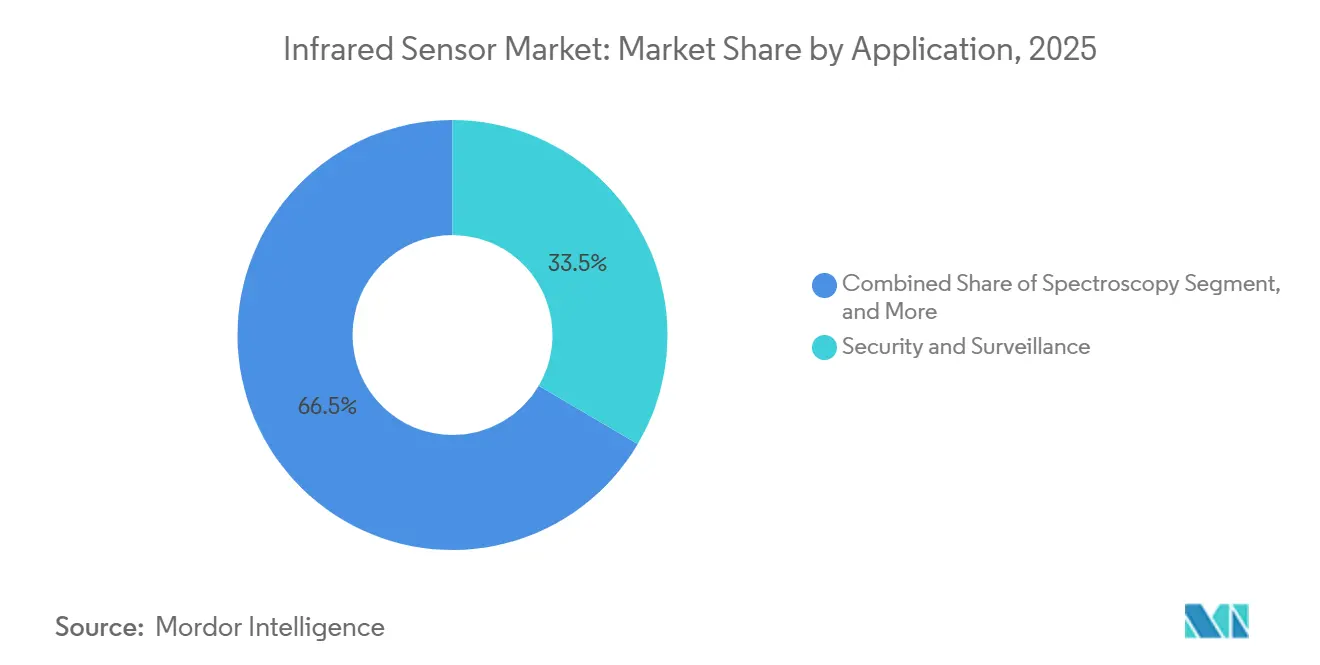
- By application, security and surveillance accounted for 33.46% of revenue in 2025, yet precision agriculture and livestock monitoring is the fastest rising use case at 8.47% CAGR.
- By end-user industry, aerospace and defense represented 28.91% of spending in 2025, whereas healthcare is growing at an 8.43% CAGR on the back of wearable and diagnostic adoption.
- By geography, Asia Pacific accounted for 35.87% of global revenue in 2025, while Africa is the fastest-growing region, with an 8.22% CAGR to 2031.
Note: Market size and forecast figures in this report are generated using Mordor Intelligence’s proprietary estimation framework, updated with the latest available data and insights as of 2026.
Global Infrared Sensor Market Trends and Insights
Drivers Impact Analysis*
| Driver | (~) % Impact on CAGR Forecast | Geographic Relevance | Impact Timeline |
|---|---|---|---|
| Surging Adoption of Industry 4.0 Automation | +1.2% | Germany, United States, China, Japan | Medium term (2-4 years) |
| Rising Demand from ADAS and Autonomous Vehicles | +1.3% | North America, Europe, China, Japan, South Korea | Medium term (2-4 years) |
| On-chip AI Enabling Ultra-low-power Event-Driven Sensing | +0.9% | Asia Pacific semiconductor hubs, spill-over to North America and Europe | Long term (≥4 years) |
| Expanding Smart-home and Consumer Electronics Base | +0.8% | Major urban centers in North America, Europe, and Asia Pacific | Short term (≤2 years) |
| Stricter Safety and Environmental Regulations Driving Gas Monitoring | +0.6% | European Union, United States, Middle East oil and gas sites | Medium term (2-4 years) |
| Quantum Cascade Detector Breakthroughs Unlocking Compact Mid-IR Modules | +0.7% | North America and Europe R&D clusters, manufacturing scale in Asia Pacific | Long term (≥4 years) |
| Source: Mordor Intelligence | |||
Surging Adoption of Industry 4.0 Automation
Smart factories now embed infrared arrays in predictive-maintenance workflows that track bearing temperatures, pinpoint thermal anomalies in switchgear, and verify solder-joint quality on high-speed lines. A 2024 IEEE study of semiconductor fabs reported that shifting from time-based to thermal-triggered intervention cut unplanned downtime by up to 40%.[1]IEEE Transactions on Industrial Informatics, “Predictive Maintenance in Semiconductor Fabrication Using Thermal Imaging,” IEEE.ORG Germany’s Industrie 4.0 and China’s Made in China 2025 programs require real-time thermal feeds inside digital twins, so integrators are fusing microbolometer data with vibration and acoustic signatures at sub-100-millisecond latency. Edge gateways interpret those multi-modal signals locally, improving failure classification accuracy and widening the infrared sensor market across food processing, pharmaceutical cleanrooms, and automotive paint shops.
Rising Demand from ADAS and Autonomous Vehicles
Thermal cameras detect pedestrians and animals even in zero-lux conditions, such as fog, rain, or snow. A 2025 Society of Automotive Engineers paper showed that blending a 640 × 480 uncooled long-wave stream with radar cut false-positive emergency braking by 62%.[2]Society of Automotive Engineers, “Sensor Fusion for Pedestrian Detection in ADAS,” SAE.ORG The European Union General Safety Regulation 2, effective July 2024, requires new models to include pedestrian-detection systems with a 75-meter range at 80 km/h, prompting automakers to specify thermal as their primary night-vision modality. Teledyne FLIR’s 12-micrometer Boson+ module consumes below 40 mW and slides into side-mirror cavities without enlarging a vehicle’s thermal budget. In the cabin, near-infrared time-of-flight units classify occupant posture in less than 50 milliseconds, satisfying proposed United States airbag rules and opening incremental volume for the infrared sensor market.
On-chip AI Enabling Ultra-low-power Event-Driven Infrared Sensing
Neuromorphic pipelines that sit directly atop pyroelectric and thermopile pixels now trigger data uploads only when anomalies surface, trimming energy draw to microwatt levels. STMicroelectronics’ STHS34PF80, shipped in May 2025, integrates a motion classifier on the die, multiplying coin-cell life by 5 in wireless nodes.[3]STMicroelectronics, “Colloidal Quantum Dot SWIR Sensor for Volume Production,” ST.COM Nature Electronics documented superconducting nanowire arrays with in-sensor convolution that recognized thermal patterns at 10 fps while consuming 200 µW, a 50-fold gain over microcontroller farms. As foundries co-integrate RISC-V inference cores with analog front ends, the price gap between “smart” and commodity thermal parts is shrinking, so event-driven functions will proliferate in smart-home, retail, and building-automation endpoints.
Expanding Smart-home and Consumer Electronics Base
Urban consumers are embedding passive infrared nodes in lighting, HVAC, and security devices. Murata’s IRS-D200ST00R1, launched September 2025, embeds algorithms that keep standby power under 10 µW and extend battery life past a decade. Amazon, Google, and Apple have each added native presence-detection hooks into their smart-home operating systems, enabling applications to blend thermal inputs with microphone and mmWave cues. These trends scale unit volumes quickly, anchoring baseline demand across North America, Europe, and the Asia Pacific.
Restraints Impact Analysis*
| Restraint | (~) % Impact on CAGR Forecast | Geographic Relevance | Impact Timeline |
|---|---|---|---|
| High Cost and Cryogenic Cooling Requirements for Cooled Detectors | -0.5% | Global, with acute pressure in price-sensitive Asia Pacific and Africa markets | Short term (≤2 years) |
| Scarcity of Telluride and Selenide Compounds | -0.4% | Global, supply concentration in China, limited refining in North America, Europe | Medium term (2-4 years) |
| Temperature-drift Induced Recalibration Overheads | -0.3% | Global outdoor and industrial deployments in extreme climates | Short term (≤2 years) |
| Export-control Restrictions on Long-wave Technologies | -0.2% | North America, Europe, China, South Korea, Middle East | Long term (≥4 years) |
| Source: Mordor Intelligence | |||
High Cost and Cryogenic Cooling Requirements for Cooled Detectors
Stirling-cycle or Joule-Thomson coolers keep mid-wave and long-wave focal-plane arrays near 80 Kelvin, pushing system costs to USD 10,000-100,000 and drawing 5-10 W of power. A 2024 SPIE study pegged mean time between failures for miniature Stirling units at 8,000-12,000 hours, so field replacements add USD 3,000-5,000 in lifecycle outlays. Those figures block uptake in cost-sensitive building, automotive, and consumer verticals, even though cooled cameras deliver superior sensitivity. Vendors are prototyping thermoelectric alternatives, but physics still imposes sizeable thermal loads.
Scarcity of Telluride and Selenide Compounds
Tellurium is a copper-refining by-product, and global output was near 500 t in 2024, with China controlling roughly 70%. After Beijing tightened dual-use export quotas, spot prices climbed from USD 50/kg in early 2024 to USD 85/kg by Q4 2025, derailing cadmium-mercury-telluride procurement for defense programs. Materials Today flagged silver-telluride quantum dots as a lead-free option, and STMicroelectronics moved the chemistry into volume production in March 2025, yet deposition tools and quality-control protocols still need to be scaled. Western buyers remain exposed to geopolitical supply shocks until secondary refining capacity comes online.
*Our forecasts treat driver/restraint impacts as directional, not additive. The impact forecasts reflect baseline growth, mix effects, and variable interactions.
Segment Analysis
By Wavelength Band: Colloidal Quantum Dots Propel Short-wave Gains
Short-wave devices are expanding at a 7.82% CAGR, beating the overall infrared sensor market average as silver-telluride quantum dots displace indium-gallium-arsenide at sub-USD 5 per module. In 2025, long-wave sensors accounted for 46.71% of revenue, driven by security perimeters and building retrofits. Quantum cascade detector miniaturization is compressing mid-wave hardware to 500 g handheld units that retail below USD 2,000, down from USD 20,000 for legacy Fourier-transform spectrometers.
These cost and material breakthroughs are broadening use cases. Short-wave modules now power smartphone spectroscopy, counterfeit-currency checks, and moisture mapping in agriculture, while mid-wave modules ride carbon-dioxide and methane absorption lines for gas-leak surveillance. As performance converges and prices fall, the infrared sensor market for short-wave applications is expected to grow steadily, though long-wave incumbents will retain niches where absolute thermal contrast in ambient scenes remains critical.


By Technology: Uncooled Dominance Persists, Cooled Carves Focused Niche
Uncooled arrays held 64.51% of the infrared sensor market share in 2025, largely because microbolometers operate at ambient temperature and sip under 1 W. Cooled cameras, while tracking at 7.66% CAGR, stay tethered to defense, aerospace, and scientific work that can fund USD 10,000-plus price tags. The gap is narrowing as Boson+ uncooled modules reach a noise-equivalent temperature difference of 50 mK, rivalling entry-level cooled systems at one-tenth the power. Thermoelectric sub-cooling is emerging as a middle path for handheld gas-analyzers that need better sensitivity than microbolometers but cannot stomach cryogenic costs.
Cost inflection will dictate crossover volume, playing a critical role in shaping the adoption of advanced technologies. If Stirling cooling drops below USD 2,000 per engine by 2028, automotive night-vision suppliers might pivot to mid-wave focal planes, which offer enhanced performance in specific applications. However, until this cost threshold is achieved, wafer-level integration continues to drive advancements in uncooled sensors. This integration sustains a steep price-performance curve, ensuring uncooled sensors remain the cornerstone of high-volume consumer and industrial rollouts in the infrared sensor market, supporting diverse use cases and expanding market penetration.
By Working Mechanism: Active Time-of-Flight Gains Momentum
Passive architectures accounted for 59.34% of shipments in 2025, favored for motion detectors and battery-powered HVAC controllers that require a service life of 5 years or more. Active time-of-flight units, however, are climbing at 7.61% CAGR on the back of automotive safety rules. STMicroelectronics’ VL53L9 extends range to 5 m while scanning 9 zones, replacing 2 earlier lidar chips and trimming automotive cabin bills of materials by 30%. Industrial robotics also leans on active depth for millimeter-grade bin-picking accuracy, while fusing the stream with passive long-wave emissivity increases object identification accuracy by 18% in cluttered warehouses.
While passive infrared technology continues to dominate applications such as coin-cell-powered motion triggers and smart lighting due to its efficiency and reliability, the active segment is experiencing significant growth. This expansion is driven by increasing regulatory requirements for real-time occupancy classification in vehicles and buildings, which demand advanced sensing capabilities. As a result, the active branch is carving a prominent position within the evolving narrative of the infrared sensor market.
By Application: Precision Agriculture Emerges as Fastest Riser
Security and surveillance led with 33.46% revenue in 2025, but growth is leveling off as low-light-visible cameras cannibalize urban deployments. In contrast, precision agriculture and livestock monitoring are growing at an 8.47% CAGR. Drone-mounted thermal maps cut vineyard irrigation water use by 22% while boosting yields by 15% in one 2024 field trial. Livestock managers use hoof-temperature gradients to flag lameness days earlier than visual checks, increasing conception rates up to 18%.
Beyond its traditional focus on security, the infrared sensor market is expanding, driven by diverse applications. Hospitals are using non-contact fever screens for infection control, while oil and gas operators, responding to EPA methane regulations, are implementing continuous emissions monitors. Additionally, applications like continuous thermometry, gas-leak detection, and online spectroscopy are further boosting this market's growth.
By End-user Industry: Healthcare Delivers Outlier Growth
Aerospace and defense absorbed 28.91% of spending in 2025, yet budget ceilings and export paperwork keep growth near the market average. Healthcare rises fastest at an 8.43% CAGR, propelled by FDA-cleared wearable thermometers that log core body temperature every 15 minutes. A 2024 Journal of Medical Devices paper showed that infrared extremity scans can spot diabetic neuropathy with 89% sensitivity, outperforming tactile monofilament tests.
While commercial buildings, automotive, manufacturing, and oil and gas sectors bolster baseline demand for infrared sensors, the introduction of reimbursement codes for remote patient monitoring has emerged as a key driver of growth. This shift is significantly benefiting hospitals, clinics, and home-care suppliers, as these entities increasingly adopt infrared sensor technologies to enhance patient care and monitoring capabilities within the broader infrared sensor industry.
Geography Analysis
Asia Pacific retained the largest share of the infrared sensor market at 35.87% of global revenue in 2025, supported by China’s estimated 45% share of worldwide microbolometer output and Japan’s edge in thermopile packaging. Momentum continues as India’s Production-Linked Incentive program draws assembly investments from Murata, STMicroelectronics, and Honeywell, edging the sub-region toward an alternative supply hub. Regional automakers are also implementing thermal night-vision modules to comply with European safety regulations for export vehicles, while Korean smartphone brands are testing short-wave sensors for food-quality apps. These dynamics suggest steady mid-single-digit growth through 2031 even as security and building-automation deployments begin to saturate mature urban centers.
Africa is the fastest-growing territory, forecast to post an 8.22% CAGR to 2031 as mines, farms, and utilities adopt low-cost thermal nodes. South African platinum and gold operators now install continuous methane monitors that trim ventilation energy by 35% and cut regulatory fines, lifting the infrared sensor market size for gas-detection gear across the continent. Drone-based thermal mapping in Kenyan and Nigerian smallholder maize fields has improved yields 18% while conserving scarce irrigation water. Falling module prices below USD 1,000 make these solutions economically viable for resource-constrained cooperatives, accelerating adoption beyond early pilots. Public-private grants from regional development banks further de-risk initial capital outlays for small farms and municipal utilities.
North America and Europe account for a combined third of global revenue and remain the innovation hubs for quantum cascade detectors, colloidal-quantum-dot imagers, and neuromorphic signal processing. Defense budgets and critical-infrastructure upgrades sustain baseline demand, yet overall growth tracks slightly below the global average as first-generation perimeter-security networks reach replacement cycles rather than fresh buildouts. Oil and gas operators in the Middle East are expanding drone-mounted thermal surveillance to meet flare-reduction pledges; Saudi Aramco alone deployed more than 200 leak-detection flights in 2025, signaling a broader pivot toward continuous emissions monitoring. Meanwhile, European Union funding for Horizon-style research keeps the region at the forefront of mid-wave material breakthroughs, even as commercial rollouts lag those in the Asia Pacific in unit volume. Together, these mature markets provide the R&D ecosystem and regulatory frameworks that seed next-generation products for worldwide diffusion.

Regulatory Landscape
Export controls and defense procurement rules continue to influence infrared sensor product design, sourcing, and go-to-market, especially for long-wave and higher-performance thermal imaging. In February 2026, the US Department of Commerce Bureau of Industry and Security (BIS) issued a final order imposing a USD 1 million civil penalty on Teledyne FLIR for Export Administration Regulations (EAR) violations involving unlicensed exports of thermal imaging cameras (including ECCN 6A003 and 6A993.a) to China and Hong Kong, which tightens licensing scrutiny and internal compliance expectations for OEMs and distributors.
On the demand side, safety and building standards are also raising performance and qualification expectations for sensors embedded into regulated systems. The FY2026 US NDAA (enacted December 18, 2025) includes provisions directing the US Department of Defense to reduce reliance on optical glass and infrared systems sourced from covered nations by January 1, 2030, increasing the emphasis on supply-chain provenance documentation and alternative sourcing. Standards updates such as IEC 61496-3:2025 (active opto-electronic protective devices), EN IEC 60730-2-23:2025 (safety and performance for sensor elements), and ISO/FDIS 7240-33:2026 (thermal imaging fire detectors) further raise the focus on validated performance, cybersecurity readiness, and traceability for sensors sold into industrial automation and building safety applications, while China-specific requirements such as T/CAEE 039-2026 add another compliance layer for manufacturing and domestic deployments.
Value Chain Analysis
The infrared sensor value chain runs from material and substrate supply (including compound semiconductor and specialty inputs), to wafer fabrication and ROIC design, detector fabrication (microbolometers, thermopiles, InGaAs, and emerging quantum-dot stacks), and then downstream packaging, calibration, and module integration into cameras, ToF systems, and embedded endpoints. At the system layer, OEMs and integrators serve ADAS and interior sensing, industrial automation and predictive maintenance, building safety and smart home, security and surveillance, and medical devices, where firmware and edge-processing increasingly shape performance.
Bottlenecks stay concentrated in specialized materials and higher-performance manufacturing steps, especially access to InGaAs epitaxial wafers, ROIC capacity, and packaging yields for higher-resolution uncooled formats. Industry activity shows efforts to reduce these constraints and take more of the stack in-house: LightPath Technologies completed the acquisition of G5 Infrared in February 2025 to deepen optics and thermal imaging integration; Obsidian Sensors initiated a manufacturing partnership with Japan Display Incorporated in December 2024 to expand microbolometer production toward high-resolution formats; and TriEye and LITEON announced an August 2025 partnership around VCSEL-powered SWIR sensing solutions to accelerate commercialization into robotics and consumer electronics. In defense-adjacent supply chains, export-control restrictions and sourcing rules also affect supplier qualification, test documentation, and geographic manufacturing choices for higher-performance infrared components.
Competitive Landscape
The infrared sensor market remains moderately concentrated, with the top five suppliers, Murata Manufacturing, STMicroelectronics, Teledyne Imaging, Honeywell International, and Texas Instruments, collectively holding about 42% of 2025 revenue. This share leaves more than half the market distributed among regional specialists and application-focused newcomers, so no single brand exercises overwhelming pricing power. Incumbents still enjoy scale advantages in wafer procurement, package assembly, and global distribution networks, but customer willingness to qualify alternate vendors has increased as supply-chain shocks and export controls highlight the value of dual sourcing. The competitive dynamic, therefore, balances cost leadership by large players with rapid niche innovation by smaller firms.
Established manufacturers are channeling capital into wafer-level packaging and heterogeneous integration to compress their bills of materials and defend margins. STMicroelectronics moved a silver-telluride colloidal-quantum-dot short-wave sensor into volume production in March 2025, pricing the module below USD 5 and integrating the readout and analog front end on a single die to eliminate several downstream assembly steps. Teledyne FLIR refreshed its Boson+ family with a 12-micrometer long-wave core that consumes under 40 mW, enabling side-mirror placement without exceeding the thermal budget of passenger vehicles. Hamamatsu Photonics filed 14 quantum-cascade-detector patents in 2024, focused on hybrid germanium-on-silicon waveguides, signaling a strategic push to unlock room-temperature mid-wave performance for handheld gas analyzers. These moves illustrate how scale vendors are leveraging both process engineering and intellectual-property portfolios to widen technology moats even as price ceilings fall.
Smaller contenders exploit opportunities in underserved verticals and emerging materials. SENBA Sensing Technology and Nippon Ceramic leverage low-cost thermopile fabrication to win consumer Internet-of-Things sockets where unit economics trump absolute sensitivity. Venture-backed start-ups in Europe and North America commercialize neuromorphic readouts that execute microwatt-level inference on the pixel plane, a capability attractive to healthcare wearables and battery-powered building sensors. White space also persists in application software: precision-agriculture analytics and continuous-monitoring platforms still lag the installed base of thermal cameras, giving independent software vendors a pathway to recurring revenue even without proprietary hardware. Compliance credentials IEC 62381 for gas detectors, ISO 7240 for fire alarms, and IEC 62443 for cybersecurity are now table stakes, so differentiation increasingly hinges on edge intelligence, power efficiency, and seamless integration into broader automation stacks.
Infrared Sensor Industry Leaders
Murata Manufacturing Co. Ltd
STMicroelectronics NV
Excelitas Technologies Corp.
Teledyne Imaging Inc.
Mitsubishi Electric Corporation
- *Disclaimer: Major Players sorted in no particular order

Market Opportunities and Future Outlook
Near-term whitespace clusters where capacity, qualification, and bill-of-material reductions line up with regulated or mission-critical demand. Defense and counter-drone procurement is becoming an investment catalyst for cooled and higher-performance thermal platforms: in May 2026, Exosens announced plans to double cooled infrared camera production capacity during 2026, and in June 2026, LYNRED expanded industrial operations through its CAMPUS project, stating a EUR 100 million investment that doubles cleanroom space to 8,000 square meters and lifts bolometer capacity to one million units. Together, these actions create an opportunity for module makers and integrators to secure supply, shorten lead times, and offer multi-source programs for surveillance, perimeter security, and unmanned-system payloads.
A second opportunity is tied to reshoring and allied-nation sourcing for defense and critical infrastructure supply chains, where traceability and domestic manufacturing footprints affect award eligibility and risk profiles. VIGO Photonics finalized an acquisition of assets from US-based InfraRed Associates in March 2026 to expand US production capacity and align with defense supply requirements, reinforcing demand for qualified, local supply of detectors and assemblies. Alongside these industrial steps, progress on chip-scale infrared sensing, including July 2026 work reported by MIT on a tiny infrared chip aimed at improved gas and heat detection, supports product roadmaps focused on smaller form factors, lower power, and tighter integration into edge-AI systems. This direction aligns with the report scope around on-device inference and ultra-low-power deployments.
Recent Industry Developments
- June 2026: STMicroelectronics unveiled a compact direct Time-of-Flight (dToF) 3D LiDAR all-in-one module and stated it entered mass production in early July 2026. The launch targets edge-AI and space-constrained systems that need higher-resolution depth sensing without a large compute or power penalty. This supports broader adoption of active infrared sensing beyond premium platforms.
- January 2026: Teledyne FLIR OEM debuted Tura, an automotive-qualified LWIR thermal camera positioned for ADAS and autonomous vehicle sensing and developed in alignment with ISO 26262 functional safety practices (ASIL-B). Automotive-grade thermal cameras reduce qualification friction for OEM programs that require documented safety processes and long lifecycle support. This strengthens thermal imaging as a night-vision modality in safety-critical perception stacks.
- September 2025: Murata Manufacturing launched the IRS-D200ST00R1 digital-output SMD pyroelectric infrared sensor for low-power IoT applications. With ultra-low standby power positioning for battery-powered endpoints, the product supports higher unit volumes in smart-home and building automation designs that rely on always-on presence and motion detection.


Research Methodology Framework and Report Scope
Market Definition and Coverage
For this study, the market covers revenues earned from infrared sensors used to detect infrared radiation for sensing tasks such as motion, temperature, gas and flame detection, and spectroscopy across end-user industries and regions.
Scope exclusions: We exclude complete infrared cameras and imaging systems sold as finished equipment when the value cannot be cleanly separated into the sensor component.
Segmentation Overview
- By Wavelength Band
- Short-wave Infrared (SWIR)
- Mid-wave Infrared (MWIR)
- Long-wave Infrared (LWIR)
- By Technology
- Cooled Detectors
- Uncooled Detectors
- By Working Mechanism
- Active
- Passive
- By Application
- Motion Sensing
- Temperature Measurement
- Security and Surveillance
- Gas and Fire Detection
- Spectroscopy
- Precision Agriculture and Livestock Monitoring
- By End-user Industry
- Healthcare
- Aerospace and Defense
- Automotive
- Commercial Buildings and Smart Home
- Manufacturing and Industrial Automation
- Oil and Gas
- By Geography
- North America
- United States
- Canada
- Mexico
- South America
- Brazil
- Argentina
- Rest of South America
- Europe
- Germany
- United Kingdom
- France
- Italy
- Spain
- Rest of Europe
- Asia Pacific
- China
- Japan
- India
- South Korea
- ASEAN
- Rest of Asia Pacific
- Middle East and Africa
- Middle East
- United Arab Emirates
- Saudi Arabia
- Turkey
- Rest of Middle East
- Africa
- South Africa
- Egypt
- Rest of Africa
- Middle East
- North America
Data Sources, Market Sizing, and Validation
Desk Research
Desk work starts with building a clean fact base on demand signals and supply context for infrared sensing. We rely on public and official references such as US and international trade statistics portals for import and export trends, standards and safety bodies that publish sensor related guidance, and energy and building statistics from government agencies that reflect adoption in smart buildings and industrial sites.
To keep assumptions grounded, we also review company annual reports, investor presentations, product catalogs, and reputable press coverage that discuss shipments, pricing direction, and new design wins. A paid subscription for company financials and intelligence is used selectively to normalize revenue splits and to avoid mixing sensor value with broader module or system revenue. These examples are illustrative only, and other sources were checked for data collection, validation, and clarification during the work.
Primary Interviews and Surveys
Primary inputs are collected through expert interviews and structured surveys with sensor makers, module integrators, distributors, and large end users in areas such as automotive, aerospace and defense, industrial automation, healthcare, and smart buildings. Since this is a global market, we spread discussions across APAC, EMEA, and the Americas so pricing, mix, and adoption differences are captured, and then we use those outputs to confirm the model outputs and fill gaps left by public data.
Distribution of primary research fieldwork respondents
| Company type | Respondent position | Region |
|---|---|---|
| Top tier: 31% | CXOs: 15% | APAC: 44% |
| Mid tier: 48% | Functional/Unit leaders: 39% | EMEA: 34% |
| Smaller Players: 21% | Managers: 46% | Americas: 22% |
Market-Sizing & Forecasting
Sizing is built using a top-down approach where end-use demand pools are reconstructed from adoption indicators, then filtered by infrared sensor penetration and typical replacement cycles. To keep the numbers realistic, we corroborate totals with selective bottom-up approximations, such as sampled unit volumes times average selling prices (ASPs) for key applications, followed by channel checks that explain outliers.
Inputs are selected to match how this market behaves in the real world. Our model tracks factors such as sensor mix shifts between SWIR, MWIR, and LWIR bands, cooled versus uncooled adoption, the share of active versus passive sensing in major applications, ASP movement as volumes scale, and end-user demand swings in automotive safety, industrial automation, and smart building deployments. Where data is patchy for smaller regions or niche applications, ranges are built from interview feedback and then tightened using the most consistent public signals.
Forecasting is run through scenario analysis supported by trend-backed assumptions from experts, then stress tested against macro indicators that influence electronics demand and industrial spending. Once the final trajectory is formed, the main clause comes at the end, since the assumptions, checks, and adjustments must align first.
Data Validation & Update Cycle
Validation is done in layers so the final number does not depend on a single data stream. We compare outputs against independent signals such as regional demand patterns, application level adoption trends, and the implied ASP and volume relationship, then investigate any sharp jumps before internal sign-off.
A second analyst review is performed to re-check formulas, unit conversions, and year alignment, and targeted re-contacts are triggered when interview inputs disagree with desk indicators by a meaningful margin. Reports are refreshed annually, and interim updates are made when material events occur in supply, pricing, or regulation. Before delivery, a fresh review pass is completed so clients receive the most current view.
Mordor Intelligence's Infrared Sensor Market Size Versus Other Published Estimates
Published market values for infrared sensors do not always line up because scope boundaries and year definitions vary by publisher, and pricing and mix assumptions are not always stated clearly. Differences also show up when one estimate counts adjacent product value, or when currency timing and refresh cadence are not consistent.
The key gap drivers here are usually about what is counted as a sensor versus a module or a full imaging product, how cooled and uncooled devices are treated across applications, and whether the estimate is anchored to a stated base year or to an average of multiple years. When ASP progression is assumed to fall quickly, or when aggressive adoption curves are applied to automotive safety and smart building use cases, the totals can move up fast even if unit growth is steady.
Benchmark comparison
| Source | Market Size | Gaps in Research Methodology |
|---|---|---|
| Mordor Intelligence | USD 1.22 B (2026) | |
| Global Consultancy A | USD 1.26 B (2026) | Uses a broader sensor definition that can blend sensor and module value in some end uses, which tends to lift the starting value when application bundles are priced together. |
| Research House B | USD 1.17 B (2024) | Uses an earlier base year and applies a higher headline CAGR over a longer window, with fewer visible checks on cooled versus uncooled mix and the resulting ASP path. |
The table shows that the spread is driven as much by year choice as by scope, and in Mordor Intelligence's model the value is counted at the sensor level across the stated wavelength and technology categories, rather than folding in full system pricing when it cannot be separated cleanly. Once year alignment, currency timing, and the sensor versus module split are made consistent, the remaining differences are usually explained by mix and ASP assumptions that can be reviewed and repeated.


Key Questions Answered in the Report
How fast is revenue growing for infrared thermal cameras in agriculture?
Precision-agriculture use cases are projected to advance at an 8.47% CAGR through 2031, making them the fastest-rising application bucket.
Which technology holds the lion’s share of detector shipments today?
Uncooled microbolometer and thermopile arrays represent 64.51% of 2025 shipments, reflecting their low power draw and cost advantage.
Why are automotive suppliers adding thermal imaging to ADAS stacks?
Thermal cameras meet new EU pedestrian-detection rules by spotting people and animals in zero-lux fog or rain, reducing false-positive braking by 62% when fused with radar.
What constrains adoption of cooled mid-wave infrared sensors?
System prices above USD 10,000 and cryogenic coolers that draw 5-10 W keep cooled arrays confined to defense, aerospace, and high-end inspection.
Which region will outpace global growth to 2031?
Africa is forecast to climb 8.22% CAGR as mines adopt gas-leak monitors and smallholder farmers deploy drone-based thermal irrigation mapping.
Are supply-chain risks easing for telluride-based detectors?
Not yet; China still controls about 70% of tellurium refining, and export quotas raised spot prices to USD 85 /kg in 2025, sustaining procurement volatility.
Page last updated on:


