Quantum Photonics Market Size and Share
Market Overview
| Study Period | 2019 - 2030 |
|---|---|
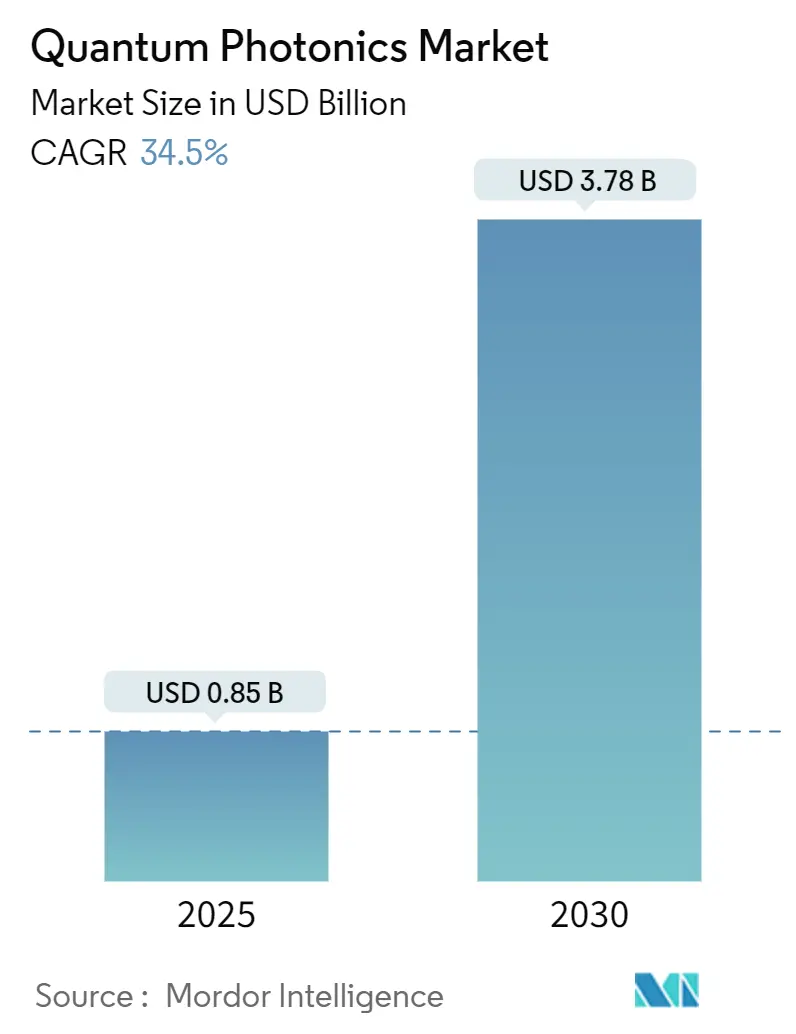
| Market Size (2025) | USD 0.85 Billion |
| Market Size (2030) | USD 3.78 Billion |
| Growth Rate (2025 - 2030) | 34.50% CAGR |
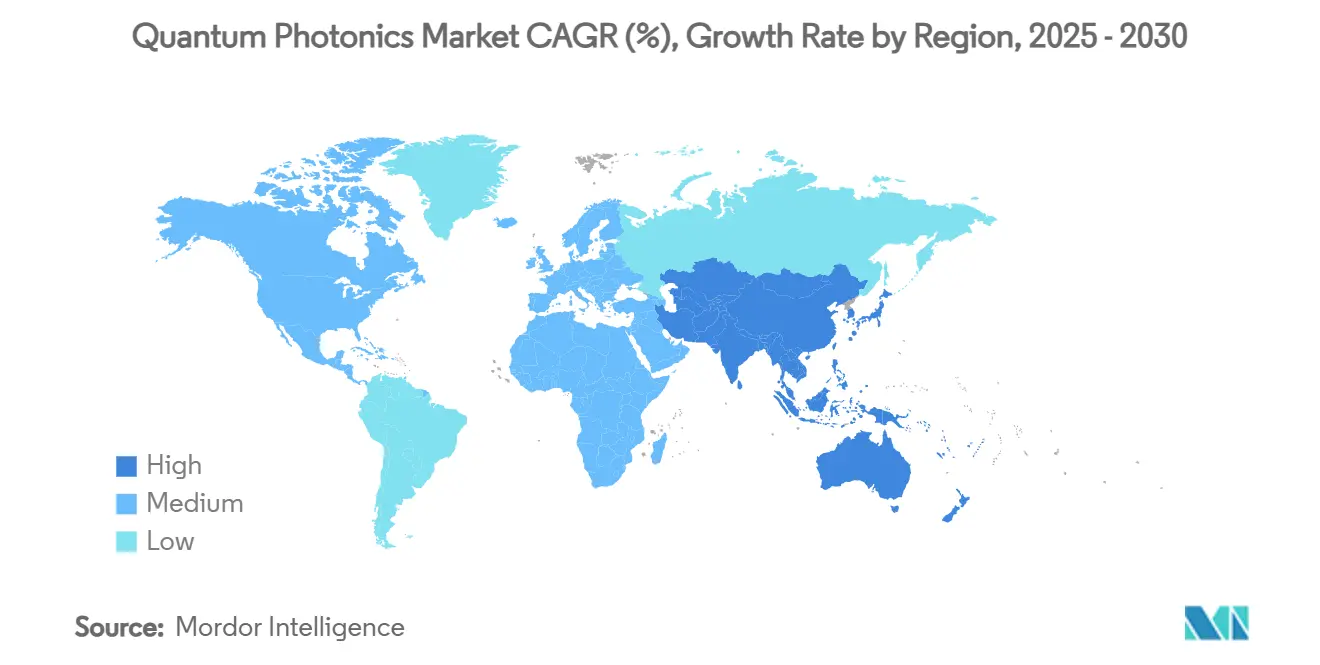
| Fastest Growing Market | North America |
| Largest Market | Asia Pacific |
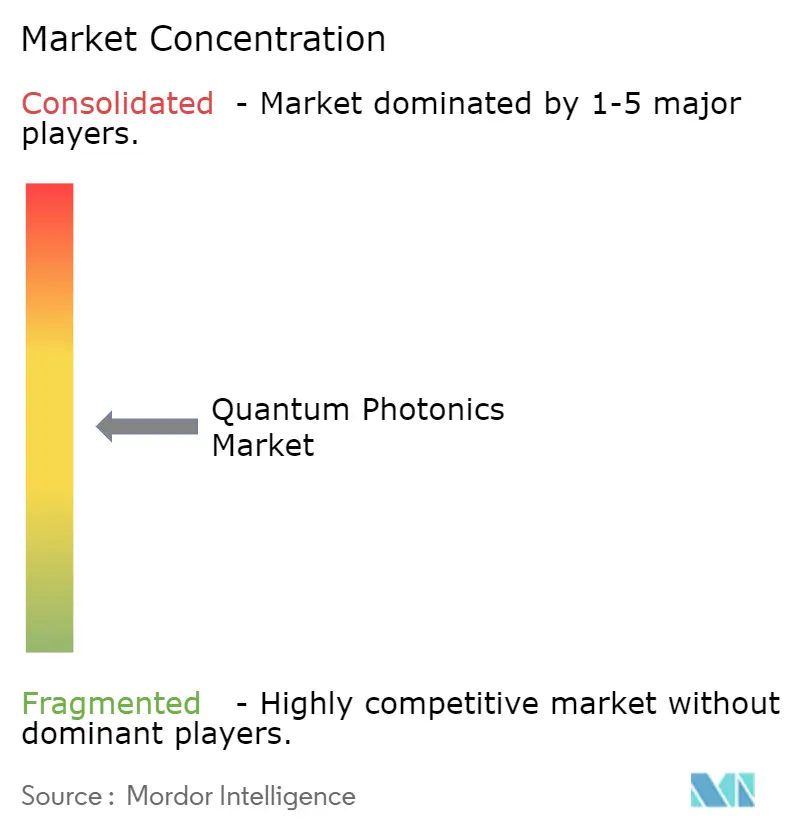
| Market Concentration | Medium |
Major Players *Disclaimer: Major Players sorted in no particular order Image © Mordor Intelligence. Reuse requires attribution under CC BY 4.0. | |
Quantum Photonics Market Analysis by Mordor Intelligence
The quantum photonics market size stood at USD 0.85 billion in 2025 and is forecast to reach USD 3.78 billion by 2030, advancing at a 34.5% CAGR. Government mega-funding, foundry-grade photonic integrated-circuit (PIC) capacity, and sub-10 mW power envelopes collectively reshape the commercial narrative from laboratory prototypes to million-qubit roadmaps. Defense-driven procurement in North America, sovereign cryptography programs in the Asia-Pacific, and data-center optical-I/O constraints worldwide accelerate adoption, while export-control regimes and single-photon-source limitations temper near-term scaling. Pure-play startups secure design wins through technical differentiation, whereas semiconductor incumbents leverage volume fabrication and supply-chain reach to defend share. Venture capital follows the manufacturing shift, redirecting resources from proof-of-concept demonstrations to wafer-scale pilot lines. These dynamics position the quantum photonics market for sustained double-digit expansion as technical and geopolitical priorities align.
Key Report Takeaways
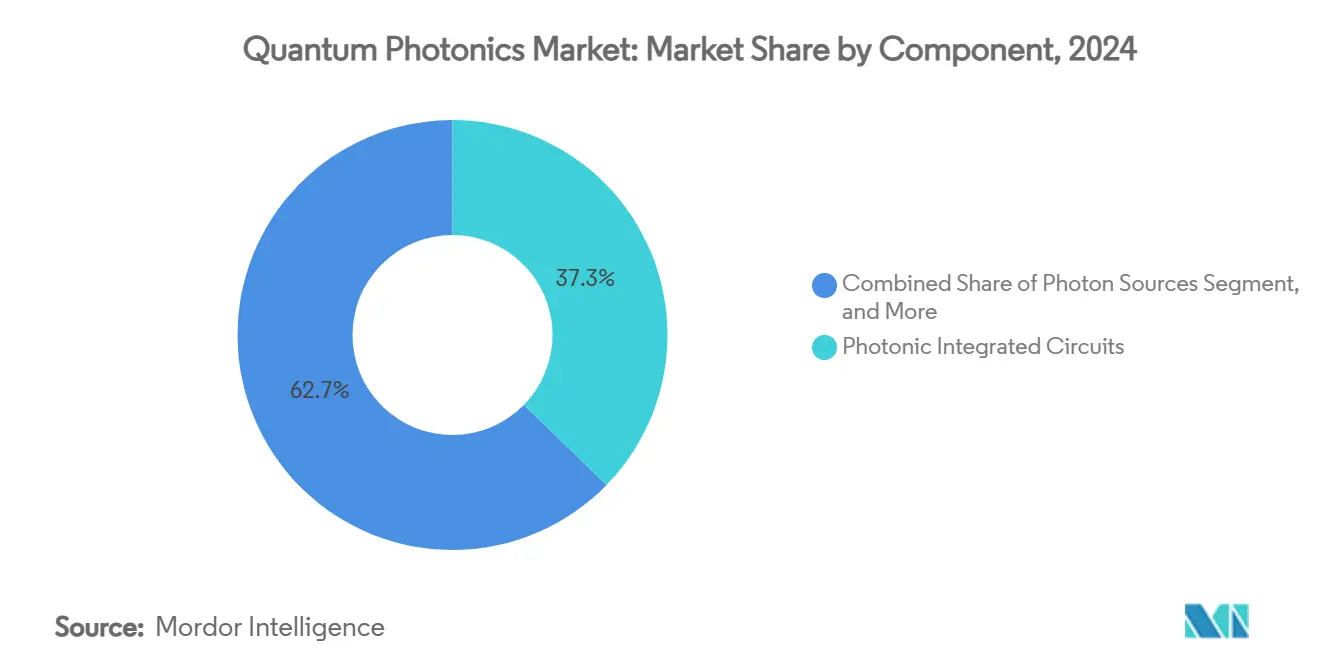
- By component, photonic integrated circuits held 37.3% of the quantum photonics market share in 2024, whereas SNSPD detectors are poised to compound at a 36.3% CAGR to 2030.
- By application, quantum computing led with 46.23% revenue share in 2024; quantum communication is projected to expand at a 34.89% CAGR through 2030.
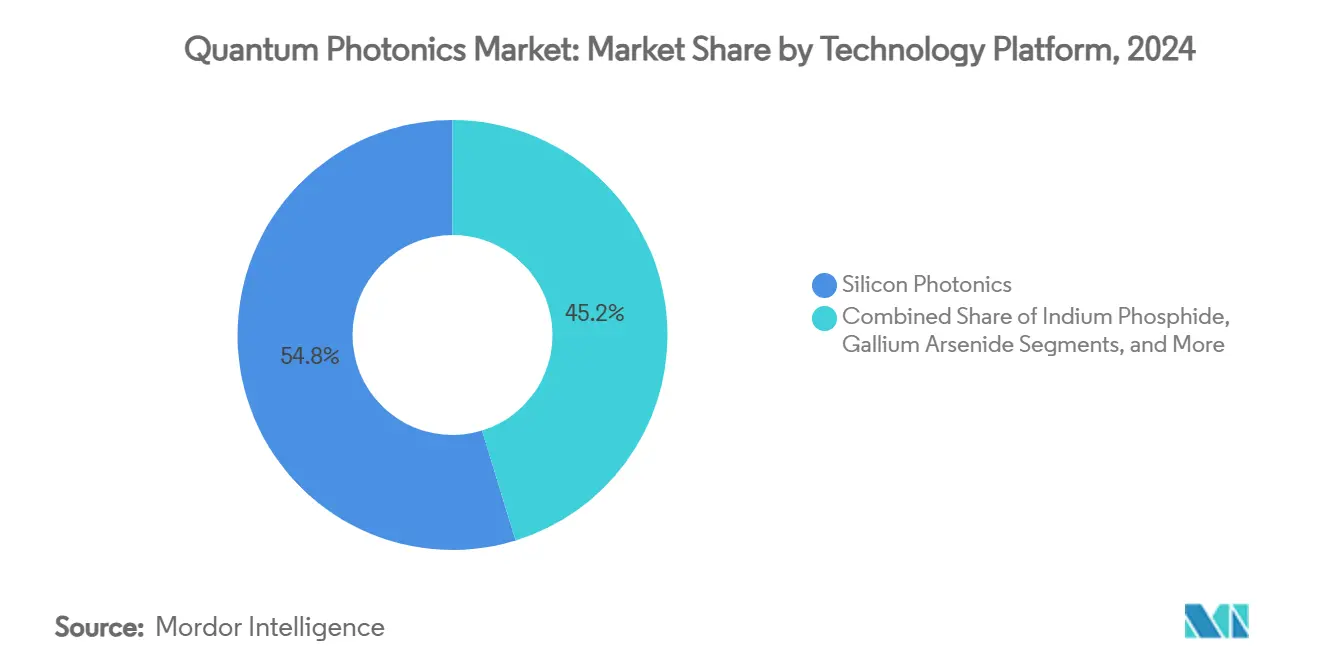
- By technology platform, silicon photonics accounted for 54.76% of the quantum photonics market size in 2024, while thin-film lithium niobate PICs are growing at a 35.34% CAGR to 2030.
- By end-user industry, government and defense commanded 32.89% share in 2024, yet telecom and data-center operators are forecast to register the highest 35.89% CAGR through 2030.
- By geography, North America retained 38% share in 2024; Asia Pacific shows the fastest 35.69% CAGR thanks to multi-billion-dollar national programs.
Global Quantum Photonics Market Trends and Insights
Drivers Impact Analysis*
| Driver | (~) % Impact on CAGR Forecast | Geographic Relevance | Impact Timeline |
|---|---|---|---|
| Rapid progress in photonic-integrated-circuit (PIC) volumes | +8.2% | Global (early gains in North America, Europe) | Medium term (2–4 years) |
| Government mega-funding for quantum-secure networks | +7.8% | North America and EU, APAC core | Long term (≥ 4 years) |
| Data-center optical I/O bottleneck relief needs | +6.4% | Global (hyperscale regions) | Short term (≤ 2 years) |
| Telecom adoption of quantum-key-distribution backbones | +5.9% | Europe and APAC | Medium term (2–4 years) |
| Sub-10 mW cryo-CMOS control chips for photonic qubits | +4.7% | North America and EU fabs | Long term (≥ 4 years) |
| Venture-capital shift to foundry-grade quantum photonics | +3.8% | North America, Europe, select APAC hubs | Medium term (2–4 years) |
| Source: Mordor Intelligence | |||
Rapid Progress in Photonic-Integrated-Circuit (PIC) Volumes
Foundry-grade PIC lines now deliver custom quantum devices in months rather than years, collapsing prototyping cycles and enabling million-qubit roadmaps. Quantum Computing Inc.’s thin-film lithium niobate (TFLN) pilot logged four commercial orders during 2024, validating a pay-per-lot model that mirrors mature semiconductor supply chains.[1]Matt Swayne, “Japan Boosts Semiconductor, Quantum R&D with Trillion-Yen Budget,” The Quantum Insider, thequantuminsider.com PsiQuantum’s tie-up with GlobalFoundries extends the same model to CMOS-compatible photonic qubits, demonstrating that scale economics, not laboratory performance, increasingly dictate competitiveness.[2]Alex Mack, “GlobalFoundries and PsiQuantum Partner on Full-Scale Quantum Computer,” psiquantum.com As PIC yields rise, cost-per-qubit curves steepen downward, catalyzing broader quantum photonics market adoption.
Government Mega-Funding for Quantum-Secure Networks
Sovereign budgets topping USD 50 billion across 2024-2025 anchor demand regardless of private-sector sentiment. Japan’s trillion-yen envelope earmarks photonics as strategic infrastructure, while the EUR 5.7 billion Quantum Flagship funnels grants toward EuroQCI backbone deployments. Korea’s 49.1 billion KRW program underscores regional momentum that helps the Asia Pacific close the share gap with North America.[3]“Korea 2025 Quantum Projects,” zdnet.co.kr These programs absorb technical risk, finance multi-year roadmaps, and create guaranteed off-take for emergent vendors, thereby underpinning the quantum photonics market.
Data-Center Optical I/O Bottleneck Relief Needs
Hyperscale operators confront an electrical-interconnect ceiling that optical chiplets can breach. Intel and NTT co-develop optical compute interconnects targeting AI accelerators that already consume 40-50% of rack power budgets. Chip-scale quantum photonic processors run under 10 mW, a two-order-of-magnitude reduction versus copper traces, releasing thermal headroom and extending Moore’s Law at the system level. Reliability criteria, though, exceed today’s quantum photonics devices, forcing vendors to harden packaging and control electronics for 24/7 data-center duty cycles.
Telecom Adoption of Quantum-Key-Distribution Backbones
Operators in Canada, Germany, Finland, and Korea now integrate quantum key distribution (QKD) into live networks rather than pilot loops. TELUS rides its national fiber footprint to embed quantum photonic repeaters that monetize “premium secure channels” at higher margins than commodity bandwidth. Orange’s 254 km Berlin link and Madrid’s QCI corridor echo the shift from R&D showcase to carrier-grade service. As NIST post-quantum cryptography deadlines loom, QKD revenues provide the first large-scale, non-defense cash inflows for the quantum photonics market.
Restraints Impact Analysis*
| Restraint | (~) % Impact on CAGR Forecast | Geographic Relevance | Impact Timeline |
|---|---|---|---|
| Shortage of low-loss on-chip single-photon sources | −4.2% | Global (acute in emerging markets) | Medium term (2–4 years) |
| Packaging yield issues beyond 200 mm silicon wafers | −3.8% | Advanced semiconductor regions | Short term (≤ 2 years) |
| Cryogenic-system capex for SNSPD detector farms | −2.9% | Global (research hubs) | Long term (≥ 4 years) |
| Export-control hurdles for entangled-photon components | −2.1% | US–China, EU–Russia corridors | Medium term (2–4 years) |
| Source: Mordor Intelligence | |||
Shortage of Low-Loss On-Chip Single-Photon Sources
Coupling efficiencies remain stuck at 60-70%, far below the 90% threshold needed for million-qubit fault tolerance. Diamond NV centers and silicon-carbide defects wander spectrally, eroding indistinguishability over operational lifetimes. Cryogenic quantum-dot cavities hit higher fidelity but forfeit room-temperature advantages prized by data centers. Until deterministic sources mature, designers over-build error-correction overhead, inflating cost and curbing early revenue for the quantum photonics market.
Export-Control Hurdles for Entangled-Photon Components
September 2024 BIS rulings introduced new ECCNs that obligate licensing for 28 destinations, shrinking addressable revenues for US suppliers. European and Asian firms thus capture restricted accounts, fragmenting global supply chains and slowing standards convergence. While protected domestic niches nurture indigenous R&D, compliance uncertainty delays multinational deployments and suppresses the overall quantum photonics market growth trajectory in the medium term.
*Our forecasts treat driver/restraint impacts as directional, not additive. The impact forecasts reflect baseline growth, mix effects, and variable interactions.
Segment Analysis
By Component: PICs Lead While SNSPD Detection Drives Growth
Photonic integrated circuits captured 37.3% of quantum photonics market share in 2024, reflecting their role as full-stack substrates that collapse system size and raise stability. SNSPD arrays, though just 18.4% of 2024 revenue, expand at 36.3% CAGR as detection efficiency, not photon creation, emerges as the performance chokepoint. The quantum photonics market size for PICs is on track to exceed USD 1.4 billion by 2030, while SNSPD revenues could breach USD 900 million over the same span. Transition-edge sensors and photomultiplier tubes lag in quantum efficiency, keeping SNSPDs dominant through the forecast horizon. Advanced waveguide couplers, cryo-CMOS control ASICs, and embryonic quantum memories occupy the “Other Components” pool that scales once detection yields mature.
Rapid detector ramp-up pushes fabrication toward 200 mm silicon and 150 mm TFLN lines, introducing packaging yield stress. Vendors respond by co-locating bonding, metrology, and cryostat assembly under one roof to cut optical-alignment loss and compress cycle time, a move that tightens the quantum photonics market’s supply chain and favors vertically integrated players.


By Application: Quantum Computing Dominance Challenged by Communication Growth
Quantum computing retained 46.23% of 2024 revenue, yet quantum communication is closing the gap with a 34.89% CAGR on compliance-driven QKD rollouts. The quantum photonics market size for communication could top USD 1.3 billion by 2030, nearly matching computing’s USD 1.5 billion projection. Sensing and metrology carve niche demand in defense and energy, while quantum imaging generates early adoption in life sciences, endoscopy, and semiconductor inspection. Simulation and machine-learning workloads linger in R&D but gain credibility as photonic processors demonstrate coherent Ising-machine proofs-of-concept. The application mix, therefore, shifts from single-pillar to diversified revenue, buffering the quantum photonics market against delays in universal fault-tolerant computing.
By Technology Platform: Silicon Photonics Leads Despite LiNbO₃ Acceleration
Silicon Photonics maintains 54.76% technology platform share in 2024, leveraging the massive manufacturing infrastructure and cost advantages of the semiconductor industry that enable quantum photonic components to benefit from Moore's Law scaling economics. The platform's dominance reflects its compatibility with existing CMOS fabrication processes, which reduces development costs and accelerates time-to-market for quantum photonic systems. However, Thin-Film Lithium Niobate PICs exhibit 35.34% CAGR growth through 2030, indicating that performance requirements increasingly favor electro-optic modulation capabilities over manufacturing cost considerations. This growth differential suggests that high-performance quantum applications prioritize technical specifications over economic optimization.
By End-User Industry: Defense Leads While Telecom Accelerates
Telecom and Data Center operators drive 35.89% CAGR growth through 2030, significantly exceeding the Government and Defense sector's 32.89% market share in 2024, indicating that commercial quantum photonics adoption will ultimately surpass military applications in market size. This growth inversion reflects the commercial sector's ability to deploy quantum technologies at scale once technical performance thresholds are achieved, while defense applications remain constrained by procurement cycles and security clearance requirements. The telecom sector's adoption of quantum photonics stems from infrastructure upgrade cycles that can integrate quantum capabilities into existing fiber networks without requiring parallel buildouts.
Geography Analysis
North America commanded 38% of 2024 revenue on the back of defense outlays and hyperscale data-center pilots. Asia Pacific, however, posts the fastest 35.69% CAGR behind China’s USD 15 billion sovereign push, Japan’s trillion-yen integration agenda, and Korea’s fielded QKD links. The quantum photonics market size in the Asia Pacific is forecast to eclipse USD 1.4 billion by 2030, narrowing the gap to North America’s projected USD 1.5 billion.
Europe maintains steady double-digit growth via the EuroQCI backbone and Horizon funding streams, with Germany and France anchoring continental fabrication bases. Silicon photonics clusters in the Netherlands, Belgium, and the U.K. supply foundry shuttles for pan-EU startups, preserving strategic autonomy amid US-China tech bifurcation. Middle East and Africa and South America currently combine for under 5% of the quantum photonics market share, yet UAE- and Brazil-backed testbeds signal nascent adoption once cost thresholds slide.

Competitive Landscape
The vendor field remains moderately fragmented: the top five firms hold roughly 28% combined revenue, mapping to a market concentration score of 6. PsiQuantum, Xanadu, and Quandela advance photonic qubit counts through capital-efficient fab partnerships, while Intel, Cisco, and IBM hedge investments across superconducting and trapped-ion modalities. Consolidation accelerates as scale economics bite; IonQ’s move to acquire Lightsynq adds quantum memory IP to a formerly trapped-ion portfolio, foreshadowing cross-modality roll-ups.[4]IonQ, “Lightsynq Acquisition,” ionq.com
Strategic intent centers on three levers: (1) securing long-term foundry capacity, (2) demonstrating multi-rack system integration, and (3) locking regulatory clearances for export-controlled components. Recent alliances such as Nu Quantum’s Datacenter Alliance with Cisco and NTT Data validate ecosystem-level collaboration that derisks deployment for conservative enterprise buyers. Overall, differentiation tilts toward reliability engineering and supply-chain security rather than raw qubit counts, a pivot that rewards operational execution.
Quantum Photonics Industry Leaders
PsiQuantum Corp.
Xanadu Realty Limited
Quandela SAS
QuiX Quantum BV
ORCA Computing Limited
- *Disclaimer: Major Players sorted in no particular order

Recent Industry Developments
- May 2025: IonQ agreed to acquire Lightsynq, adding >20 quantum-memory patents to accelerate photonic interconnects and repeater chains
- April 2025: Xanadu secured a slot in DARPA’s Quantum Benchmarking Initiative, tasking its squeezed-light platform to meet utility-scale metrics by 2033.
- February 2025: Nu Quantum formed the Quantum Data Centre Alliance with Cisco, NTT Data, OQC, QphoX, Quantinuum, and QuEra to define interoperability milestones for distributed photonic architectures.
- January 2025: Quantum Computing Inc. landed two additional TFLN foundry orders from a European university and a Canadian PIC house, closing its pilot year with four commercial contracts


Global Quantum Photonics Market Report Scope
| Photon Sources |
| Single-Photon Detectors |
| Photonic Integrated Circuits |
| Waveguides and Couplers |
| Control and Readout Electronics |
| Other Components |
| Quantum Computing |
| Quantum Communication (QKD, QRNG, QInternet) |
| Quantum Sensing and Metrology |
| Quantum Imaging |
| Other Applications |
| Silicon Photonics |
| Indium Phosphide |
| Thin-Film Lithium Niobate |
| Diamond NV / SiC |
| Gallium Arsenide |
| Government and Defense |
| Telecom and Data-Center Operators |
| Financial Services |
| Healthcare and Life Sciences |
| Academia and Research |
| Other End-User Industries |
| North America |
| South America |
| Europe |
| Asia-Pacific |
| Middle East and Africa |
| By Component | Photon Sources |
| Single-Photon Detectors | |
| Photonic Integrated Circuits | |
| Waveguides and Couplers | |
| Control and Readout Electronics | |
| Other Components | |
| By Application | Quantum Computing |
| Quantum Communication (QKD, QRNG, QInternet) | |
| Quantum Sensing and Metrology | |
| Quantum Imaging | |
| Other Applications | |
| By Technology Platform | Silicon Photonics |
| Indium Phosphide | |
| Thin-Film Lithium Niobate | |
| Diamond NV / SiC | |
| Gallium Arsenide | |
| By End-User Industry | Government and Defense |
| Telecom and Data-Center Operators | |
| Financial Services | |
| Healthcare and Life Sciences | |
| Academia and Research | |
| Other End-User Industries | |
| By Geography | North America |
| South America | |
| Europe | |
| Asia-Pacific | |
| Middle East and Africa |


Key Questions Answered in the Report
How fast is the quantum photonics market expected to grow to 2030?
The quantum photonics market is projected to climb from USD 0.85 billion in 2025 to USD 3.78 billion by 2030 at a 34.5% CAGR.
Which region will post the highest growth through the forecast horizon?
Asia Pacific carries the fastest 35.69% CAGR, powered by multi-billion-dollar government programs across China, Japan, and Korea.
What application area is scaling revenue most rapidly?
Quantum communication, anchored by quantum key distribution rollouts, is increasing at a 34.89% CAGR and could rival computing revenue by 2030.
Which component segment records the strongest CAGR?
Superconducting nanowire single-photon detectors lead with 36.3% CAGR as detection fidelity supersedes photon generation as the prime bottleneck.
How dominant is silicon photonics across technology platforms?
Silicon photonics still represents 54.76% of 2024 revenue, yet thin-film lithium niobate PICs are eroding share with a 35.34% CAGR on performance grounds.
What restrains immediate mass adoption of quantum photonic systems?
Low-loss deterministic single-photon sources remain below 70% coupling efficiency, forcing costly error-correction overhead that delays commercial viability.
Page last updated on:


