Asia-Pacific Integrated GPU Market Size and Share
Market Overview
| Study Period | 2020 - 2031 |
|---|---|
| Forecast Data Period | 2026 - 2031 |
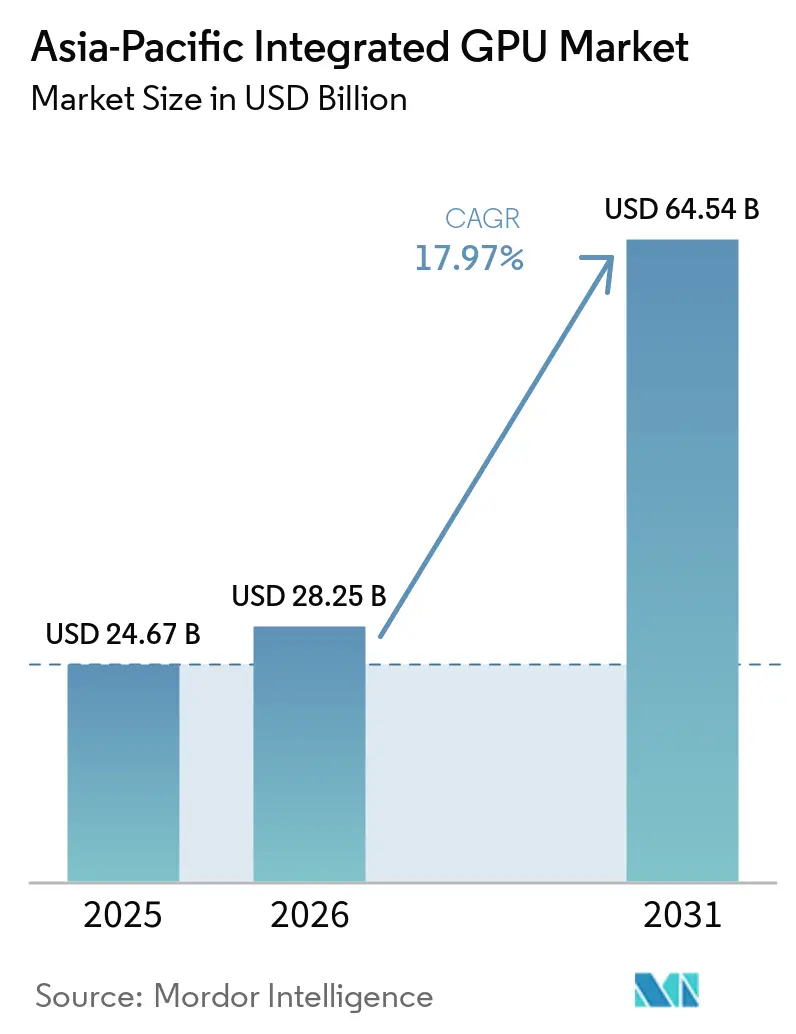
| Base Year Market Size (2025) | USD 24.67 Billion |
| Market Size (2026) | USD 28.25 Billion |
| Market Size (2031) | USD 64.54 Billion |
| Growth Rate (2026 - 2031) | 17.97% CAGR |
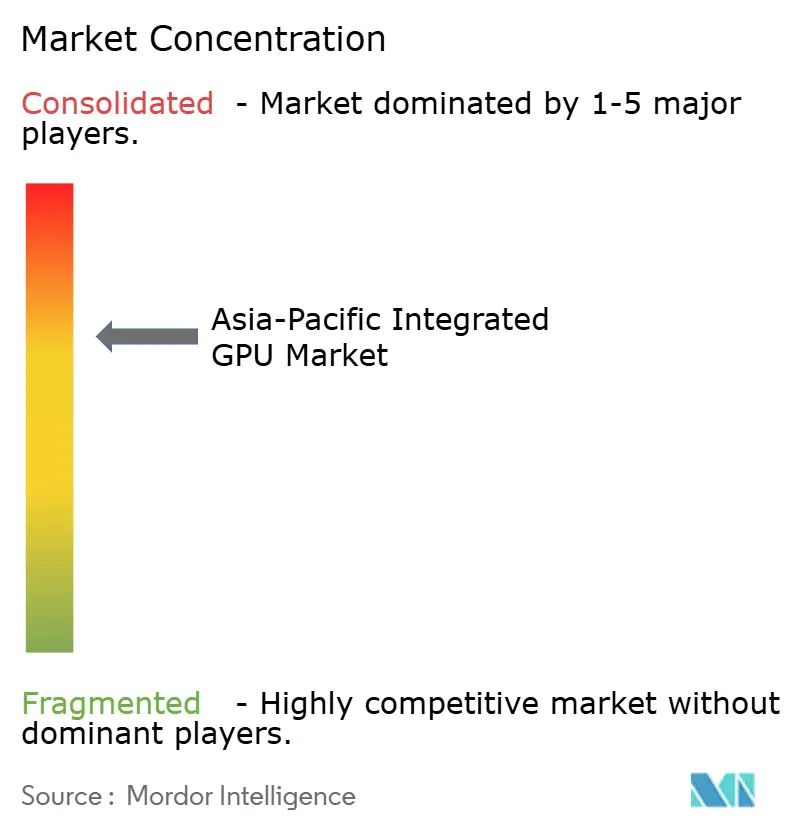
| Market Concentration | Medium |
Major Players *Disclaimer: Major Players sorted in no particular order Image © Mordor Intelligence. Reuse requires attribution under CC BY 4.0. | |
Asia-Pacific Integrated GPU Market Analysis by Mordor Intelligence
The Asia-Pacific integrated GPU market size is expected to grow from USD 24.67 billion in 2025 to USD 28.25 billion in 2026 and is forecast to reach USD 64.54 billion by 2031 at 17.97% CAGR over 2026-2031. The Asia-Pacific integrated GPU market is entering a period where commercial notebook replacement, sovereign AI programs, and semiconductor localization are reinforcing one another in the same buying cycle. Demand is being supported by the end of Windows 10 support, stronger use of on-device AI in smartphones and PCs, and rising interest in server processors with embedded graphics for edge inference. The role of integrated graphics is also changing, because buyers now evaluate iGPU capability not only for display and media functions, but also for AI workloads, gaming quality, and creator performance. Local assembly and packaging incentives, especially in India, are beginning to improve the economics of mid-range and performance-class SoCs across the regional device ecosystem. Competition remains moderate, with global platform vendors leading premium designs while domestic Chinese suppliers preserve scale in lower-cost and industrial categories, even as supply constraints and localization pressures continue to shape procurement decisions.
Key Report Takeaways
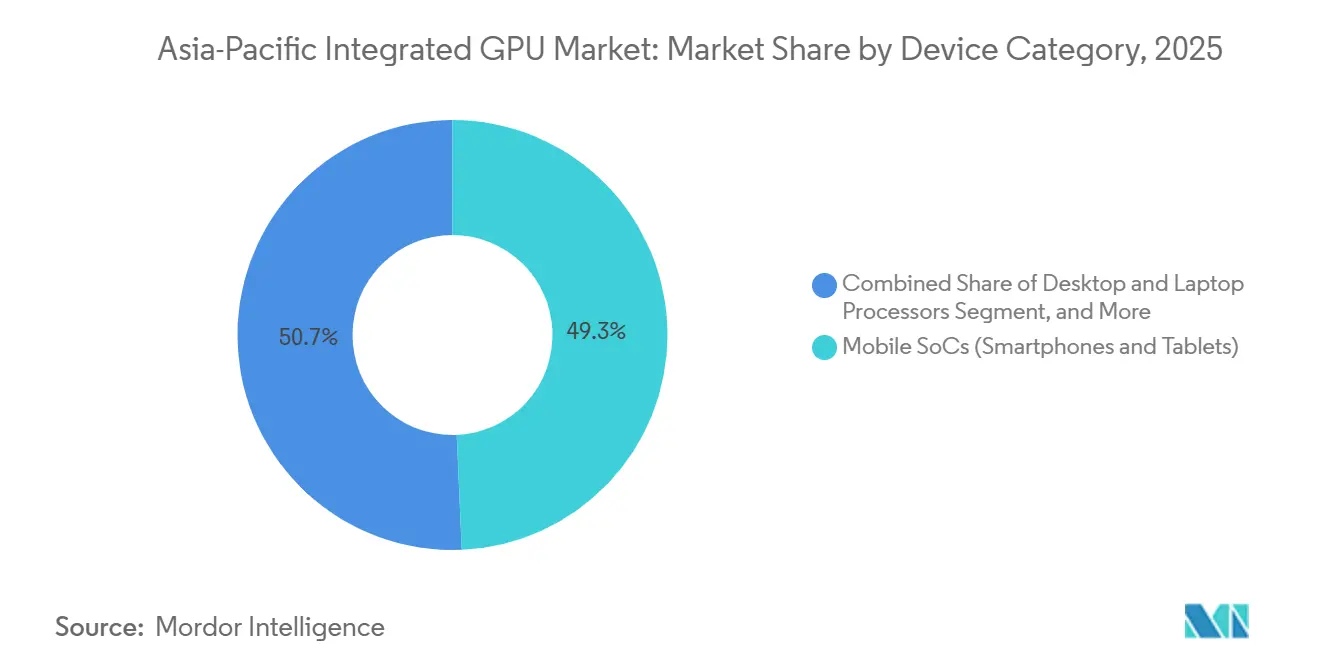
- By device category, mobile SoCs held 49.32% of the Asia-Pacific integrated GPU market revenue in 2025, while server and data center processors with integrated graphics are projected to expand at an 18.11% CAGR through 2031.
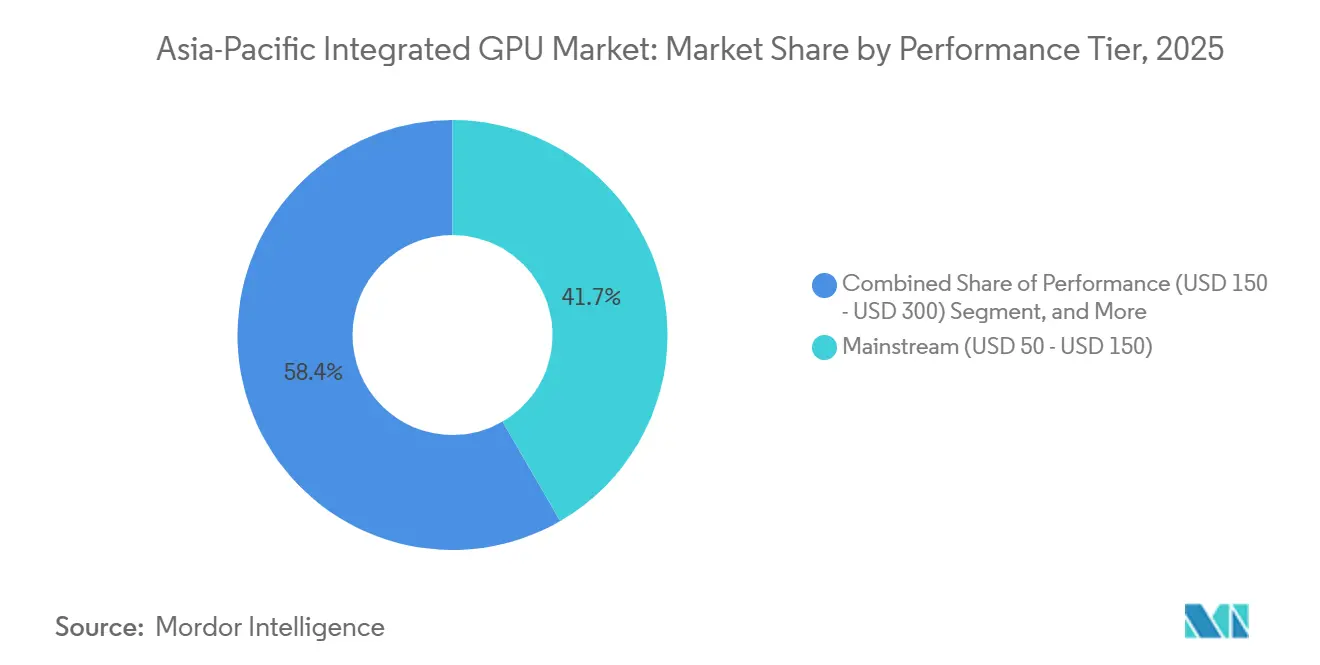
- By performance tier, Mainstream captured 41.65% of revenue in 2025, while the Performance tier is expected to grow at an 18.77% CAGR during 2026-2031.
- By geography, China held 49.45% of Asia-Pacific integrated GPU market share in 2025, while India is projected to expand at an 18.34% CAGR through 2031.
Note: Market size and forecast figures in this report are generated using Mordor Intelligence’s proprietary estimation framework, updated with the latest available data and insights as of January 2026.
Asia-Pacific Integrated GPU Market Trends and Insights
Drivers Impact Analysis*
| Driver | (~) % Impact on CAGR Forecast | Geographic Relevance | Impact Timeline |
|---|---|---|---|
| Windows 11 and AI PC Refresh Cycle in Commercial Notebooks | +3.2% | Japan, China, South Korea, India, Australia | Short term (≤ 2 years) |
| 5G Smartphone Premiumization and On-Device AI Graphics Demand | +2.8% | China, India, South Korea, Southeast Asia | Medium term (2-4 years) |
| Ray Tracing and Console-Class Mobile Gaming Migration | +2.2% | China, South Korea, Japan, Southeast Asia | Medium term (2-4 years) |
| Unified Memory Architectures Expand Creator-Class iGPU Workloads | +1.9% | Japan, South Korea, Australia, India | Long term (≥ 4 years) |
| Education Device Procurement in India and Southeast Asia | +1.4% | India, Indonesia, Vietnam, Philippines | Short term (≤ 2 years) |
| Local Assembly and Semiconductor Incentives Improve SoC Economics | +1.0% | India, China, Taiwan | Long term (≥ 4 years) |
| Source: Mordor Intelligence | |||
Windows 11 and AI PC Refresh Cycle in Commercial Notebooks
The Windows 10 support deadline became the clearest near-term trigger for the Asia-Pacific integrated GPU market in commercial PCs. Notebook replacement moved faster than in prior upgrade cycles because enterprise buyers had to align operating system migration with new AI-ready hardware specifications. HP said AI PC shipment mix increased from 35% to 44%, and the Windows 11 refresh cycle in APJ contributed a 2-3% commercial demand pull-forward, which shows that buyers were already moving toward higher-spec systems before the full migration wave had ended. Intel then reinforced that shift when it launched Core Ultra Series 3 in January 2026 with 180 TOPS of total platform AI compute, which turned the integrated graphics block into a practical AI workload enabler rather than a basic display component.[1]Intel Corporation, “CES 2026: Intel Core Ultra Series 3 Debuts as First Built on Intel 18A,” Intel Newsroom, intel.com As a result, the Asia-Pacific integrated GPU market is benefiting from a higher specification floor in commercial notebooks, especially in Japan, China, South Korea, India, and Australia.
5G Smartphone Premiumization and On-Device AI Graphics Demand
Smartphone graphics in the Asia-Pacific integrated GPU market are no longer being designed only for rendering and media playback. MediaTek said the Dimensity 9500 integrated the Arm G1-Ultra GPU with 33% higher peak performance and 42% better power efficiency than the prior generation, while also supporting 120fps ray-traced gaming.[2]MediaTek Inc., “MediaTek Dimensity 9500 Unleashes Best-in-Class Performance, AI Experiences, and Power Efficiency for the Next Generation of Mobile Devices,” MediaTek Press Room, mediatek.comMediaTek also described an agentic AI framework that distributes generative AI tasks across GPU shader resources and dedicated neural acceleration, which expands local AI capability beyond the flagship tier. This changes how handset makers position premium and upper mid-range devices, because graphics performance now supports gaming, AI responsiveness, and power efficiency at the same time. The Asia-Pacific integrated GPU market therefore gains from 5G-led premiumization in China, India, South Korea, and Southeast Asia, where stronger on-device AI capability is becoming a selling point in mainstream consumer upgrades.
Ray Tracing and Console-Class Mobile Gaming Migration
Ray tracing has become a practical upgrade lever in the Asia-Pacific integrated GPU market rather than a niche specification for a small number of premium phones. Arm said the Mali G1-Ultra introduced RTUv2 hardware that delivers 2x ray-tracing performance versus the previous generation, with support for more advanced lighting and visual effects in mobile games. MediaTek paired that direction with its latest flagship gaming stack, combining hardware ray tracing, better sustained performance, and game optimization features for newer Android devices. This matters because premium gaming features are now moving into lower price points through reuse of earlier flagship SoCs in mid-tier phones. That pattern supports the Asia-Pacific integrated GPU market by widening the installed base for advanced graphics features without waiting for premium device volumes alone to carry adoption.
Unified Memory Architectures Expand Creator-Class iGPU Workloads
Unified memory architecture is widening the addressable workload range for the Asia-Pacific integrated GPU market in creator systems and AI development devices. Apple said the M5 delivered more than 4x peak GPU compute versus M4 and raised unified memory bandwidth to 153GB/s, which improved AI and graphics performance in thinner devices that rely on integrated silicon. Apple extended that strategy in March 2026 with M5 Pro and M5 Max, scaling GPU cores up to 40 and unified memory up to 128GB for more demanding workflows. Intel took a related step when its 2026 Arc Pro driver update enabled Core Ultra H-series systems to allocate up to 93% of system memory to the iGPU, which materially improved local AI model handling on workstation-class notebooks. These changes are helping the Asia-Pacific integrated GPU market move further into creator, engineering, and AI developer workflows in Japan, South Korea, Australia, and India, where memory efficiency increasingly matters as much as raw graphics output.
Restraints Impact Analysis*
| Restraint | (~) % Impact on CAGR Forecast | Geographic Relevance | Impact Timeline |
|---|---|---|---|
| Advanced-Node Foundry Bottlenecks for Premium SoCs | -2.6% | Global, especially Taiwan and South Korea supply chains | Short term (≤ 2 years) |
| Slow Monetization of AI PC Use Cases in Price-Sensitive Segments | -2.0% | India, Indonesia, Vietnam, Philippines | Medium term (2-4 years) |
| Advanced Packaging Capacity Prioritizes AI Accelerators Over iGPUs | -1.5% | Global, TSMC Taiwan CoWoS facilities | Medium term (2-4 years) |
| China Export Controls and Localization Friction | -1.1% | China, spillover to broader Asia-Pacific supply chains | Long term (≥ 4 years) |
| Source: Mordor Intelligence | |||
Advanced-Node Foundry Bottlenecks for Premium SoCs
Advanced-node supply remains a real constraint for the Asia-Pacific integrated GPU market because the same leading-edge wafers are needed by top smartphone, PC, and AI compute programs. Premium SoC vendors therefore face a more rigid allocation environment, especially when the largest customers lock in early access and smaller challengers depend on shorter planning windows. This raises wafer and packaging costs, which then feeds into device pricing and narrows the flexibility of vendors trying to scale new performance-tier designs. It also slows competitive rotation, because foundry access starts to matter almost as much as architecture quality in premium segments. The Asia-Pacific integrated GPU market can still grow under these conditions, but supply discipline is likely to keep the premium tier tighter than underlying demand through the current planning cycle.
Slow Monetization of AI PC Use Cases in Price-Sensitive Segments
The Asia-Pacific integrated GPU market is also facing a timing issue, because hardware capability has improved faster than software monetization in several price-sensitive countries. Team Computers said India’s PC market reached 15.9 million units in 2025, and AI notebook volumes grew 126.5% year over year in Q3 2025, which confirms strong interest but also shows that the value shift is still developing within a much larger installed base.[3]Team Computers, “India Enterprise Device Spending Report 2025,” Team Computers, teamcomputers.com In India, Indonesia, and Vietnam, buyers still place heavy weight on affordability, battery life, and standard productivity features when choosing notebooks and smartphones. That keeps entry-level and mainstream configurations relevant for longer and slows the pace at which stronger iGPU and NPU capabilities can command durable price premiums. The Asia-Pacific integrated GPU market should still benefit as enterprise software use cases mature, but the near-term adoption curve is likely to remain uneven outside higher-income or policy-supported demand pockets.
*Our forecasts treat driver/restraint impacts as directional, not additive. The impact forecasts reflect baseline growth, mix effects, and variable interactions.
Segment Analysis
By Device Category: Mobile SoCs Lead Revenue While Server Graphics Lift The Next Growth Layer
Mobile SoCs held 49.32% of Asia-Pacific integrated GPU market share in 2025, which kept the region’s revenue base centered on smartphones and tablets. This leadership reflects the region’s structural role in both smartphone manufacturing and consumption, with Chinese and Korean OEM ecosystems driving persistent demand for SoCs that integrate graphics, AI, and connectivity in the same package. Desktop and laptop processors formed the second-largest device category, supported by the commercial notebook refresh cycle and continued notebook-heavy buying patterns in work and education devices. The Asia-Pacific integrated GPU market therefore remained anchored in high-volume consumer electronics, even as PCs regained strategic importance because AI-readiness became a more visible purchase factor.
The Asia-Pacific integrated GPU market size for server and data center processors with integrated graphics is projected to expand at an 18.11% CAGR from 2026 to 2031, making this the fastest-growing device category. That growth is linked to rising interest in edge inference nodes, where operators want lower cost, easier deployment, and better power efficiency than purpose-built discrete accelerators can always provide. Intel said Core Ultra Series 3 delivered up to 1.9x higher large language model performance than NVIDIA Jetson Orin AGX 64GB and up to 4.5x higher vision language action model throughput in robotic workloads, which highlights why integrated server-class graphics are gaining attention beyond the PC space. As cloud and enterprise users across China, Japan, and South Korea expand localized AI processing, this category is reshaping the Asia-Pacific integrated GPU market from a primarily client-device story into a broader compute platform story.


By Performance Tier: Mainstream Volume Holds Firm While Performance-Class Devices Grow Faster
Mainstream captured 41.65% of Asia-Pacific integrated GPU market size in 2025, which shows how much of regional value is still created in devices priced for broad commercial, consumer, and education demand. This tier maps well to the purchasing behavior seen across India, Vietnam, Indonesia, and other cost-sensitive markets, where buyers want reliable graphics and AI features without moving into premium hardware budgets. Entry-level devices continue to matter in ultra-budget smartphones, embedded displays, and industrial systems, where local brands and domestic Chinese suppliers maintain strong volume relevance. High-Performance devices remain smaller in revenue share, but they continue to serve as the first commercial landing zone for new features such as advanced ray tracing, bigger memory pools, and stronger AI acceleration.
The Asia-Pacific integrated GPU market size for the Performance tier is projected to expand at an 18.77% CAGR from 2026 to 2031, which makes it the fastest-growing pricing band. This reflects the premiumization of flagship smartphones and the move toward stronger notebook configurations in enterprise refresh cycles. AMD said the Ryzen AI 400 and PRO 400 series introduced up to 60 NPU TOPS with integrated Radeon 800M graphics and entered OEM systems from ASUS, Acer, HP, Lenovo, and GIGABYTE across Asia-Pacific markets in 2026. The result is that features once limited to the highest tier are moving down into the Performance tier faster than before, which supports the Asia-Pacific integrated GPU market through higher revenue per unit even if shipment growth becomes less uniform.
Geography Analysis
China held 49.45% of Asia-Pacific integrated GPU market revenue in 2025, which kept it far ahead of every other country in the region. Its position reflects a rare combination of scale in device production, scale in end demand, and a broad domestic supply base that reaches from premium smartphones to embedded and industrial systems. The Chinese ecosystem is becoming more segmented, with premium designs facing greater localization pressure while mature-node domestic suppliers remain well placed in entry-level and mainstream categories. This creates a market structure where volume resilience stays high even when procurement patterns change within premium device classes. For the Asia-Pacific integrated GPU market, China remains the revenue center of gravity, but it is also the geography where domestic substitution is changing competitive behavior most visibly.
Japan and South Korea remained smaller than China by revenue share, but both supported higher average selling prices and a stronger mix of premium notebooks and advanced smartphones within the Asia-Pacific integrated GPU market. Japan benefited from a notebook-led replacement cycle tied to enterprise refresh and education device demand, which favored integrated graphics platforms that could combine mobility, efficiency, and AI readiness in one design. South Korea’s position is shaped by Samsung’s device and semiconductor integration, which helps the country stay influential in premium mobile graphics and memory-centric platform development. Together, these two countries strengthen the regional bias toward higher-value integrated graphics designs rather than simple shipment volume alone.
India is forecast to grow at an 18.34% CAGR from 2026 to 2031, which makes it the fastest-expanding national market in the region. Growth is being supported by education procurement, rising 5G adoption, a larger domestic device assembly base, and stronger interest in AI-capable notebooks and smartphones. The Government of India said Semiconductor Mission 2.0 had approved 10 projects with a combined investment of INR 1,60,000 crore, which was paired with the Electronics Component Manufacturing Scheme to improve upstream electronics and packaging capacity. Those policy moves matter because they gradually reduce the cost barriers that have limited access to stronger SoC platforms in locally assembled devices. Taiwan remains the critical advanced manufacturing base for premium chip supply, while Southeast Asia and Australia are gaining strategic importance as assembly diversification and enterprise AI PC demand broaden the footprint of the Asia-Pacific integrated GPU market.
Competitive Landscape
The Asia-Pacific integrated GPU market remained moderately concentrated at the platform design level, with Intel, Qualcomm, Apple, AMD, and MediaTek leading the premium and mid-range stack. That leadership sits beside a long tail of Chinese domestic suppliers such as UNISOC, Rockchip, HiSilicon, Allwinner, and Amlogic, which keep meaningful volume exposure in entry-level smartphones, embedded devices, and industrial systems. Intel made one of the clearest strategic moves when it launched Core Ultra Series 3 as the first AI PC platform built on Intel 18A, with up to 77% faster iGPU gaming performance and 180 TOPS of total platform AI compute. Apple took a different path by extending unified memory and integrated GPU scale across M5, M5 Pro, and M5 Max, which broadened the addressable range for creator and professional AI workloads on fully integrated systems. MediaTek also pushed the mobile segment forward by pairing stronger flagship graphics with ray tracing and agentic AI support, which helped premium smartphone graphics move beyond frame rendering alone.
AMD is using another route in the Asia-Pacific integrated GPU market, focusing on AI notebooks and developer-class systems that combine integrated graphics with higher local AI throughput. Its Ryzen AI 400 and PRO 400 platforms gave OEMs a way to offer stronger graphics and AI capability without depending on a discrete GPU in every configuration. Intel supported the same broad direction in enterprise computing when its Arc Pro driver update enabled far larger memory allocation to built-in iGPUs and expanded ISV validation for workstation use. At the lower end of the regional stack, domestic Chinese vendors remain relevant because cost, localization, and product availability often matter more than frontier graphics performance.
The competitive picture in the Asia-Pacific integrated GPU market is therefore defined by two different layers. The first layer is the premium and mid-range segment, where a small group of global vendors competes on AI compute, memory architecture, graphics features, and software readiness. The second layer is the entry-level and industrial segment, where a much wider field of suppliers still has room to compete on price, mature-node availability, and local customer relationships. That split keeps the market from becoming tightly consolidated even though platform leadership at the top is clear. It also means future disruption is most likely to come from shifts in IP control, domestic localization, or packaging access rather than from simple price competition alone.
Asia-Pacific Integrated GPU Industry Leaders
Intel Corporation
MediaTek Inc.
Qualcomm Incorporated
Apple Inc.
Advanced Micro Devices, Inc.
- *Disclaimer: Major Players sorted in no particular order

Recent Industry Developments
- April 2026: Intel released Arc Pro driver update (version 32.0.101.8517 Q1.26.R2), enabling up to 93% system memory allocation for built-in Arc Pro iGPUs on Core Ultra H-series systems, supporting AI LLM workloads and earning additional ISV certifications including Ansys Mechanical 2025 R2 and PTC Creo 11.
- March 2026: Apple debuted M5 Pro and M5 Max chips, featuring the Fusion Architecture connecting two 3nm dies into a single SoC with GPU cores scaling to up to 40 and unified memory to 128GB. Simultaneously, the MacBook Air with M5 launched with 4x faster AI performance than the M4 generation. Both product lines entered India, Japan, South Korea, and other APAC markets immediately at launch.
- January 2026: AMD unveiled the Ryzen AI 400 and PRO 400 Series at CES 2026, featuring up to 60 NPU TOPS and an integrated Radeon 800M series GPU, with confirmed OEM launches across ASUS, Acer, HP, Lenovo, and GIGABYTE in Indonesia, South Korea, and additional APAC markets throughout Q1-Q2 2026.
- January 2026: Intel launched Core Ultra Series 3 (Panther Lake) at CES on January 5, 2026, with global retail availability commencing January 27, 2026. The platform, the first built on Intel 18A, delivered up to 77% faster iGPU gaming versus the prior Lunar Lake generation and enabled over 200 OEM PC designs from global manufacturing partners.


Asia-Pacific Integrated GPU Market Report Scope
The Asia-Pacific Integrated GPU Market encompasses the global industry involved in the design, development, and deployment of graphics processing units integrated into a system-on-chip (SoC) or processor architecture rather than as standalone discrete components. These integrated GPUs share system memory and are widely used to deliver efficient graphics processing across cost-sensitive, power-efficient computing devices.
The Asia-Pacific Integrated GPU Market Report is Segmented by Device Category (Desktop and Laptop Processors, Mobile SoCs (Smartphones and Tablets), Embedded and Industrial SoCs, and Server and Data Center Processors with Integrated Graphics), Performance Tier (Entry-Level (less than USD 50), Mainstream (USD 50 - USD 150), Performance (USD 150 - USD 300), and High-Performance (greater than USD 300)), and Geography (China, Japan, India, South Korea, Taiwan, and Rest of Asia-Pacific). The Market Forecasts are Provided in Terms of Value (USD).
| Desktop and Laptop Processors |
| Mobile SoCs (Smartphones and Tablets) |
| Embedded and Industrial SoCs |
| Server and Data Center Processors with Integrated Graphics |
| Entry-Level (Less than USD 50) |
| Mainstream (USD 50 - USD 150) |
| Performance (USD 150 - USD 300) |
| High-Performance (Greater than USD 300) |
| China |
| Japan |
| India |
| South Korea |
| Taiwan |
| Rest of Asia-Pacific |
| By Device Category | Desktop and Laptop Processors |
| Mobile SoCs (Smartphones and Tablets) | |
| Embedded and Industrial SoCs | |
| Server and Data Center Processors with Integrated Graphics | |
| By Performance Tier | Entry-Level (Less than USD 50) |
| Mainstream (USD 50 - USD 150) | |
| Performance (USD 150 - USD 300) | |
| High-Performance (Greater than USD 300) | |
| By Geography | China |
| Japan | |
| India | |
| South Korea | |
| Taiwan | |
| Rest of Asia-Pacific |


Key Questions Answered in the Report
What is the Asia-Pacific integrated GPU market size through 2031?
The Asia-Pacific integrated GPU market was valued at USD 24.67 billion in 2025, reached USD 28.25 billion in 2026, and is forecast to reach USD 64.54 billion by 2031 at a 17.97% CAGR.
Which device category leads revenue in Asia-Pacific integrated graphics?
Mobile SoCs led with 49.32% of regional revenue in 2025, reflecting the region's strong smartphone manufacturing and consumption base.
What is driving the AI PC upgrade cycle in Asia-Pacific?
The Windows 10 support deadline, enterprise AI readiness, and stronger iGPU capability in new notebook platforms are driving faster commercial replacement cycles.
Why is the Performance tier growing faster than other price bands?
The Performance tier is projected to grow at 18.77% CAGR through 2031 because premium smartphone features and AI-capable notebook specifications are moving into more accessible price points.
Which country is growing the fastest in the region?
India is forecast to expand at an 18.34% CAGR through 2031, supported by education procurement, 5G adoption, and semiconductor assembly incentives.
How are integrated graphics changing edge AI deployment in Asia-Pacific?
Server and data center processors with integrated graphics are projected to grow at 18.11% CAGR as operators use lower-cost, more power-efficient edge inference nodes instead of relying only on discrete accelerators.
Page last updated on:


