AI Data Center GPU Market Size and Share
Market Overview
| Study Period | 2020 - 2031 |
|---|---|
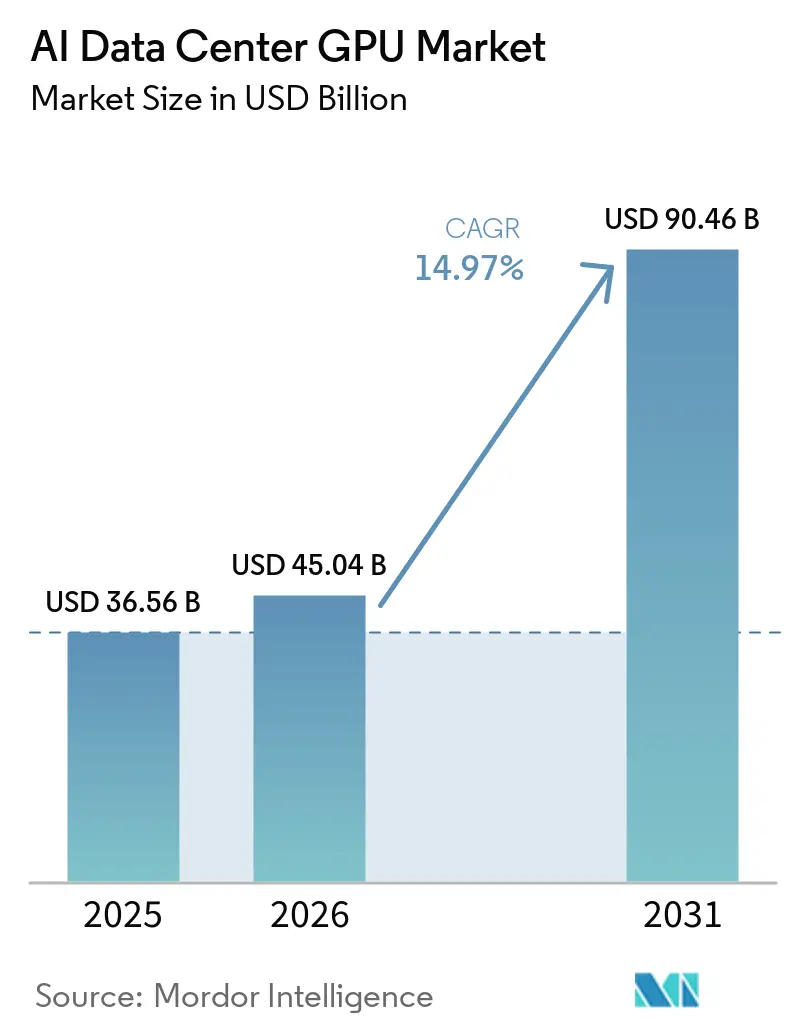
| Market Size (2026) | USD 45.04 Billion |
| Market Size (2031) | USD 90.46 Billion |
| Growth Rate (2026 - 2031) | 14.97% CAGR |
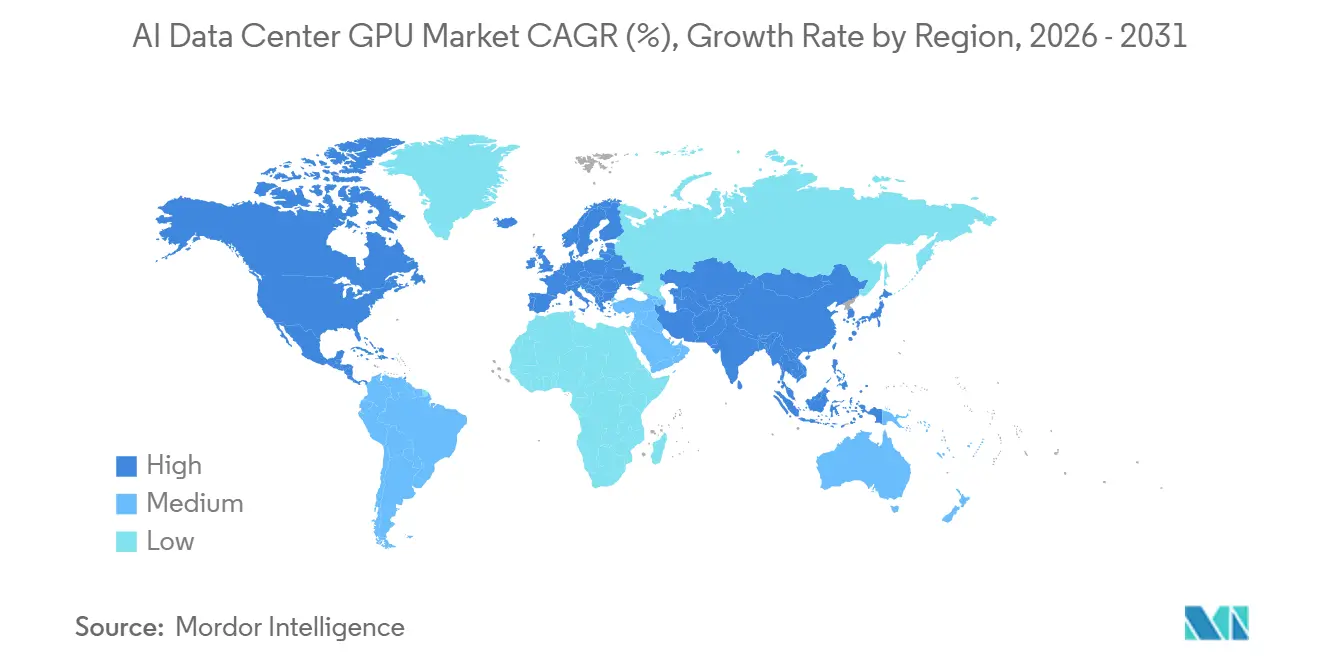
| Fastest Growing Market | Asia-Pacific |
| Largest Market | North America |
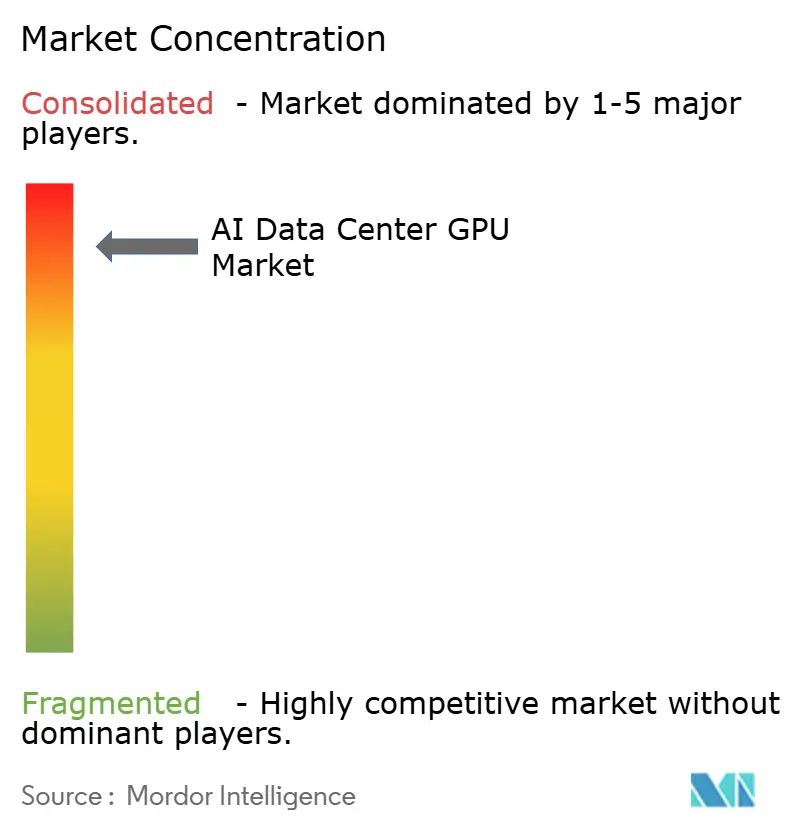
| Market Concentration | High |
Major Players *Disclaimer: Major Players sorted in no particular order Image © Mordor Intelligence. Reuse requires attribution under CC BY 4.0. | |
AI Data Center GPU Market Analysis by Mordor Intelligence
The AI data center GPU market size is expected to grow from USD 36.56 billion in 2025 to USD 45.04 billion in 2026 and is forecast to reach USD 90.46 billion by 2031 at a 14.97% CAGR over 2026-2031. Hyperscalers alone plan to pour more than USD 650 billion into AI infrastructure during 2026, with Alphabet guiding USD 175-185 billion in capital expenditures, nearly twice its 2025 outlay, to ease capacity constraints. Sovereign initiatives are expanding the addressable base, as Canada earmarked CAD 2 billion (USD 1.48 billion) for domestic compute, while the United Kingdom set aside GBP 500 million (USD 630 million) to grant up to 1 million GPU-hours per startup. Meanwhile, export controls have redirected supply toward friendlier regions, adding urgency to hyperscaler pre-purchase agreements and deepening vendors' demand visibility. Finally, high-bandwidth memory and liquid-cooling retrofits are becoming gating factors that accelerate refresh cycles and elevate total system value despite component inflation.
Key Report Takeaways
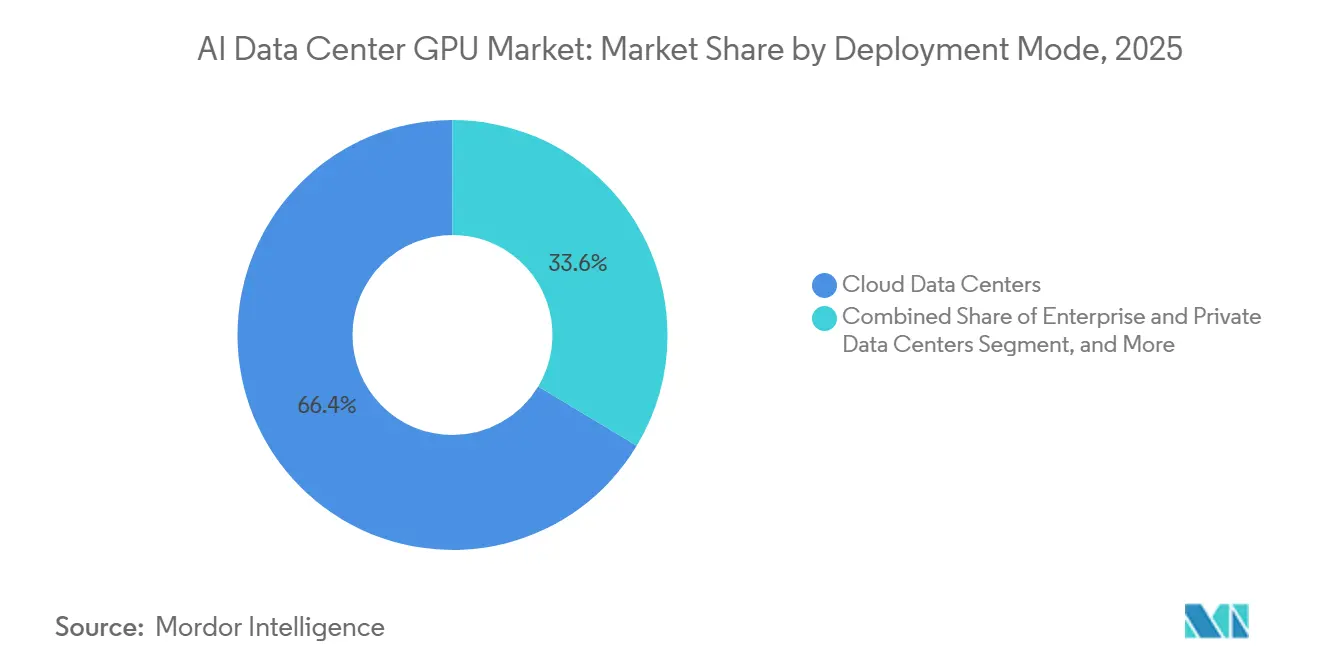
- By deployment mode, cloud data centers led with 66.38% of the AI data center GPU market share in 2025, while edge data centers are projected to expand at a 15.57% CAGR through 2031.
- By GPU type, inference accelerators accounted for 54.23% share of the AI data center GPU market size in 2025 and are forecast to grow at a 15.37% CAGR over 2026-2031.
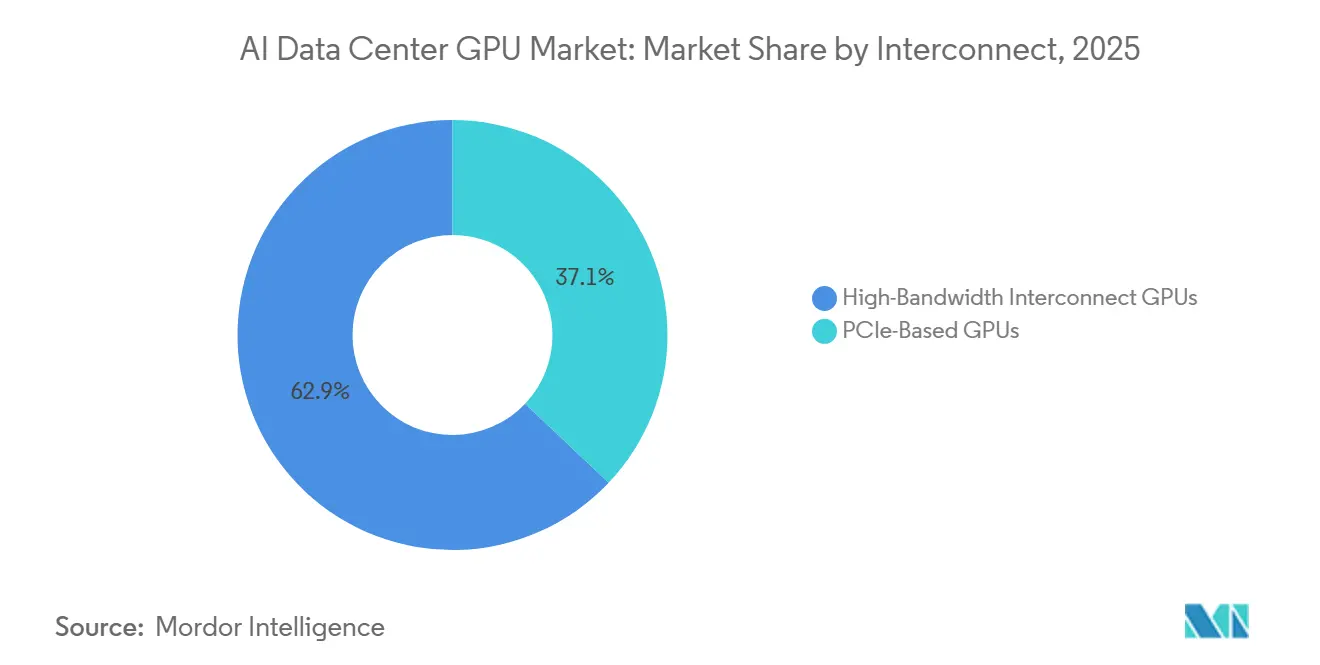
- By interconnect, high-bandwidth fabric GPUs held 62.94% share in 2025 and are expected to post the fastest growth at 15.67% CAGR between 2026 and 2031.
- By end-user, hyperscalers and cloud service providers commanded 76.64% of 2025 revenue, whereas government and research institutions represented the fastest-growing cohort, with a 15.24% CAGR to 2031.
- By geography, North America captured 37.50% revenue in 2025, yet Asia-Pacific is anticipated to record the highest regional growth with a 15.97% CAGR through 2031.
Note: Market size and forecast figures in this report are generated using Mordor Intelligence’s proprietary estimation framework, updated with the latest available data and insights as of January 2026.
Global AI Data Center GPU Market Trends and Insights
Drivers Impact Analysis*
| Driver | (~) % Impact on CAGR Forecast | Geographic Relevance | Impact Timeline |
|---|---|---|---|
| Explosive Growth in Generative AI Model Size | +3.8% | Global, strongest in North America and Asia-Pacific | Medium term (2-4 years) |
| Rapid Adoption of GPU-Accelerated Cloud Services | +3.2% | Global, led by North America and Europe | Short term (≤2 years) |
| Data-Center-Scale GPU Clusters Crossing 100 K Units | +2.6% | Hyperscale sites in North America, Europe and Asia-Pacific | Medium term (2-4 years) |
| Standardization of MLPerf Benchmarks in Procurement | +1.4% | Global | Long term (≥4 years) |
| Rise of Sovereign AI Initiatives in Smaller Economies | +2.1% | Europe, Canada, Middle East and emerging Asia-Pacific markets | Medium term (2-4 years) |
| Liquid-Cooling Retrofits Driving Refresh Sales | +1.8% | Global, earliest in North America and Europe | Short term (≤2 years) |
| Source: Mordor Intelligence | |||
Explosive Growth in Generative AI Model Size
Large language and multimodal models are ballooning past the trillion-parameter mark, and post-training scaling steps such as reinforcement learning from human feedback, synthetic data expansion, and long-context reasoning now consume up to 30 times the compute of the original pre-training run. Operators therefore prioritize GPUs with enormous on-package memory; AMD’s MI325X offers 288 GB of HBM3e, enabling a single server to host a 1-trillion-parameter model and eliminating cross-node sharding delays. NVIDIA’s Blackwell architecture improves cost per million tokens by 15-fold, down to roughly USD 0.02 per million tokens, making pay-as-you-go API economics viable at enterprise scale. Hyperscalers are responding with record capex, and prepayment contracts are locking in both wafer starts and advanced packaging slots, effectively pulling demand forward and solidifying the AI data center GPU market's growth trajectory.
Rapid Adoption of GPU-Accelerated Cloud Services
Embedding generative AI directly into productivity software is proving sticky and high-margin, prompting cloud providers to reserve unprecedented quantities of GPUs. Microsoft sold more than 8 million paid Gemini Enterprise seats within four months, while Google Cloud revenue surged 48% year-over-year in Q4 2025 on the back of Gemini roll-outs across 2,800 corporate customers. These workloads amortize GPU fleets in under two years, reinforcing aggressive procurement. Parallel multiyear supply contracts, such as Microsoft’s 30,000-GPU order from Nscale for a 230-megawatt site in Norway, highlight the cash-flow confidence underpinning the AI data center GPU market.
Data-Center-Scale GPU Clusters Crossing the 100 K-GPU Threshold
Purpose-built AI factories are emerging, with single tenants deploying clusters of more than 100,000 GPUs to train frontier models and serve inference at gigawatt-scale power envelopes. IREN Limited’s purchase of 50,000 NVIDIA B300 GPUs lifts its installed base to 150,000 units and could generate an estimated annualized revenue run rate of USD 3.7 billion by end-2026. Similar mega-deployments push vendors toward integrated rack systems. NVIDIA’s Vera Rubin NVL72, for instance, packages 72 Rubin GPUs and 36 Vera CPUs with 260 TB/s of NVLink fabric, which, in turn, accelerates the replacement of legacy PCIe-only nodes and enlarges the AI data center GPU market footprint.
Rise of Sovereign AI Initiatives in Smaller Economies
Governments outside the U.S.-China axis are funding domestic compute clusters to keep sensitive data on shore and cultivate local AI ecosystems. Canada’s AI Sovereign Compute Infrastructure Program will inject up to CAD 1 billion (USD 740 million) into the development of Canadian-owned supercomputers that researchers, industry, and government can tap at subsidized rates.[1]Innovation, Science and Economic Development Canada, “Program guide: Artificial Intelligence Sovereign Compute Infrastructure Program,” canada.ca The United Kingdom’s Sovereign AI Unit similarly committed GBP 500 million (USD 630 million) to grant one-million-GPU-hour allocations per startup and took an equity stake in domestic hardware orchestrator Callosum. These programs create additional demand pools beyond hyperscaler budgets, broadening the total addressable market for AI data center GPUs.
Restraints Impact Analysis*
| Restraint | (~) % Impact on CAGR Forecast | Geographic Relevance | Impact Timeline |
|---|---|---|---|
| Persistent Supply-Demand Imbalance for Advanced Packaging | -2.4% | Global, most acute in Taiwan and South Korea | Short term (≤2 years) |
| Escalating Total Cost of Ownership for Air-Cooled Racks | -1.6% | Global, severe in power-constrained regions | Medium term (2-4 years) |
| Export Control Restrictions on High-End GPUs | -1.9% | China, Russia, Iran and Southeast Asian transshipment hubs | Medium term (2-4 years) |
| Growing Preference for Custom AI Accelerators over GPUs | -2.2% | North America and Europe, where hyperscalers dominate | Long term (≥4 years) |
| Source: Mordor Intelligence | |||
Persistent Supply-Demand Imbalance for Advanced Packaging
High-bandwidth memory (HBM) stacks and CoWoS interposers remain in chronic shortage. HBM die areas are roughly 2.5 times those of conventional DRAM, and TSV complexity raises defect rates, forcing suppliers to reserve wafer area for yield loss. Micron’s 2026 HBM output is already presold, Samsung is tripling HBM revenue yet still hiking prices by high-teens percentages, and TSMC’s 9.5-reticle-limit expansion will not meaningfully lift CoWoS capacity until 2027. Scarcity slows Rubin and MI400 volume ramps and may compel vendors to allocate early lots to the highest-margin buyers, delaying access for smaller cloud and enterprise users.
Growing Preference for Custom AI Accelerators Over GPUs
Hyperscalers are rolling out proprietary ASICs fine-tuned for inference economics. Microsoft’s Maia 200, fabricated on TSMC's 3 nm process and delivering over 10 PFLOPS at 4-bit precision, targets a 3× cost-performance advantage over Amazon's Trainium Gen3 chips. Google’s Ironwood TPU and Amazon’s 500,000-unit Trainium2 fleet follow the same playbook.[2]Microsoft, “Maia 200: The AI accelerator built for inference,” microsoft.com While GPUs still dominate flexible training and multitask inference, ASIC penetration in high-volume, single-purpose inference could moderate long-run unit growth within the AI data center GPU market.
*Our forecasts treat driver/restraint impacts as directional, not additive. The impact forecasts reflect baseline growth, mix effects, and variable interactions.
Segment Analysis
By Deployment Mode: Cloud Dominates, Edge Accelerates
Cloud facilities accounted for 66.38% revenue in 2025, anchored by multi-gigawatt campuses that integrate liquid-cooled rack pods housing more than 100,000 GPUs each. Enterprises rely on this centralized capacity to amortize compute across thousands of tenants, but rising outbound data fees and privacy mandates are nudging some workloads back on-prem or toward sovereign centers. Edge data centers, though still niche, are forecast to expand at a 15.57% CAGR through 2031 as autonomous vehicles, robotic cells, and real-time industrial inspection demand sub-10-millisecond round-trip latency.
Vendors are increasingly re-architecting software to facilitate seamless model migration across different environments. For instance, NVIDIA’s BlueField-4 Data Processing Unit (DPU) layer plays a pivotal role by tunneling key-value caches from the core to the edge. This approach significantly reduces redundant GPU memory allocations, thereby optimizing resource utilization. Collectively, these advancements are driving the AI data center GPU market along a dual-track scaling trajectory. On one hand, hyperscale hubs are witnessing substantial growth, while on the other, federated micro-sites are also expanding, albeit starting from vastly different foundational levels. These developments highlight the diverse strategies being adopted to meet the evolving demands of AI workloads.


By GPU Type: Inference Gains Share as Post-Training Scales
Inference accelerators accounted for 54.23% of 2025 revenue and will grow faster than training GPUs, with a 15.37% CAGR, thanks to steady, token-based monetization models. Fine-tuning, retrieval-augmented generation, and real-time personalization drive continuous inference cycles that now represent roughly two-thirds of 2026 compute spend. Training GPUs remain indispensable for frontier model creation, but their share erodes as marginal parameter increases yield diminishing performance gains.
Hardware vendors are responding with mixed-precision pipelines, NVIDIA Rubin packs a third-generation Transformer Engine, and AMD MI325X doubles HBM capacity to squeeze trillion-parameter interpreters onto a single board, both innovations that tilt economics further toward inference. As a result, hyperscalers increasingly bifurcate their fleets, reserving the newest interconnect-rich GPUs for large-batch training while backfilling inference clusters with memory-dense cards optimized for cost per token.
By Interconnect: High-Bandwidth Fabrics Enable Rack-Scale Coherence
GPUs equipped with proprietary or standards-based high-bandwidth fabrics accounted for 62.94% of the revenue in 2025 and are projected to sustain the highest growth rate, with a compound annual growth rate (CAGR) of 15.67%. The sixth-generation NVLink technology delivers 3.6 TB/s per GPU and, when deployed within Vera Rubin NVL72 racks, establishes a 260 TB/s unified memory space. This configuration effectively eliminates the overhead of model partitioning, thereby improving efficiency and performance.
On the other hand, Ethernet-based architectures, such as Spectrum-X, have proven that open fabrics can also achieve scalability. For instance, Supermicro’s reference topology connects 32,768 GPUs through a network of 512 leaf switches, 512 spine switches, and 256 superspine switches.[3]Super Micro Computer, “Comparison of Air-Cooled versus Liquid-Cooled NVIDIA GPU Systems,” supermicro.com While PCIe-only cards are generally more cost-effective upfront, the total cost of ownership (TCO) often favors fabric-enabled units when factors such as software development labor and training time are considered. As a result, buyers are increasingly prioritizing interconnect bandwidth over raw computational power, recognizing it as the key factor in reducing the cost per model.
By End-User: Hyperscalers Lead, Government Accelerates
Hyperscalers and cloud service providers controlled 76.64% of 2025 spend, leveraging balance-sheet scale to pre-pay for supply and negotiate early access to each silicon generation. This leadership is unlikely to crumble soon, yet sovereign and academic programs will post the fastest expansion, at a 15.24% CAGR, as governments race to localize sensitive workloads. Canada’s AI Sovereign Compute Infrastructure Program and the United Kingdom’s Isambard-AI super-computer exemplify long-horizon funding structures that underwrite multi-petaflop fleets.
Enterprises occupy a hybrid middle ground, leveraging public cloud instances for bursty training while maintaining critical data workflows on-premises via modular racks such as NVIDIA DGX Spark or AMD-based MI325X blades. This approach allows enterprises to balance scalability and control, ensuring efficient resource utilization while safeguarding sensitive data. Together, these end-user dynamics contribute to the development of a layered ecosystem that supports the AI data center GPU market, extending its growth and relevance beyond the core hyperscaler cycle.
Geography Analysis
North America retained 37.50% of 2025 revenue, buoyed by the proximity of top cloud providers' headquarters and abundant power capacity in Texas, the Midwest, and the Pacific Northwest. U.S. policy continues to favor domestic allocation: January 2026 export-control revisions imposed a 25% tariff on certain high-end GPUs shipped abroad, effectively preserving local supply. Mega-leases such as Applied Digital’s 300-megawatt deal at Delta Forge 1 underscore the long-term runway for U.S.-based construction. Europe follows with concentrated but strategic growth; Microsoft’s 30,000-Rubin-GPU contract in Narvik, Norway, reveals appetite for cold-climate, renewable-powered campuses that mitigate rising carbon taxes. The United Kingdom is channeling GBP 500 million (USD 630 million) into its Sovereign AI Unit, pledging one-million-GPU-hour grants per startup and direct equity stakes in infrastructure orchestration firms.
Asia-Pacific is projected to log the fastest regional expansion at a 15.97% CAGR through 2031. Japan’s USD 12 billion GMI Cloud sovereign site in Kagoshima aims for 1 gigawatt of capacity, positioning the country as a domestic manufacturing hub for robotics, autonomous vehicles, and heavy-industry AI workloads.[4]GMI Cloud, “GMI Cloud Announces 1GW Sovereign AI Infrastructure in Japan Accelerated by NVIDIA Vera Rubin NVL72™,” gmicloud.ai China, facing tightened U.S. export rules and customs hurdles on imports of NVIDIA H200 chips, is pivoting toward homegrown accelerators from Huawei, Cambricon, and Biren, even though yield and software maturity gaps suggest short-term performance lags. Elsewhere, India accelerates approvals for multi-megawatt campuses, while Samsung and SK Hynix in South Korea ramp HBM4 lines to capture value upstream in the GPU supply chain.
South America, the Middle East, and Africa hold smaller shares but serve as fast-follower destinations for low-cost renewable energy. Policy shifts in May 2025 opened Saudi Arabia and the UAE to advanced GPU imports under a Validated End User framework, leveraging their vast natural gas and solar assets to deliver competitive power purchase agreements. Although these regions will not challenge the scale of North America or Asia-Pacific in absolute dollars, they offer incremental upside and geographic risk diversification for vendors marketing into the AI data center GPU market.

Competitive Landscape
NVIDIA remains the dominant supplier in the AI data center GPU market, holding approximately 80% unit share and producing nearly 1,000 GB200 NVL72 racks weekly, each priced close to USD 3 million. However, this dominance is being challenged as hyperscalers increasingly integrate ASICs into their operations, particularly for inference-heavy workloads. Companies like Microsoft, Google, and Amazon are leveraging their proprietary technologies, such as Microsoft’s Maia 200, Google’s Ironwood TPU, and Amazon’s third-generation Trainium, to deliver performance that rivals or surpasses GPUs at a lower unit cost when workloads are narrowly defined. Meanwhile, AMD is gaining traction by focusing on the memory-capacity race, offering MI325X boards with 288 GB of HBM3e and planning to release MI400-series parts with HBM4 integration. This strategy has enabled AMD to secure positions in both training and high-capacity inference clusters. Additionally, startups like Cerebras, Graphcore, and SambaNova are carving out specialized niches with wafer-scale or sparsity-optimized architectures, though they lack the robust CUDA software ecosystem that gives NVIDIA a competitive edge.
Hardware integration has emerged as a critical differentiator in the market. Supermicro, for instance, ships over 100,000 GPUs per quarter and has delivered more than 2,000 liquid-cooled racks since mid-2024. Vertiv’s USD 1 billion acquisition of PurgeRite has further strengthened its capabilities in end-to-end fluid management for thermal systems, a feature that appeals to operators managing high-density deployments such as 150-kilowatt racks. NVIDIA has also taken a comprehensive approach with its Rubin launch, introducing a full-stack solution that includes six co-designed chips, GPU, CPU, NVLink switch, NIC, DPU, and Ethernet switch, all managed by its Mission Control software. This strategy encourages customers to adopt turnkey systems rather than opting for incremental GPU upgrades, thereby reinforcing NVIDIA’s position in the market.
As a result, the barriers to entry in the AI data center GPU industry now extend beyond silicon performance to include rack engineering, facility integration, and lifecycle services. These factors collectively contribute to a highly concentrated market landscape. The competitive dynamics are shaped by the interplay among established players such as NVIDIA and AMD, hyperscalers developing in-house solutions, and emerging startups targeting niche applications. This layered ecosystem underscores the market's complexity, where innovation in hardware, software, and system integration plays a pivotal role in determining market leadership and sustaining growth in the forecast period.
AI Data Center GPU Industry Leaders
NVIDIA Corporation
Advanced Micro Devices, Inc.
Intel Corporation
Google LLC
Huawei Technologies Co., Ltd.
- *Disclaimer: Major Players sorted in no particular order

Recent Industry Developments
- April 2026: Applied Digital signed a 15-year, 300-megawatt lease with a U.S. investment-grade hyperscaler at its Delta Forge 1 campus, bringing total contracted lease revenue above USD 23 billion.
- April 2026: NVIDIA unveiled the DGX SuperPOD reference for Rubin-based systems, featuring the Vera Rubin NVL72 rack with 1,008 Rubin GPUs and automated Mission Control orchestration.
- April 2026: Canada opened the AI Sovereign Compute Infrastructure Program, offering up to CAD 1 billion (USD 740 million) to build national AI supercomputers under strict data-residency rules.
- March 2026: Global AI deployed 7,000 NVIDIA GB300 GPUs at its Endicott, New York, facility and outlined a roadmap to reach 1 gigawatt of capacity by 2029.


Global AI Data Center GPU Market Report Scope
The AI Data Center GPU Market encompasses the global ecosystem of graphics processing units (GPUs) deployed in data centers to support artificial intelligence (AI) workloads, including model training, inference, and high-performance computing. This market includes hardware, associated interconnect technologies, and deployment infrastructures optimized for large-scale AI processing.
The AI Data Center GPU Market Report is Segmented by Deployment Mode (Cloud Data Centers, Enterprise and Private Data Centers, and Edge Data Centers), GPU Type (Training GPUs, and Inference GPUs), Interconnect (PCIe-Based GPUs, and High-Bandwidth Interconnect GPUs), End-User (Hyperscalers and Cloud Service Providers, Enterprises, and Government and Research Institutions), and Geography (North America, Europe, Asia-Pacific, South America, and Middle East and Africa). The Market Forecasts are Provided in Terms of Value (USD).
| Cloud Data Centers |
| Enterprise and Private Data Centers |
| Edge Data Centers |
| Training GPUs |
| Inference GPUs |
| PCIe-Based GPUs |
| High-Bandwidth Interconnect GPUs |
| Hyperscalers and Cloud Service Providers |
| Enterprises |
| Government and Research Institutions |
| North America | United States |
| Canada | |
| Mexico | |
| Europe | United Kingdom |
| Germany | |
| France | |
| Italy | |
| Rest of Europe | |
| Asia-Pacific | China |
| Japan | |
| India | |
| South Korea | |
| Rest of Asia-Pacific | |
| South America | |
| Middle East and Africa |
| By Deployment Mode | Cloud Data Centers | |
| Enterprise and Private Data Centers | ||
| Edge Data Centers | ||
| By GPU Type | Training GPUs | |
| Inference GPUs | ||
| By Interconnect | PCIe-Based GPUs | |
| High-Bandwidth Interconnect GPUs | ||
| By End-User | Hyperscalers and Cloud Service Providers | |
| Enterprises | ||
| Government and Research Institutions | ||
| By Geography | North America | United States |
| Canada | ||
| Mexico | ||
| Europe | United Kingdom | |
| Germany | ||
| France | ||
| Italy | ||
| Rest of Europe | ||
| Asia-Pacific | China | |
| Japan | ||
| India | ||
| South Korea | ||
| Rest of Asia-Pacific | ||
| South America | ||
| Middle East and Africa | ||


Key Questions Answered in the Report
What is the projected value of the AI data center GPU market in 2031?
The AI data center GPU market size is forecast to reach USD 90.46 billion by 2031, growing at a 14.97% CAGR over 2026-2031.
Which deployment mode contributes the largest revenue today?
Cloud data centers account for 66.38% of 2025 revenue, far outpacing enterprise, private and edge facilities.
Why are inference GPUs gaining share over training GPUs?
Continuous token generation from fine-tuning and long-context inference now drives the bulk of compute spend, making memory-dense, inference-optimized GPUs more cost-effective than brute-force training cards.
How are export controls influencing regional supply?
U.S. rules impose tariffs, volume caps and case-by-case reviews on high-end GPU exports, steering supply toward domestic buyers and prompting China to accelerate its own accelerator ecosystem.
What role do liquid-cooling retrofits play in the market?
As rack power densities exceed 150 kilowatts, liquid cooling prevents thermal throttling, boosts throughput by double-digit percentages and opens a lucrative refresh cycle for rack-scale vendors.
Which region is expected to grow the fastest through 2031?
Asia-Pacific is projected to post the highest regional CAGR at 15.97%, led by sovereign investments in Japan, India and South Korea.
Page last updated on:


