
Market Overview
| Study Period | 2020 - 2031 |
|---|---|
| Forecast Data Period | 2026 - 2031 |
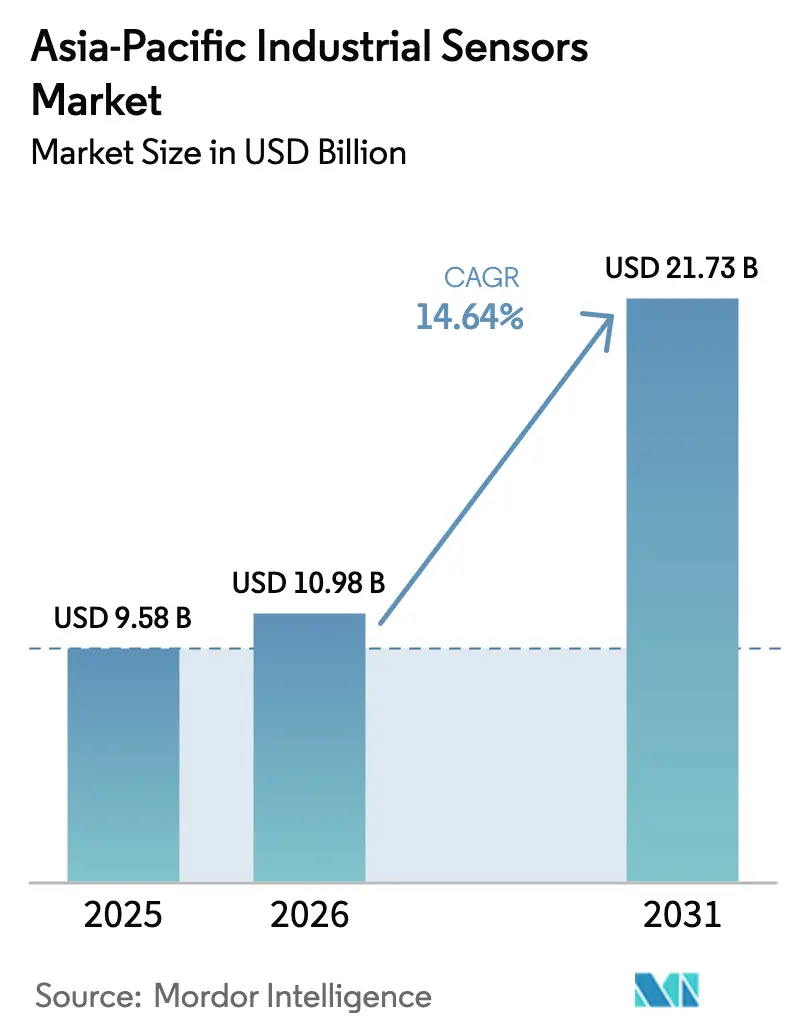
| Base Year Market Size (2025) | USD 9.58 Billion |
| Market Size (2026) | USD 10.98 Billion |
| Market Size (2031) | USD 21.73 Billion |
| Growth Rate (2026 - 2031) | 14.64 % |
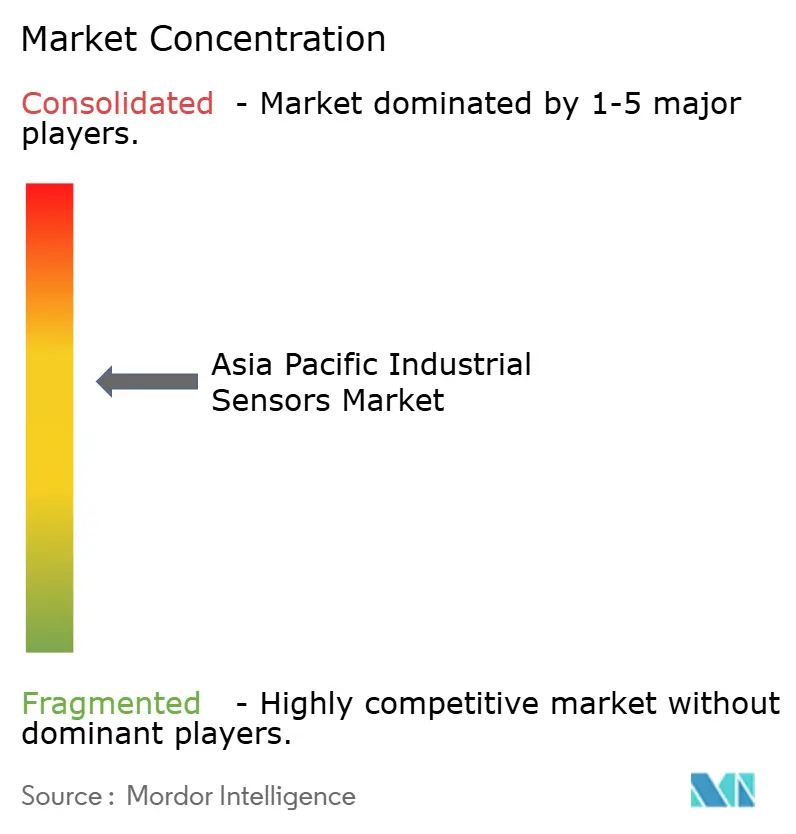
| Market Concentration | Medium |
Major Players *Disclaimer: Major Players sorted in no particular order Image © Mordor Intelligence. Reuse requires attribution under CC BY 4.0. | |
Asia-Pacific Industrial Sensors Market Analysis by Mordor Intelligence
The Asia-Pacific industrial sensors market size is expected to grow from USD 9.58 billion in 2025 to USD 10.98 billion in 2026 and is forecast to reach USD 21.73 billion by 2031 at 14.64% CAGR over 2026-2031. Intensifying digital factory programs, aggressive automation in electronics and automotive corridors, and expanding private 5G coverage are the pivotal forces driving sensor deployment across the region. China’s 94% industrial-AI adoption rate underscores how sensor density now dictates competitive throughput, while India’s Production Linked Incentive scheme is translating fiscal subsidies into large purchase orders for pressure, temperature, and vision sensors. IO-Link standardization and edge-configurable devices are lowering commissioning times, shifting total-cost-of-ownership equations in favor of mid-sized manufacturers. At the same time, spectrum liberalization for private 5G in markets such as Thailand and Malaysia is removing latency barriers that once confined wireless sensors to non-critical loops.[1]Ericsson, “Private 5G for Industrial Applications,” ericsson.com These trends collectively accelerate retrofit activity across brownfield sites and seed fresh demand in new greenfield lines.
Key Report Takeaways
- By product type, pressure sensors led with a 34.28% share of the Asia-Pacific industrial sensors market in 2025 and are projected to expand at a 14.95% CAGR through 2031.
- By end-user industry, automotive held 26.15% of the Asia-Pacific industrial sensors market size in 2025, whereas pharmaceuticals and life sciences are set to grow at a 14.72% CAGR through 2031.
- By sensor connectivity, wired devices accounted for 61.12% of market revenue in 2025 of Asia-Pacific industrial sensors market, but wireless sensors are forecast to register the fastest 15.62% CAGR over the outlook period.
- By sensing technology, MEMS devices captured 42.19% share in 2025 of Asia-Pacific industrial sensors market, yet optical sensors are on track to post a 15.32% CAGR to 2031.
- By country, China captured a 38.95% share of the Asia-Pacific industrial sensors market in 2025. India is projected to record the fastest growth rate at a 15.41% CAGR through 2031.
Note: Market size and forecast figures in this report are generated using Mordor Intelligence’s proprietary estimation framework, updated with the latest available data and insights as of 2026.
Market Trends and Insights
Drivers Impact Analysis of Asia-Pacific Industrial Sensors Market*
| Driver | (~) % Impact on CAGR Forecast | Geographic Relevance | Impact Timeline |
|---|---|---|---|
| IIoT and Industry 4.0 penetration | +2.8% | China, Japan, South Korea, with spillover to India and Southeast Asia | Medium term (2-4 years) |
| Rapid automation across Asia-Pacific manufacturing | +2.5% | China, India, Vietnam, Thailand, Indonesia | Short term (≤ 2 years) |
| Government incentives for smart factories | +1.9% | India (PLI), China (Made in China 2025), Japan (Society 5.0) | Medium term (2-4 years) |
| Demand for predictive maintenance solutions | +2.1% | Japan, South Korea, Australia, with adoption spreading to India | Long term (≥ 4 years) |
| IO-Link and edge-configurable sensors adoption | +1.7% | Global, with early traction in Japan and South Korea | Medium term (2-4 years) |
| Private 5G industrial campus roll-outs | +1.6% | China, Thailand, Malaysia, Singapore | Long term (≥ 4 years) |
| Source: Mordor Intelligence | |||
IIoT And Industry 4.0 Penetration
Manufacturers are migrating from point-level automation to fully connected operations where every asset streams time-series data to on-premise or cloud analytics platforms. China’s 94% industrial-AI adoption in 2024 validates the scale of this shift, with sensors underpinning yield optimization in semiconductor fabs and energy management routines in chemical plants. Japan’s Society 5.0 program accelerates adoption in aging-workforce scenarios, as collaborative robots rely on force and proximity sensors to ensure operator safety. South Korea aims to establish 30,000 smart factories by 2025, effectively repositioning sensors from optional hardware to a compliance necessity. Open-protocol devices are proliferating as buyers seek interoperability, fragmenting brand loyalty but enlarging the total hardware pool. Premium vendors now bundle analytics subscriptions with hardware, transforming one-off sensor sales into recurring revenue.
Rapid Automation Across Asia-Pacific Manufacturing
Rising labor costs and the reshoring of supply chains push producers to automate every repetitive task. India’s PLI scheme is expected to generate USD 130.8 billion in additional factory output by 2024 and spur new orders for temperature, pressure, and optical sensors in greenfield electronics and automotive plants. Vietnam’s USD 100 billion electronics output relies on optical sensors for surface-mount accuracy, replacing them every three to five years as component miniaturization tightens tolerances. Thailand’s retrofit of hybrid-vehicle lines demands higher-precision pressure and flow devices, while Indonesia’s food processors are shifting from manual checks to machine-vision quality control. As throughput targets climb, sensor refresh cycles shorten, lifting annual replacement revenue.
Government Incentives For Smart Factories
Fiscal programs are lowering the entry barrier for automation. India refunds 4%–6% of incremental sales, letting manufacturers amortize sensor investments against subsidies. China allocates provincial grants to domestic sensor manufacturers under the Made in China 2025 initiative, strategically reducing import reliance in pressure and flow categories. Japan’s tax credits for ISO 50001 energy-management certification boost demand for energy-monitoring sensors that detect compressed-air leaks. South Korea co-funds 50% of sensor-rich upgrades for SMEs, compressing payback periods to within two years. Such incentives create a self-reinforcing loop: subsidies increase sensor density, which in turn justifies further digital spending.
Demand For Predictive Maintenance Solutions
Rising downtime penalties prompt operators to adopt condition-based strategies. Yokogawa reports that coupling wireless vibration sensors with analytics cuts false alarms by 60%, addressing earlier skepticism over alert quality.[2]Yokogawa Electric Corporation, “Industrial Automation Solutions,” yokogawa.com Australia’s miners mandate sensor monitoring on conveyors because a single failure can idle USD 2 billion operations. South Korea’s chip fabs utilize gas sensors to monitor chamber contamination, thereby preventing scrap worth millions of dollars. As device prices fall and cloud algorithms commoditize, barriers to pilot projects recede, extending uptake into mid-tier plants. The economic case strengthens further when energy savings from optimized runtimes are taken into account.
Restraints Impact Analysis of Asia-Pacific Industrial Sensors Market*
| Restraint | (~) % Impact on CAGR Forecast | Geographic Relevance | Impact Timeline |
|---|---|---|---|
| High upfront cost and ROI uncertainty | -1.4% | India, Southeast Asia, SME-heavy markets | Short term (≤ 2 years) |
| Legacy-system integration complexity | -1.2% | Japan, South Korea, mature industrial bases | Medium term (2-4 years) |
| Chip-supply volatility for MEMS devices | -0.9% | Global, with acute impact on automotive and consumer electronics | Short term (≤ 2 years) |
| Spectrum regulations limiting industrial wireless | -0.8% | India, Indonesia, fragmented regulatory environments | Long term (≥ 4 years) |
| Source: Mordor Intelligence | |||
High Upfront Cost And ROI Uncertainty
SMEs often lack the working capital to absorb 12- to 18-month payback periods typical of predictive-maintenance pilots. Indian family-owned mills with annual revenue below USD 10 million prefer machinery that lifts output immediately over sensors offering indirect gains. Slim margins at Southeast Asian auto-component plants demand ROI in under 24 months, whereas wireless deployments may take up to 36 months when integration and learning curves are counted. Leasing models that could spread payments remain scarce, prolonging the investment hurdle. The result is a widening digital gap between cash-rich corporations and resource-constrained suppliers.
Legacy-System Integration Complexity
Brownfield sites laden with 1980s PLCs struggle to ingest data from Ethernet-based sensors. Japan’s chemical complexes using proprietary bus protocols face multimillion-dollar rip-and-replace costs or risk data silos that blunt digital strategies. South Korean steel furnaces cannot accept downtime necessary for rewiring, yet wireless alternatives operate below the 1,200 °C thresholds required. Skill shortages compound the issue; a single engineer fluent in both legacy code and modern IoT can be booked for nine months. Vendors offering plug-and-play bridges gain disproportionate traction in these accounts.
*Our forecasts treat driver/restraint impacts as directional, not additive. The impact forecasts reflect baseline growth, mix effects, and variable interactions.
Asia-Pacific Industrial Sensors Market Segment Analysis
By Product Type:
Pressure Dominance Meets Wireless DisruptionPressure sensors commanded 34.28% Asia-Pacific industrial sensors market share in 2025, reflecting their indispensability in process control, hydraulics, and vehicle safety systems. Projections show a strong 14.95% CAGR growth through 2031, driven by private 5G's ability to eliminate latency issues in compressor optimization and steam-distribution loops. Temperature sensors remain the next-largest category, underpinned by semiconductor fabs' pursuit of sub-0.1 °C stability and biologics' requirement for cold-chain integrity below 8 °C. Level-measurement growth is driven by municipal water upgrades replacing corroding mechanical floats with radar units that perform effectively in high-solids effluent. Flow sensors are shifting toward mass-flow technology in custody-transfer transactions, where volumetric variance previously led to inflated billing disputes.
Across the remainder of the portfolio, gas sensors are expanding into indoor-air monitoring for sterile spaces, vibration devices are standard equipment in predictive-maintenance kits, and optical sensors are crucial for label placement accuracy exceeding 300 units per minute. Magnetic-field sensors fulfill niche roles in EV powertrain alignment and current sensing. With each incremental production upgrade, buyers accent hybrid stacks, combining pressure, temperature, and optical sensing, to gain multidimensional visibility, intensifying cross-selling opportunities for multi-product vendors.




By End-User Industry:
Automotive Maturity Versus Pharmaceutical AccelerationAutomotive lines accounted for 26.15% of the Asia-Pacific industrial sensors market size in 2025, driven by the embedding of over 100 temperature and voltage nodes per unit in EV battery packs and the integration of radar, lidar, and ultrasonic devices in ADAS suites. In contrast, the pharmaceutical and life sciences segment is on track for a 14.72% CAGR through 2031, as regulators tighten mandates for continuous environmental monitoring within sterile zones. Electronics manufacturing ranks third, as chipfabs often exceed 50,000 installed sensors per site to sustain nanometer-class process stability. Chemical and petrochemical complexes rely on pressure and flow sensing to prevent runaway reactions, while power producers utilize vibration monitoring to maximize the uptime of wind turbine gearboxes and solar inverter strings.
Oil-and-gas operators favor wireless builds on offshore platforms where cabling exceeds USD 1,000 per meter. Food processors are pushing for stainless-steel IP69K sensors that can withstand high-pressure washdowns, resulting in three- to five-year replacement cycles. Water utilities adopt radar level gauges and pH probes to comply with increasingly stringent discharge limits, whereas mining sites rely on proximity and gas sensors to prevent costly evacuations. Aerospace and defense remain specialty niches demanding radiation-hardened, wide-temperature-range devices that command premium pricing.
By Sensor Connectivity:
Wired Incumbency Challenged By Wireless EconomicsWired devices maintained 61.12% share in 2025 because brownfield plants see limited ROI in replacing functional 4-20 mA loops. However, wireless nodes will clock a 15.62% CAGR as private 5G meets deterministic performance thresholds once exclusive to wired protocols. IO-Link bridges both worlds, using standard three-wire cables while enabling digital communication and slashing commissioning time by 40%. Edge-smart sensors reduce bandwidth by sending only anomaly alerts, mitigating congestion in offshore and mining operations where satellite backhauls are expensive.
The economic calculus is tilting toward wireless because installation labor on wired retrofits can be three to five times the hardware cost. Energy-harvesting innovations, piezo, thermo, and photoelectric, extend battery-free lifespans past a decade. Hybrid architectures prevail: critical control loops stay wired, while auxiliary monitoring migrates to wireless. Varying national spectrum policies still introduce deployment friction, but incremental harmonization is underway as regulators appreciate the productivity dividends.

By Sensing Technology:
MEMS Maturity Meets Optical InnovationMEMS captured 42.19% Asia-Pacific industrial sensors market share in 2025, buoyed by decades of process refinement for pressure, acceleration, and gyroscope functions. Optical sensors are projected to post a 15.32% CAGR to 2031 as fiber-optic devices prove their worth in high-EMI and explosive zones where electronics are prohibited. CMOS image sensors deliver megapixel resolutions to machine vision, enabling defect detection at line speeds previously impossible with analog predecessors. Piezoresistive stacks dominate ultra-high-pressure hydraulic applications, while capacitive designs excel at liquid-level tasks that are confounded by rare-earth particulates optically.
Hybrid devices are emerging, for instance, six-axis MEMS inertial units for autonomous mobile robots, dual-mode temperature-humidity chips for HVAC, and integrated pressure-temperature modules for precise coolant control in EV manufacturing. Supply-chain resilience now influences technology selection; buyers favor vendors with multisite fabs to avoid repeat shortages. Functional-safety and quality-management certifications are increasingly influential during procurement, as end-users prioritize compliance to streamline audits.
Geography Analysis
APAC Industrial Sensors Market
In 2025, China secured a dominant 38.95% share of the Asia-Pacific industrial sensors market, underpinned by the Made in China 2025 initiative, which redirects spending toward domestic suppliers. A 94% industrial-AI adoption rate means sensor-fed data already drives yield and energy decisions across automotive, electronics, and chemical factories. Large-scale private 5G sites, such as Midea’s 200,000 m² plant, underscore the country’s readiness to operate closed-loop robotic control over wireless networks. Brownfield upgrades characterize Japan’s market, while predictive-maintenance sensors offset labor shortages in plants that are on average 25 years old. Meanwhile, Society 5.0 policies mainstream cyber-physical integration. South Korea’s Smart Factory Initiative reclassifies sensors as compliance expenditures, thereby fast-tracking their adoption in the automotive and semiconductor sectors.
India and ASEAN Industrial Sensors Market
India emerges as the fastest-growing market through 2031, for instance, PLI incentives worth INR 10.9 lakh crore have translated into factory builds across Gujarat, Tamil Nadu, and Uttar Pradesh, which embed sensors from the ground up. Southeast Asia’s growth stems from Vietnam’s USD 100 billion electronics output, Thailand’s 1.8 million annual vehicle production, and Malaysia’s petrochemical expansions, all integrating sensor-heavy automation to match global quality benchmarks.
APAC and Oceania Industrial Sensors Market
Indonesia and the Philippines are automating food and beverage lines, creating new demand for vision and NIR spectrometers. Australia and New Zealand deploy wireless sensors in mining and agriculture; cable runs costing USD 1,000 per meter make wireless economics compelling. Emerging economies such as Bangladesh and Pakistan register nascent uptake limited to basic temperature and gas detection in export-oriented textile mills. Regulatory fragmentation in wireless allotments remains a constraint, but gradual alignment on IEC 61508 and ISO 13849 standards is lowering certification costs for regional rollouts.
Regulatory Landscape
Across Asia-Pacific, industrial sensor deployments are increasingly shaped by formal standards, calibration requirements, and OT cybersecurity rules that move compliance from a procurement preference to an operational requirement. In Japan, the Ministry of Economy, Trade and Industry (METI) revised JIS B 9920-2:2026 in July 2026, introducing certification requirements for imported IIoT air monitoring systems effective August 1, 2026. This changes the compliance stack for environmental and cleanroom monitoring sensor deployments used in electronics, pharmaceuticals, and other regulated manufacturing.
China is tightening interoperability and sensor specification baselines through national standards, including GB/T 47562-2026 issued in April 2026 for MEMS pressure and temperature sensors (effective August 1, 2026) and GB/T 47278-2026 issued in March 2026 for industrial product data dictionaries in control equipment (effective October 1, 2026). South Korea is also raising the bar for measurement traceability, with KRISS-linked calibration certification becoming mandatory for imported industrial MEMS accelerometers from October 1, 2026. In parallel, multiple APAC economies have moved OT cybersecurity requirements for critical infrastructure from guidance toward enforceable regimes, increasing the need for secure-by-design sensor firmware and documented lifecycle management in plant networks.
Value Chain Analysis
The Asia-Pacific industrial sensors value chain covers MEMS die fabrication, packaging and module assembly, device firmware and connectivity integration, channel distribution, and system-level installation and services. Front-end MEMS and advanced component fabrication is concentrated in Northeast Asia, with Japan, South Korea, and Taiwan taking a large share of MEMS sensor die fabrication, while China and key Southeast Asian manufacturing hubs, including Malaysia and Vietnam, focus on module assembly, testing, and electronics manufacturing integration for high-volume end markets such as automotive and electronics.
Upstream bottlenecks remain in application-specific ICs and automotive-grade components used in smart transmitters and connected sensors, where extended lead times can disrupt delivery schedules for OEM and retrofit projects. Regional supply chain reconfiguration, influenced by shifting trade and technology controls and by localization efforts, is pushing more module-level assembly and testing into Southeast Asia and India. That shift raises the importance of qualified packaging partners, calibration and certification labs, and distributors that can support multi-standard deployments (wired, wireless, and IO-Link) across both brownfield and greenfield factory environments.
Competitive Landscape
Competitive intensity is moderate, with global majors ABB, Siemens, and Honeywell protecting their installed bases through proprietary protocols and bundled analytics. Meanwhile, Omron, Keyence, and Yokogawa win a share of the discrete-manufacturing market by shipping edge-configured sensors that bypass separate gateways. IO-Link’s rapid adoption dismantles historic lock-in, shifting competition toward software differentiation and ecosystem services. Niche players thrive where domain know-how outweighs brand heft, vibration sensing for wind, gas detection for chip fabs, magnetic-field sensing for EV drivetrains.
Strategically, semiconductor vendors such as STMicroelectronics and Infineon are expanding captive MEMS capacity to shield themselves from future shortages. Patent races in wireless power harvesting and deterministic networking hint at forthcoming product waves that slash maintenance overhead. Influence within standards bodies, particularly the IEC 61508 and OPC UA working groups, provides early visibility of compliance and shapes buyer specifications. Buying patterns bifurcate: large enterprises prefer single-vendor stacks for lower integration risk, while SMEs favor open-protocol best-of-breed mixes to preserve flexibility.
Asia-Pacific Industrial Sensors Industry Leaders
Texas Instruments Incorporated
STMicroelectronics N.V.
Emerson Electric Co
Rockwell Automation Inc.
ABB Ltd.
- *Disclaimer: Major Players sorted in no particular order
Asia-Pacific Industrial Sensors Market Companies Covered in this Report
- ABB Ltd.
- Emerson Electric Co.
- Honeywell International Inc.
- Siemens AG
- Rockwell Automation Inc.
- Texas Instruments Incorporated
- STMicroelectronics N.V.
- Yokogawa Electric Corporation
- Endress+Hauser AG
- Schneider Electric SE
- Mitsubishi Electric Corporation
- Omron Corporation
- Keyence Corporation
- SICK AG
- Pepperl+Fuchs SE
- Balluff GmbH
- ifm electronic gmbh
- Hans Turck GmbH and Co. KG
- TE Connectivity Ltd.
- Analog Devices Inc.
- Infineon Technologies AG
- Sensata Technologies Holding plc
- Panasonic Holdings Corp.
- First Sensor AG
- Amphenol Advanced Sensors
- Ericco International Ltd.
- Others (fully profiled ≥20)

Market Opportunities and Future Outlook
Localization of sensor manufacturing and packaging in Asia-Pacific is creating opportunities for suppliers that can deliver qualified, interoperable devices with documented calibration and cybersecurity readiness. In China, the build-out of MEMS pressure sensor capacity in Jiangsu (Suzhou and Wuxi) has been described through second-phase production activity, reinforcing the region as a sourcing base for pressure sensors, the largest product category by revenue share in 2025. In Malaysia, Trensor reported progress toward completing a pressure sensor manufacturing facility in Penang Technology Park, with a stated 100 million MYR investment and a planned 10 million-unit annual capacity. This supports a regional alternative for customers looking to diversify sourcing beyond traditional Northeast Asia nodes.
On the demand side, factory digitalization programs are shifting toward AI-enabled operations that depend on dense, reliable sensing and cleaner data pipelines. South Korea’s June 2026 Manufacturing AI 2030 Strategy, framed as a public-private investment initiative with regional physical AI testbeds, supports opportunities for edge-integrated and deterministic sensor deployments in semiconductor, automotive, and other priority industries. At the same time, new standards and cross-border documentation requirements in 2026, including China’s GB/T standards for MEMS sensors and industrial data dictionaries, along with ASEAN-related trade and type-approval considerations for wireless modules, increase the value of vendors that can ship certified, multi-protocol sensor platforms and provide compliance documentation that reduces commissioning and import friction.
Recent Industry Developments in Asia-Pacific Industrial Sensors Market
- June 2026: Emerson Electric Co. announced a co-development agreement with Aramco to create next-generation corrosion management solutions that integrate ultrasonic online corrosion monitoring for industrial processes. The collaboration raises demand for rugged sensing and continuous monitoring architectures in harsh environments, expanding the use of inline sensors in maintenance and integrity workflows.
- June 2026: STMicroelectronics released a vibration sensor featuring integrated AI-based machine learning for local data processing in industrial condition-monitoring applications. On-device inference supports predictive maintenance use cases where bandwidth, latency, or data-governance constraints limit raw signal streaming from large sensor fleets.
- November 2025: Keyence released its AP-X series wireless photoelectric sensors featuring on-device AI for defect classification, enabling real-time inspection on high-speed PCB lines without forwarding image data to external servers. This launch supports the move toward edge-configurable sensing and accelerates adoption of wireless inspection nodes in electronics manufacturing corridors.


Asia-Pacific Industrial Sensors Market Report Scope and Research Methodology
Market Definition and Coverage
For this study, the market covers revenues generated from industrial sensors used to measure, detect, and control physical or process conditions in industrial settings across Asia-Pacific, where sensors are purchased as components or integrated within industrial systems.
Scope exclusions: It does not include consumer-grade sensing devices or non-APAC revenues, and it excludes downstream services that are not directly tied to industrial sensor shipments.
Segments Covered in This Report
- By Product Type
- Pressure
- Temperature
- Level
- Flow
- Magnetic Field
- Acceleration and Yaw Rate
- Gas
- Vibration
- Proximity
- Optical / Photo-electric
- By End-user Industry
- Automotive
- Electronics and Semiconductor
- Chemical and Petrochemical
- Power Generation
- Oil and Gas
- Food and Beverage
- Water and Wastewater
- Pharmaceuticals and Life Sciences
- Metals and Mining
- Aerospace and Defense
- By Sensor Connectivity
- Wired Sensors
- Wireless Sensors
- IO-Link Sensors
- Edge-integrated Smart Sensors
- By Sensing Technology
- MEMS-based
- CMOS-based
- Piezoresistive
- Capacitive
- Optical
- Electromagnetic
- By Geography
- China
- Japan
- South Korea
- India
- Southeast Asia
- Australia and New Zealand
- Rest of Asia-Pacific
Data Sources, Market Sizing, and Validation
Desk Research
Desk work starts by mapping the industrial activity base that typically drives sensor demand, then checking which sensor categories are actually being adopted in factories and process plants. We rely on public sources such as national statistics offices in APAC economies, UN Comtrade trade statistics for relevant HS categories, the International Energy Agency for power and energy activity indicators, and the International Federation of Robotics for automation intensity signals.
To keep assumptions realistic, we also review company annual reports and investor presentations for product mix commentary, along with standards and technical references from groups such as IEC and ISO that help confirm common industrial use conditions. Patent databases are used in a limited way to sense where sensing technologies are being developed and where the focus is shifting, for example toward smart or connected sensing. For fill-in data like financial splits, shipment cues, and pricing direction, we use paid subscriptions focused on company financials and intelligence, news and financials, and patent databases. These desk sources are not exhaustive, and we consulted additional public documents and datasets to collect, cross-check, and clarify inputs.
Primary Interviews and Surveys
Primary work is used to pressure-test the desk assumptions that most often swing the totals, mainly price progression, channel markups, and the pace of connected sensor adoption across key APAC industries. We speak with a mix of sensor makers, distributors, automation system participants, and industrial end users across APAC, so gaps in public reporting can be closed and the final model aligns with what buyers are actually installing.
Distribution of primary research fieldwork respondents
| Company type | Respondent position |
|---|---|
| Top tier: 29% | CXOs: 12% |
| Mid tier: 49% | Functional/Unit leaders: 29% |
| Smaller Players: 22% | Managers: 59% |
Market-Sizing & Forecasting
Sizing is built using a top-down pathway that reconstructs demand from APAC industrial activity and automation signals, then allocates spend into sensor categories through adoption and mix assumptions. Where it helps, we corroborate totals with selective bottom-up approximations, such as supplier revenue roll-ups for key sensor lines, channel checks on typical price bands, and sampled ASP multiplied by estimated unit volumes for common use cases.
Inputs used in the model include factory automation and robot installation trends, process industry capex patterns for energy, chemicals, and water, the split between wired and wireless connectivity, the pace of smart sensor attachment (including IO-Link style connectivity where applicable), and observed price movement by sensor type as volumes scale. Because country and industry mixes vary widely across APAC, gaps in unitization or pricing are handled by building a banded estimate first, then narrowing it using interview feedback and desk signals that best match each sub-region.
Forecasts are produced using scenario analysis, where the main drivers, including automation investment, industrial output, and connectivity penetration, are projected under base, conservative, and expansion cases. The final forecast path is then selected after the assumptions are reviewed with industry experts to ensure they align with current procurement behavior and practical rollout timelines.
Data Validation & Update Cycle
Outputs are checked through triangulation across independent signals, followed by variance checks at country and application levels so unusual jumps can be traced back to a specific input. We also run consistency checks so that implied sensor spending does not drift away from known industrial investment trends, and then the model is reviewed in steps before sign-off.
Reports are refreshed on an annual cycle, with interim updates triggered when a material event changes pricing, trade flows, or industrial investment patterns in key APAC economies. Before delivery, we perform a final update pass to ensure the numbers reflect the latest available public releases and the most recent primary feedback.
Mordor Intelligence's Asia Pacific Industrial Sensors Market Size Compared With Other Published Estimates
Published estimates for industrial sensors in Asia-Pacific often differ because the boundary of what counts as an industrial sensor is not consistent, and because currency conversion timing and inflation handling can change the reported USD value. Differences also come from whether the estimate is anchored to factory and process industry demand signals, or mainly extended from a global number using a region share.
Robot installation trends, industrial output series, and trade flow checks for sensor-related categories are the evidence points that keep Mordor Intelligence tied to an APAC demand pool. That pool is then split by connectivity and end-user intensity before forecasting. When those checks are not applied, totals can move up or down depending on whether adjacent categories are blended in, how fast ASP declines are assumed, and whether the base year is treated as an actualized year or a partially forecast year.
Benchmark comparison
| Source | Market Size | Gaps in Research Methodology |
|---|---|---|
| Mordor Intelligence | USD 9.58 B (2025) | |
| Regional Consultancy A | USD 9.64 B (2024) | Uses a different base year and often blends factory automation sensors with broader sensing components, which can shift the total even when the growth rate looks similar. |
| Industry Publisher B | USD 12.92 B (2023) | Reports a cumulative addressable value across a multi-year window and may include adjacent smart sensing and integration layers, which inflates a single-year market value when converted into USD. |
The comparison shows that the spread is mainly explained by what is counted as an industrial sensor in APAC and how the year basis is handled. By keeping the scope tied to industrial sensor revenues and checking totals against independent activity and adoption signals, the resulting number stays traceable to clear drivers and can be re-run as new indicators are released.


Key Questions Answered in the Report
What is the expected value of the Asia Pacific industrial sensors market in 2031?
The market is projected to reach USD 21.73 billion by 2031 based on current growth trajectories.
Which product category currently holds the largest revenue share?
Pressure sensors lead with 34.28% of total revenue due to their prevalence in process control and automotive systems.
Why are wireless sensors growing faster than wired alternatives?
Private 5G roll-outs and IO-Link standardization are overcoming latency and reliability concerns, lowering installation costs and driving a 15.62% CAGR for wireless nodes.
Which end-user segment is forecast to expand the quickest?
Pharmaceuticals and life sciences are set for a 14.72% CAGR as regulators demand continuous environmental monitoring in sterile manufacturing.
How do government incentives influence adoption?
Programs such as India’s PLI and China’s Made in China 2025 subsidize smart-factory investments, effectively converting sensor purchases into compliance requirements and shortening payback periods.
Page last updated on:





