
Japan Green IT Software Market Size and Share
Market Overview
| Study Period | 2020 - 2031 |
|---|---|
| Forecast Data Period | 2026 - 2031 |
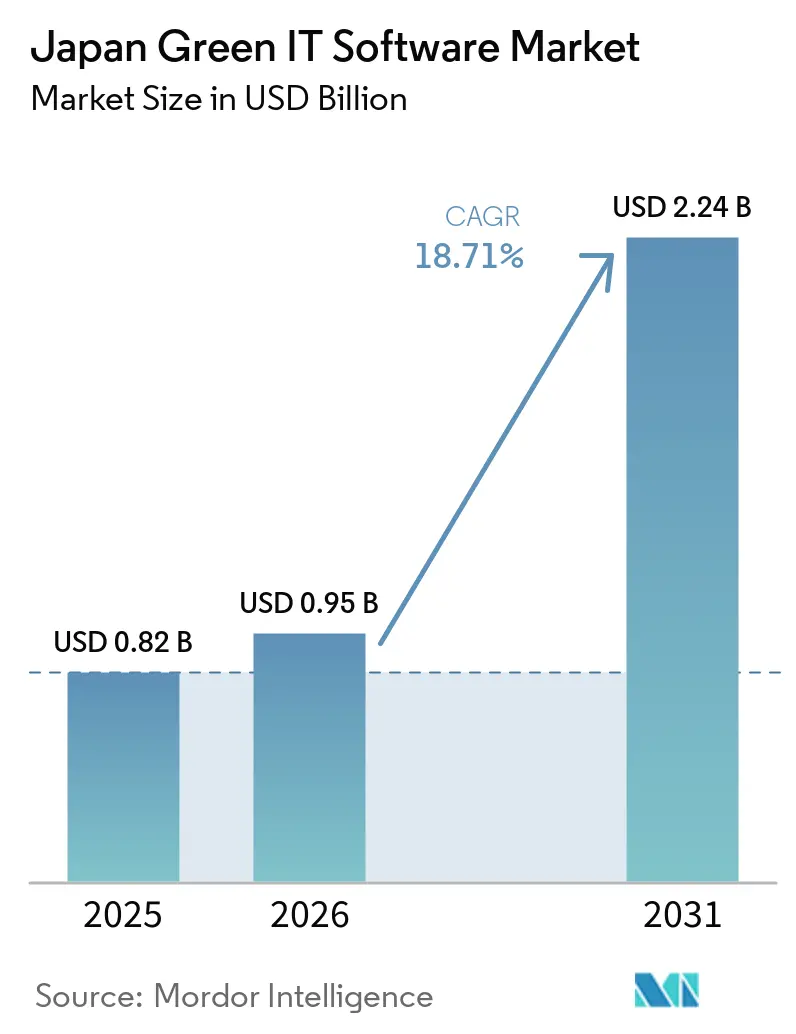
| Base Year Market Size (2025) | USD 0.82 Billion |
| Market Size (2026) | USD 0.95 Billion |
| Market Size (2031) | USD 2.24 Billion |
| Growth Rate (2026 - 2031) | 18.71 % |
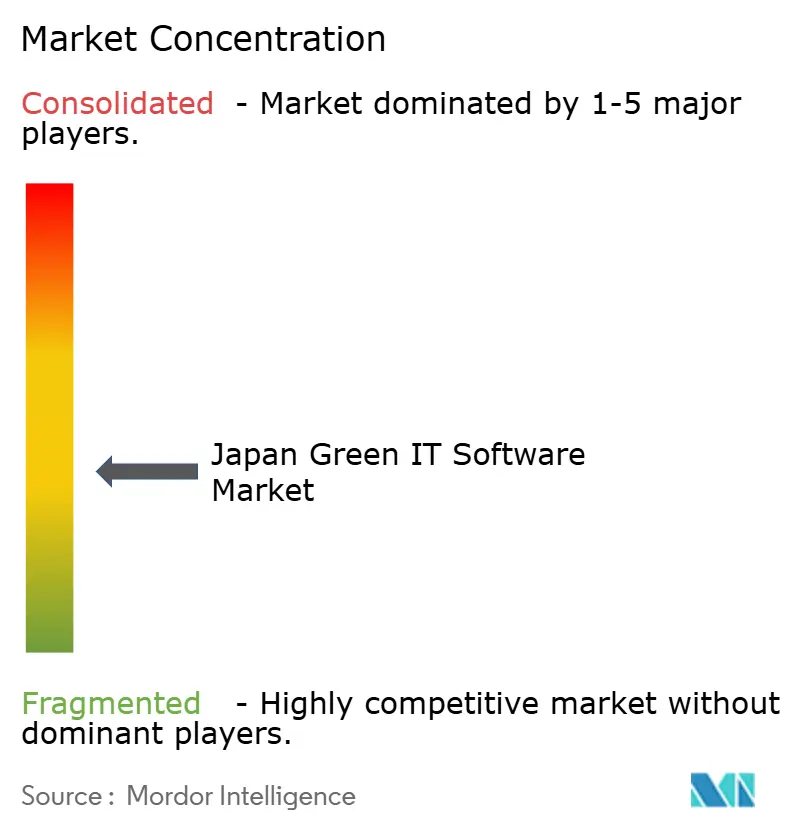
| Market Concentration | Medium |
Major Players *Disclaimer: Major Players sorted in no particular order Image © Mordor Intelligence. Reuse requires attribution under CC BY 4.0. | |
Japan Green IT Software Market Analysis by Mordor Intelligence
The Japan green IT software market size was valued at USD 0.82 billion in 2025 and is projected to reach USD 2.24 billion by 2031, growing at a CAGR of 18.71% from 2026 to 2031. The market is moving from a discretionary sustainability tool set toward core compliance and operating infrastructure as disclosure, audit, and verification requirements become more demanding across large enterprises and their supply chains. Demand is also rising because companies need one system that can bring together energy data, emissions records, supplier information, and reporting workflows without creating duplicate work across separate teams. Cloud adoption remains central because enterprises with multi-site operations need faster consolidation of facility-level information, while localized workflow design continues to matter in sectors that require audit-ready documentation and stronger governance controls. Competition is active across domestic specialists, broader enterprise software vendors, and emerging platforms that are trying to widen their role from carbon accounting into reporting, data management, and supply chain collaboration. The strongest openings remain in Scope 3 data collection, assurance support, and integration with older business systems, while execution risk still centers on talent shortages, legacy IT complexity, and data governance concerns in sensitive verticals.
Key Report Takeaways
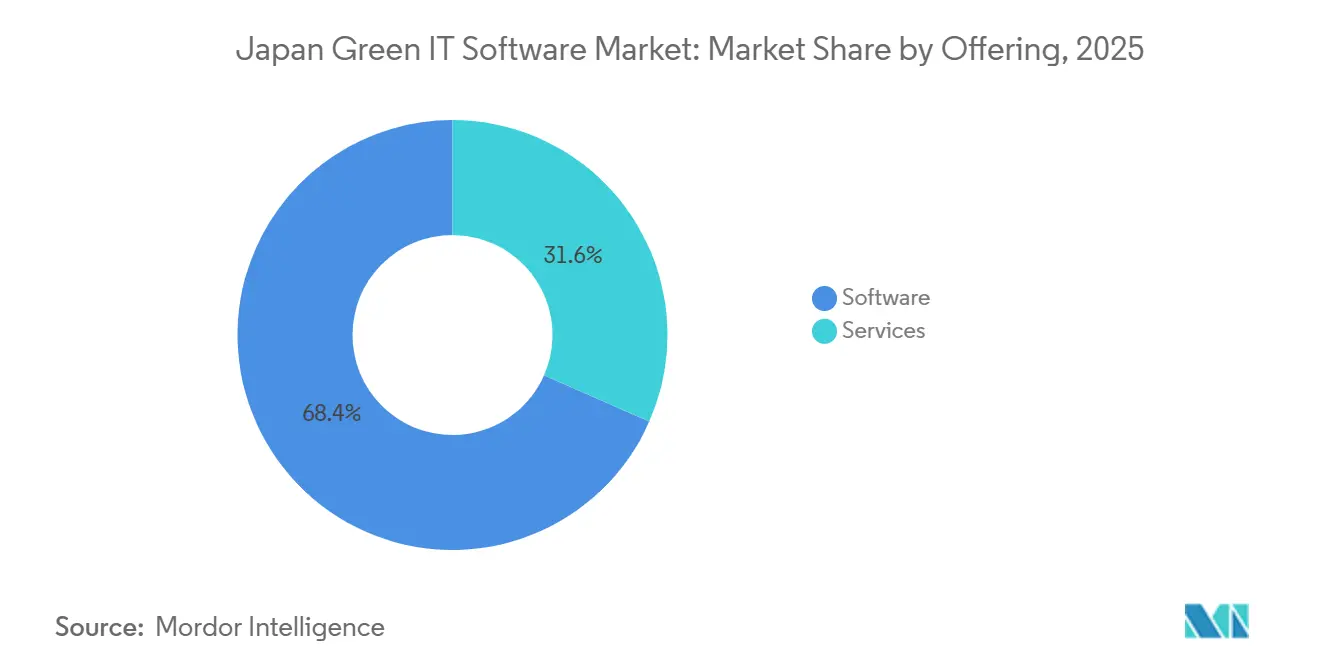
- By offering, software held 68.41% of the Japan green IT software market share in 2025, while services are projected to expand at an 23.22% CAGR through 2031.
- By deployment, cloud-based platforms accounted for 63.41% of the Japan green IT software market size in 2025, and cloud-based deployment is also projected to record the highest CAGR at 19.96% through 2031.
- By solution type, energy and resource optimization software led with 39.82% revenue share in 2025, while carbon management and accounting software is projected to advance at an 21.11% CAGR through 2031.
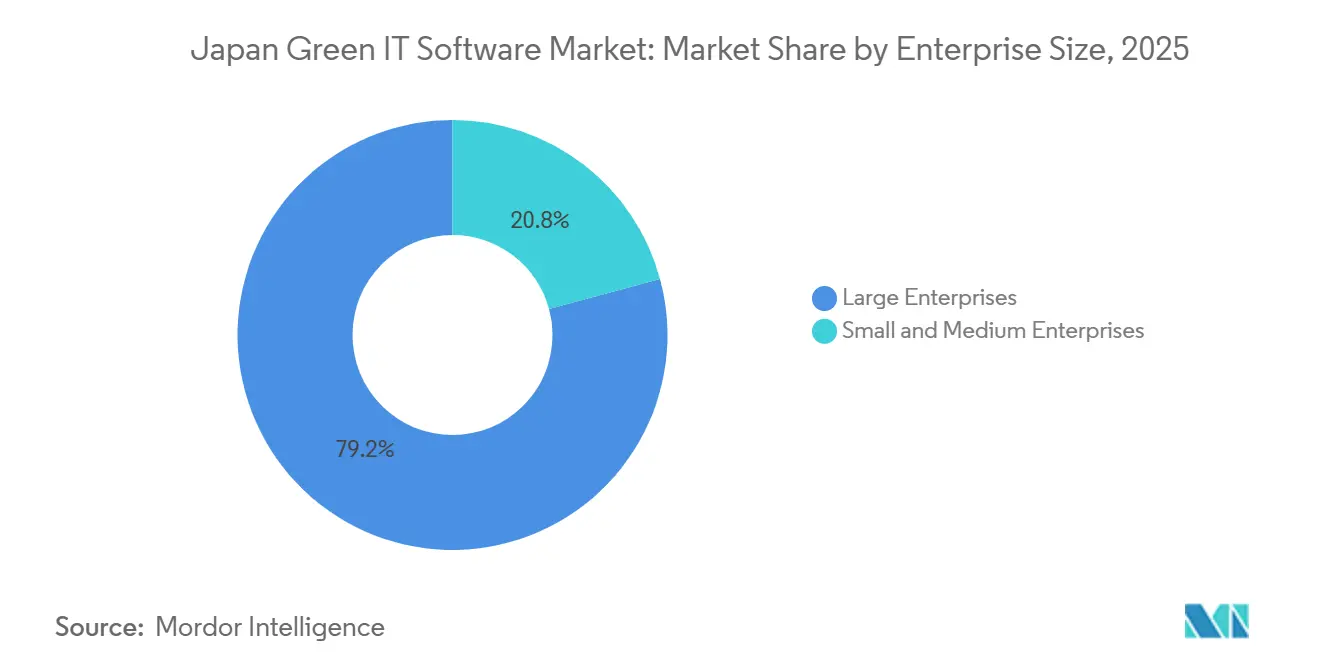
- By enterprise size, large enterprises represented 67.29% share in 2025, while SMEs are expected to expand at a 21.63% CAGR through 2031.
- By end-user industry, manufacturing held 27.43% share in 2025, while IT and telecommunications is projected to grow at a 22.04% CAGR through 2031.
Note: Market size and forecast figures in this report are generated using Mordor Intelligence’s proprietary estimation framework, updated with the latest available data and insights as of January 2026.
Japan Green IT Software Market Trends and Insights
Drivers Impact Analysis*
| DRIVER | (~) % IMPACT ON CAGR FORECAST | GEOGRAPHIC RELEVANCE | IMPACT TIMELINE |
|---|---|---|---|
| Tighter GX Disclosure and Audit Expectations | +4.2% | National, with early concentration in Tokyo and Osaka Prime Market corporate headquarters | Short term (≤ 2 years) |
| Rising Data Center Power Efficiency Pressure | +3.5% | National, with early gains in Tokyo, Osaka, and Hokkaido data center corridors | Short term (≤ 2 years) |
| Shift Toward Cloud-Based Sustainability Workflows | +2.8% | National | Medium term (2-4 years) |
| Scope 3 Data Demands From Large Customers | +2.5% | National, spillover to APAC supply chain partners | Medium term (2-4 years) |
| AI-Enabled Automation for Carbon and Energy Analytics | +2.0% | National | Medium term (2-4 years) |
| Software Consolidation to Reduce IT Waste and License Sprawl | +1.2% | National | Long term (≥ 4 years) |
| Source: Mordor Intelligence | |||
Tighter Gx Disclosure and Audit Expectations
Tighter disclosure and audit expectations are giving the Japan green IT software market a more compliance-led buying pattern, especially among larger listed companies and major industrial groups. Buyers are no longer looking only for dashboards or emissions visibility, they are looking for systems that can support repeatable documentation, internal controls, and third-party review across multiple reporting cycles. This is pushing software selection toward platforms that can keep one consistent emissions record across operating teams, finance teams, and supply chain functions. The pressure also favors vendors that can reduce the burden of duplicate reporting by linking carbon data with broader sustainability workflows. As a result, product depth in audit trails, record traceability, and verification support is becoming more important than basic reporting features alone.
Rising Data Center Power Efficiency Pressure
Power efficiency pressure in data centers is creating a separate but closely linked growth lane for the Japan green IT software market as operators face greater scrutiny on energy performance and utilization. The issue is widening beyond facility management because higher AI-related compute demand is making energy visibility, workload planning, and reporting more material to cost control and corporate decarbonization efforts. Software demand is therefore shifting toward tools that can connect energy data, utilization trends, and carbon outcomes in one operating view. NTT's March 2026 formalization of CO2 calculation rules for the full software lifecycle also broadened the discussion from hardware efficiency toward the carbon profile of software development and use itself. That development supports a wider market role for digital tools that can measure both operating energy performance and embedded software-related emissions across IT environments.[1]
Shift Toward Cloud-Based Sustainability Workflows
The shift toward cloud-based sustainability workflows remains one of the clearest structural supports for the Japan green IT software market because many companies need to consolidate data from multiple domestic sites and overseas operations. Cloud models fit this need better than fragmented on-premise setups when reporting cycles tighten and users need shared access across sustainability, operations, procurement, and finance teams. The preference is also reinforced by the need to scale supplier engagement without placing new infrastructure costs on smaller partners. At the same time, demand is becoming more selective, with buyers in governance-sensitive sectors favoring hybrid models that keep critical identifiers on-premise while still using cloud engines for aggregation and reporting. This means growth is not just about cloud availability, it is about whether vendors can offer cloud convenience together with the audit structure and control features large enterprises expect.
Scope 3 Data Demands From Large Customers
Scope 3 data requests from large customers are extending the Japan green IT software market beyond directly regulated enterprises and into supplier networks that had previously invested little in formal sustainability software. This adoption path is important because it is being driven by procurement requirements and customer retention, not only by direct regulation. Smaller firms are being pulled into carbon accounting and reporting processes because larger buyers need more complete upstream information across purchased goods and services. The May 2025 integration between TOPPAN's SmartLCA-CO2 service and the ASUENE platform showed how supplier data can be fed more directly into customer disclosure workflows, especially in packaging-related value chains.[2] That kind of linkage supports wider adoption of entry-level and mid-market platforms that can make supplier participation simpler and more routine.
Restraints Impact Analysis*
| RESTRAINT | (~) % IMPACT ON CAGR FORECAST | GEOGRAPHIC RELEVANCE | IMPACT TIMELINE |
|---|---|---|---|
| Legacy System Integration Complexity | -3.8% | National, more acute in regional manufacturing prefectures with older ERP infrastructure | Short term (≤ 2 years) |
| Cybersecurity and Data Governance Concerns | -2.5% | National, concentrated in BFSI, government, and healthcare verticals | Medium term (2-4 years) |
| Shortage of Sustainability-Focused IT Talent | -1.8% | National | Medium term (2-4 years) |
| Localization and Audit-Readiness Gaps for Smaller Firms | -1.2% | National, more acute in regional industrial clusters outside major urban centers | Long term (≥ 4 years) |
| Source: Mordor Intelligence | |||
Legacy System Integration Complexity
Legacy system integration remains one of the clearest restraints on the Japan green IT software market because many enterprises still operate older ERP, production, and facility systems that were not built for open and continuous data exchange. The problem is most visible in manufacturing-heavy environments where emissions information often sits across part tables, production records, utility documents, and site-level systems that do not naturally connect. This slows deployment, raises customization costs, and makes implementation risk a bigger factor in vendor selection. NTT DATA Kansai's BIZXIM CFP launch reflected this challenge by focusing on direct carbon footprint extraction from production management data, which shows how much adaptation is still required in industrial settings. Vendors with stronger connector libraries and better implementation depth are therefore more likely to shorten sales cycles and reduce early churn in accounts that depend on older operational systems.
Cybersecurity and Data Governance Concerns
Cybersecurity and data governance concerns are slowing adoption in parts of the Japan green IT software market where emissions and operational records can reveal commercially sensitive activity. Facility-level energy use, supplier transaction flows, and process efficiency data can all become sensitive when they are concentrated in a single platform that is accessed by multiple teams and external partners. This creates a higher bar for cloud deployments in banking, government, healthcare, and other sectors that place more weight on internal controls and data handling practices. Buyers in these segments are more likely to favor hybrid or on-premise models unless vendors can show stronger access controls, masking features, and reliable audit logs. The result is not a rejection of sustainability software, but a slower and more selective buying path in the segments where governance risk is treated as materially important.
*Our forecasts treat driver/restraint impacts as directional, not additive. The impact forecasts reflect baseline growth, mix effects, and variable interactions.
Segment Analysis
By Offering: Software Dominates, While Services Capture Structural Growth
Software represented 68.41% of the Japan green IT software market in 2025, which reflected a clear preference for owned and auditable digital workflows across corporate users. That preference fits a market where companies want direct control over emissions records, reporting steps, and compliance documentation rather than relying only on managed support. It also favors vendors that can keep configuration, workflow management, and data ownership inside the customer environment. Services, however, are projected to grow at 23.22% CAGR from 2026 to 2031, which shows that implementation, assurance preparation, and ongoing support are becoming more material as deployments move from pilot stage to operating scale. The mix therefore points to a market where software remains the core purchase, while services become more important as enterprises try to use those platforms in a consistent and verified way.
The services opportunity is being shaped by the practical work that follows software procurement, including onboarding suppliers, aligning internal teams, preparing documentation, and supporting review processes across repeated reporting cycles. This means demand is no longer limited to installation support, it increasingly includes readiness work that helps companies turn data collection into disclosures and auditable records. Vendors that can combine software subscriptions with structured assurance support are better placed to defend revenue and keep customers from fragmenting their workflow across too many partners. Zeroboard's assurance support package, launched for companies preparing for stricter disclosure requirements, illustrates how vendors are trying to widen their role beyond software alone.[3] That supports a two-layer structure in which software anchors the system of record, while services help customers sustain usage, pass verification, and expand platform scope over time.
By Deployment: Cloud Infrastructure Anchors and Accelerates Market Growth
Cloud-based platforms held 63.41% of the Japan green IT software market size in 2025 and are also projected to grow at a 19.96% CAGR through 2031, which gives cloud a rare position as both the largest and fastest-growing deployment model. This dual role reflects the practical reality that large organizations need centralized access across dispersed facilities, multiple business units, and supplier networks. It also reflects a cost and usability advantage for smaller firms that cannot justify dedicated infrastructure for carbon accounting and sustainability reporting. On-premise systems still hold relevance in organizations with stricter control requirements, while hybrid models are gaining traction as a middle path for more sensitive use cases. The market is therefore not moving toward one rigid architecture, but toward deployment choices that balance scale, speed, and governance.
Cloud adoption is also being reinforced by visible enterprise examples that show how large and geographically dispersed users can standardize data intake across many sites. Asuene's work with SMBC Group across more than 3,000 locations, including the use of AI-driven OCR for utility invoice data extraction, is one example of how cloud-based models can reduce reporting friction in complex operating environments. Even so, the strongest differentiation is beginning to shift from hosting model alone toward the ability to preserve audit integrity and data control in more regulated environments. That is why hybrid deployment is becoming strategically important in banking, government, and healthcare, where buyers want cloud efficiency without giving up tight control over sensitive identifiers and records. In that sense, the deployment story in the Japan green IT software market is becoming less about pure cloud migration and more about trusted architecture design for repeatable compliance work.
By Solution Type: Carbon Accounting Leads Growth as Gx Compliance Deepens
Energy and resource optimization software held the largest solution type share at 39.82% in 2025, which reflected its broader use across facilities, operations, and data center environments. Carbon management and accounting software is forecast to grow at 21.11% CAGR from 2026 to 2031, showing that the market is shifting toward systems that can turn raw operating data into reportable emissions records and supplier-linked carbon information. This shift matters because optimization tools can improve efficiency, but carbon accounting tools are increasingly the layer that connects internal operations with external disclosure and customer requirements. The Japan green IT software market size for carbon management and accounting software is therefore being supported by a wider set of use cases than simple emissions tracking alone. The category now sits closer to core reporting, supplier collaboration, and audit preparation than it did in earlier adoption cycles.
The boundaries between solution types are also becoming less fixed as buyers seek fewer platforms and more connected workflows. ESG reporting and compliance tools are gaining strategic weight because users want one reporting structure that can align operational metrics with management review and external disclosure requirements. Sustainability data management platforms are moving into a hub role by connecting data intake, emissions engines, and reporting outputs that used to sit in separate systems. NTT's software lifecycle CO2 calculation rules also suggest that solution demand will keep broadening beyond hardware and facility energy questions into software-related footprint measurement and management. That helps explain why carbon accounting is growing fastest, while energy optimization remains largest, because buyers increasingly need both efficient operations and a stronger carbon evidence layer within the same broader workflow.
By Enterprise Size: Sme Adoption is the Market's Structural Growth Engine
Large enterprises accounted for 67.29% of the Japan green IT software market in 2025, which reflected their stronger budgets, broader reporting obligations, and more immediate exposure to disclosure and verification pressure. They were also earlier adopters because they already had internal sustainability teams, more formal IT procurement structures, and greater investor attention on climate-related performance. SMEs, by contrast, are projected to grow at 21.63% CAGR through 2031, which makes them the fastest-growing enterprise size segment in the forecast period. This growth is not simply a smaller version of large-enterprise demand, it is being shaped by supplier expectations, customer questionnaires, and value-chain participation requirements. The pattern suggests that the next expansion phase will rely less on direct top-down obligations and more on the spread of practical reporting needs through commercial relationships.
The SME opportunity is structurally important because smaller firms represent a large share of the workforce and play an essential role in industrial subcontracting and supply chain continuity across Japan.[4] That is why the adoption curve in smaller accounts is likely to depend on low-friction onboarding, simpler data capture, and pricing that fits operational budgets rather than large transformation projects. Vendors that can combine entry-level functionality with upgrade paths for supplier reporting and customer data requests should be better positioned than platforms built mainly for large global accounts. The Japan green IT software market share in SMEs is still smaller than that of large enterprises, but the segment has the clearest room for volume expansion if customer-led Scope 3 requests keep spreading through domestic supply chains. This makes SME enablement one of the most practical long-term growth levers in the market, especially when vendors can deliver simpler workflows without stripping away the documentation quality larger customers expect.
By End-User Industry: Manufacturing Anchors Demand as it and Telco Accelerate
Manufacturing held the largest end-user industry share at 27.43% in 2025, which kept it at the center of the Japan green IT software market because of its energy intensity, supply chain complexity, and operational depth. Manufacturers often need to track emissions and energy performance across plants, purchased inputs, and production records, which creates broader system requirements than those seen in lighter service sectors. IT and telecommunications is expected to grow at a 22.04% CAGR through 2031, making it the fastest-growing vertical as energy management, software-related footprint measurement, and data center efficiency become more material. This pairing is important because it shows one segment leading through industrial exposure and another through digital intensity and infrastructure expansion. The market is therefore being shaped by both heavy-industry compliance needs and the rising carbon relevance of digital operations.
The next layer of adoption includes banking, government, energy and utilities, healthcare, retail and e-commerce, and construction and infrastructure, each with a different reason for investing. Banking stands out because it pairs stronger governance expectations with a need for clearer sustainability data across internal operations and broader reporting processes. Government and public sector demand is more selective, but it can support vendors that offer stronger localization, control features, and implementation discipline. Fujitsu's May 2026 work on a groupwide carbon footprint of products platform for Panasonic also shows how large enterprise users are looking to standardize carbon calculation across complex organizational structures and supply chains. That kind of rollout matters beyond one customer because it shows how end-user demand is moving toward broader interoperability, standardized calculation logic, and enterprise-wide operating models rather than stand-alone carbon tools.
Geography Analysis
Japan is the sole geography analyzed in this report, with its green IT software market shaped by a combination of regulatory pressures, industrial sophistication, and high enterprise readiness. Unlike other regions where sustainability software demand is often driven by a single use case, Japan's demand arises from the intersection of emissions management, reporting requirements, energy efficiency, and supplier engagement. The market is further supported by the presence of large publicly listed companies, energy-intensive manufacturers, advanced digital service providers, and complex domestic supply chains, which make reporting requirements more intricate. These factors position Japan as one of the most structurally developed demand environments for sustainability software within the broader Asia-Pacific region.
Within Japan, demand is primarily concentrated in Tokyo, which serves as the hub for listed company headquarters, financial institutions, and major enterprise procurement activities. Osaka and the Kansai region represent the next significant cluster, driven by their industrial base, large corporate groups, and strong focus on manufacturing-related compliance and reporting needs. Secondary demand centers are gaining momentum in industrial prefectures where suppliers are addressing upstream data requests from larger customers, particularly in regions with dense manufacturing networks. Hokkaido is also emerging as a notable area of interest due to increasing priorities in energy and data center development, which are driving demand for digital tools that integrate power, utilization, and carbon data across new infrastructure projects. While Tokyo maintains its leadership, this geographic diversification expands the commercial opportunities for vendors capable of combining direct enterprise sales with localized, partner-driven approaches.
The size of Japan's green IT software market at the national level remains heavily reliant on large urban corporate clusters. However, the next phase of growth is expected to stem from regional industrial ecosystems and supplier networks rather than solely from headquarters-driven demand. Local implementation factors, such as legacy systems, workforce limitations, and budget constraints, vary significantly across prefectures and customer segments. This variability highlights the importance of localized workflow designs and simplified deployment models for market expansion beyond major metropolitan areas. Additionally, Japan's tighter labor market compared to some peer markets increases the value of software solutions that reduce manual reporting efforts and enable smaller teams to manage complex data processes. In this market, success is less about competing at the national level and more about how effectively vendors can translate national demand into practical, region-specific solutions that address diverse industrial and operational needs.
Competitive Landscape
The Japan green IT software market remains moderately fragmented, with no single vendor holding a dominant position across all customer groups, deployment models, or use cases. Domestic purpose-built platforms have built momentum in the SME and mid-market tiers through stronger localization, simpler pricing, and closer alignment with Japanese reporting workflows. Global enterprise software vendors continue to defend large-account positions by embedding sustainability modules inside broader ERP and supply chain stacks, which gives them an advantage where switching costs are high. The result is a competitive structure where specialization matters in one segment and installed base leverage matters in another.
Platform breadth is becoming more important because customers increasingly prefer fewer disconnected tools and more unified operating layers for carbon accounting, reporting, supplier data management, and assurance support. Zeroboard's January 2026 rollout of the AIST-IDEA full package as a standard platform feature showed how localization can become a strong competitive advantage when it improves calculation quality and makes domestic emissions factor use easier for customers.[5] The same vendor's assurance support package also signaled that providers are moving beyond software features into adjacent services that can help customers prepare for more formal disclosure and review cycles. Asuene's October 2025 update on cumulative adoption, which cited more than 23,000 corporate users and strong traction in manufacturing, also underscored the value of scale and recurring workflow adoption in a market that still lacks a single dominant vendor. These moves suggest that competition is shifting from simple product availability toward data assets, localized content, implementation support, and the ability to hold customers inside a broader sustainability operating environment.
Another notable feature of the market is the amount of white space that still exists in audit-ready Scope 3 workflows, supplier enablement tools, and software that connects carbon records with wider financial and operational planning. Fujitsu's May 2026 work with Panasonic on a groupwide CFP platform showed how large IT vendors are treating this field as a strategic growth area rather than a side offering, especially where enterprise-wide standardization and supply chain interoperability are involved. NTT's March 2026 software lifecycle CO2 calculation rules point in the same direction by expanding the relevance of green IT software toward the footprint of software products and operations themselves. Competition is therefore likely to remain active, but the winners should be the vendors that can combine localized trust, broader workflow coverage, and stronger implementation depth without making the product too heavy for mid-market users.
Japan Green IT Software Industry Leaders
-
Asuene Inc.
-
Zeroboard Inc.
-
Fujitsu Limited
-
NEC Corporation
-
NTT DATA Corporation
- *Disclaimer: Major Players sorted in no particular order
Recent Industry Developments
- May 2026: Fujitsu commenced building a Carbon Footprint of Products (CFP) calculation platform across the Panasonic Group by implementing its Sustainability Value Accelerator CFP solution at Panasonic Digital Co., Ltd., with full-scale operation scheduled for April 2027. The platform standardizes CFP calculations across the group and complies with WBCSD/PACT global interface standards, enabling supply chain interoperability for decarbonization reporting.
- March 2026: Zeroboard launched a Third-Party Assurance Support Package offering comprehensive support, from Scope 1 and 2 GHG emissions calculation to third-party assurance preparation, targeting Prime Market companies with a market capitalization exceeding JPY 3 trillion ahead of mandatory SSBJ disclosure for fiscal years ending February 2027.
- March 2026: NTT formalized CO2 emissions calculation rules covering the entire software product lifecycle from procurement and development through operation to end-of-life, developed through Japan Environment Club's Decarbonization Study Group and consistent with METI's Carbon Footprint Guidelines. The rules enable software-level CFP assessments for green procurement decisions and Scope 3 reporting, and are intended for international standardization.
- January 2026: Zeroboard began offering the AIST-IDEA full package in partnership with AIST Solutions, integrating Japan's national Inventory Database for Environmental Analysis (IDEA), supervised by Japan's National Institute of Advanced Industrial Science and Technology, directly into the Zeroboard platform as a standard feature. This integration significantly improves Scope 3 category calculation accuracy using government-endorsed secondary emission factors and was described as an industry first.
Japan Green IT Software Market Report Scope
Japan's Green IT Software refers to environmentally sustainable computing solutions aimed at minimizing energy consumption, optimizing IT resource utilization, and contributing to the nation’s carbon neutrality objectives (net-zero emissions by 2050). These solutions are integral to Japan's Green Growth Strategy, comply with the SSBJ sustainability disclosure standards, and promote initiatives such as energy-efficient data centers, AI workload optimization, and circular IT asset management.
The Japan Green IT Software Market Report is Segmented by Offering (Software, and Services), Deployment (Cloud-Based, On-Premise, and Hybrid), Solution Type (Carbon Management and Accounting Software, ESG Reporting and Compliance Software, Sustainability Data Management Platforms, Decarbonization Planning Software, and Energy and Resource Optimization Software), Enterprise Size (Large Enterprises, and Small and Medium Enterprises), End-User Industry (IT and Telecommunications, Manufacturing, Banking, Financial Services, and Insurance (BFSI), Government and Public Sector, Energy and Utilities, Healthcare, Retail and E-Commerce, Construction and Infrastructure, and Other End User Industries). The Market Forecasts are Provided in Terms of Value (USD).
| Software |
| Services |
| Cloud-Based |
| On-Premise |
| Hybrid |
| Carbon Management and Accounting Software |
| ESG Reporting and Compliance Software |
| Sustainability Data Management Platforms |
| Decarbonization Planning Software |
| Energy and Resource Optimization Software |
| Large Enterprises |
| Small and Medium Enterprises |
| IT and Telecommunications |
| Manufacturing |
| Banking, Financial Services, and Insurance (BFSI) |
| Government and Public Sector |
| Energy and Utilities |
| Healthcare |
| Retail and E-Commerce |
| Construction and Infrastructure |
| Other End User Industries |
| By Offering | Software |
| Services | |
| By Deployment | Cloud-Based |
| On-Premise | |
| Hybrid | |
| By Solution Type | Carbon Management and Accounting Software |
| ESG Reporting and Compliance Software | |
| Sustainability Data Management Platforms | |
| Decarbonization Planning Software | |
| Energy and Resource Optimization Software | |
| By Enterprise Size | Large Enterprises |
| Small and Medium Enterprises | |
| By End-Use Industry | IT and Telecommunications |
| Manufacturing | |
| Banking, Financial Services, and Insurance (BFSI) | |
| Government and Public Sector | |
| Energy and Utilities | |
| Healthcare | |
| Retail and E-Commerce | |
| Construction and Infrastructure | |
| Other End User Industries |
Key Questions Answered in the Report
What is the current and forecast value of Japan green IT software demand?
The Japan green IT software market was valued at USD 0.82 billion in 2025, reached USD 0.95 billion in 2026, and is projected to reach USD 2.24 billion by 2031 at a CAGR of 18.71% from 2026 to 2031.
Which deployment model is leading adoption in Japan?
Cloud-based deployment leads the field with 63.41% share in 2025 and is also projected to post the fastest growth at 19.96% CAGR through 2031.
Which solution type is growing the fastest in this space?
Carbon management and accounting software is expected to expand at an 21.11% CAGR through 2031, while energy and resource optimisation software remained the largest solution type in 2025.
Why are SMEs becoming more important for software vendors in Japan?
SMEs are projected to grow at 21.63% CAGR because larger customers are pushing supplier networks to provide better Scope 3 and sustainability data.
Which end-user sector contributes the most today?
Manufacturing led with a 27.43% share in 2025 because of its energy intensity, complex operations, and wider reporting needs across plants and supply chains.
How competitive is the vendor landscape in Japan?
The vendor base is moderately fragmented, with domestic specialists strong in localized workflows and global software vendors stronger in large enterprise accounts tied to existing ERP relationships.