Japan Government And Education Logistics Market Size and Share
Market Overview
| Study Period | 2019 - 2030 |
|---|---|
| Forecast Data Period | 2025 - 2030 |
| Historical Data Period | 2019 - 2023 |
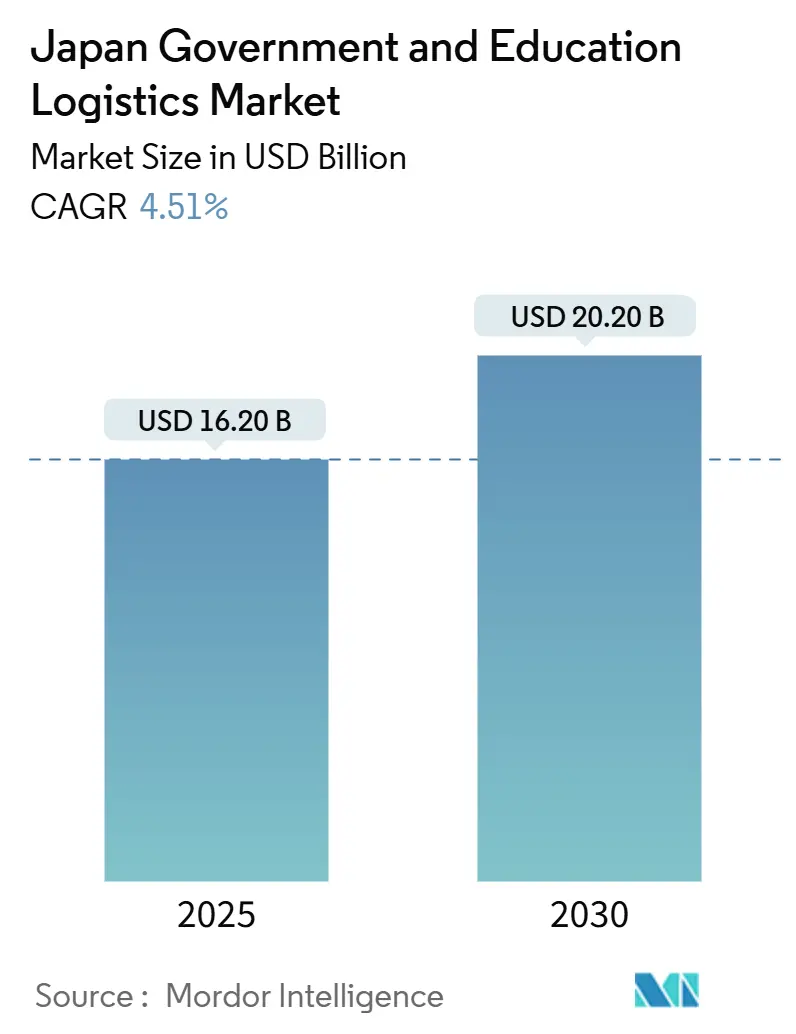
| Market Size (2025) | USD 16.20 Billion |
| Market Size (2030) | USD 20.20 Billion |
| Growth Rate (2025 - 2030) | 4.51% CAGR |
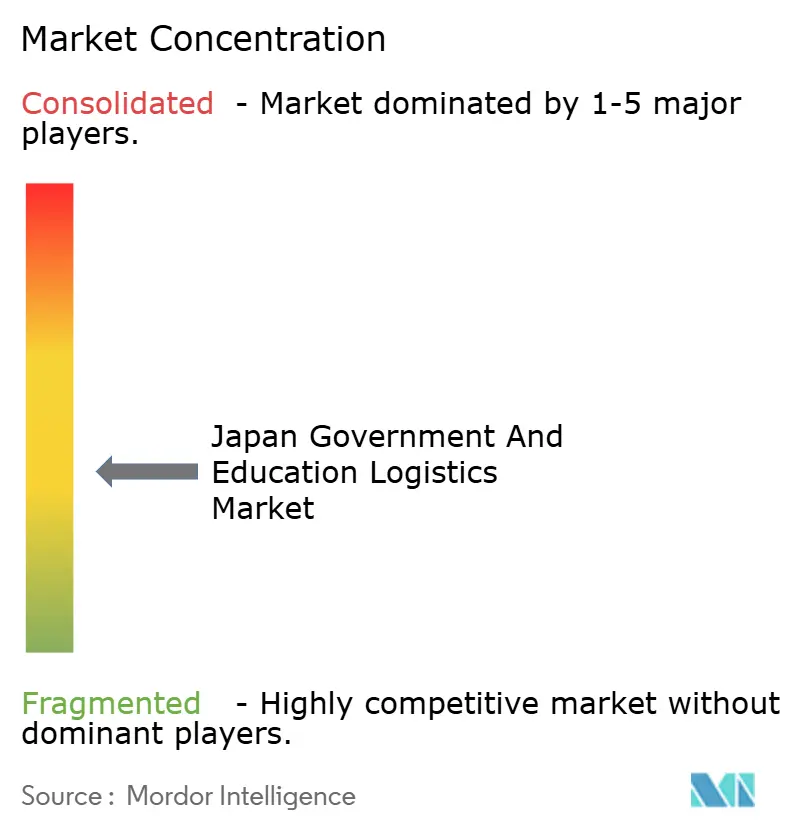
| Market Concentration | Medium |
Major Players *Disclaimer: Major Players sorted in no particular order Image © Mordor Intelligence. Reuse requires attribution under CC BY 4.0. | |
Japan Government And Education Logistics Market Analysis by Mordor Intelligence
The Japan Government And Education Logistics Market size is estimated at USD 16.20 billion in 2025, and is expected to reach USD 20.20 billion by 2030, at a CAGR of 4.51% during the forecast period (2025-2030).
A 14% driver-hour capacity gap triggered by April 2024 overtime limits continues to reshape service models, favoring providers that automate sortation, route planning, and inventory handling. Transportation services remain the axis of activity, yet value-added services especially compliance tracking, temperature-controlled storage, and reverse logistics—are advancing fastest as digital procurement rolls out across agencies and schools. Emergency-preparedness spending under the National Resilience Plan, combined with rising STEAM equipment demand, is prompting fresh warehouse builds, regional hub expansion, and drone trials to reach isolated communities. Competition is moderate; domestic leaders still benefit from security clearances, but niche segments such as laboratory logistics now attract foreign players able to plug into global supply chains.
Key Report Takeaways
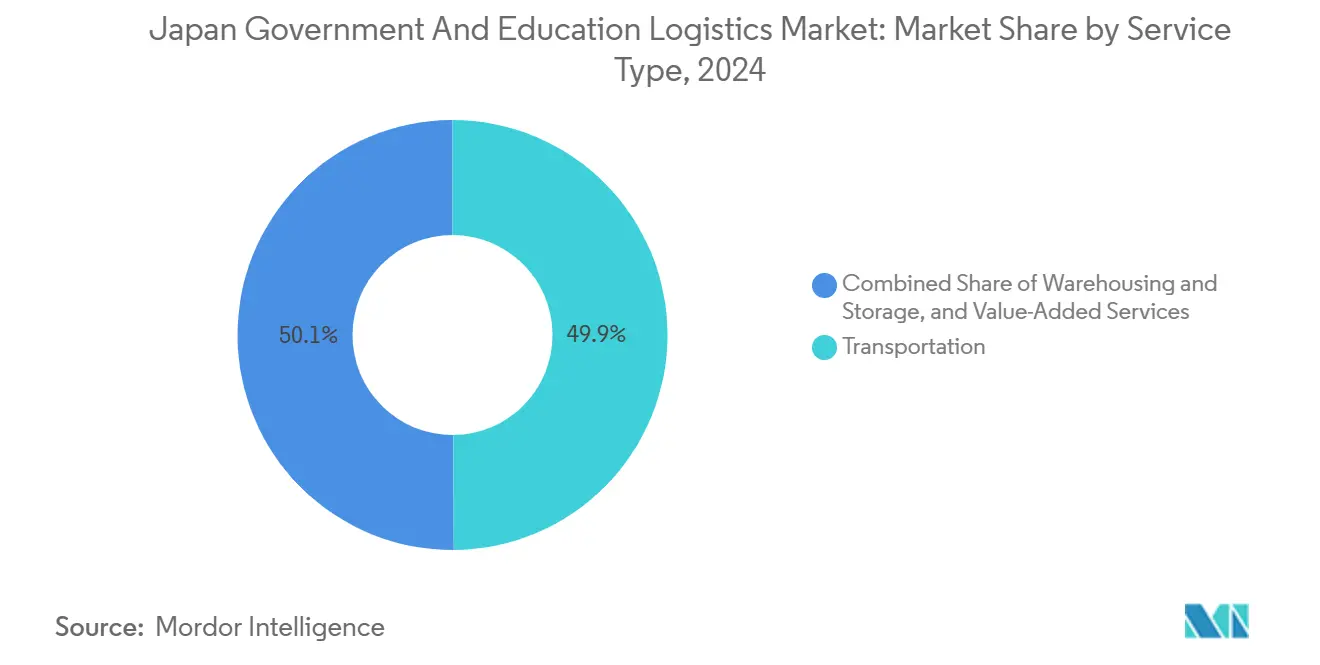
- By service type, transportation commanded 49.90% of Japan Government and Education Logistics market share in 2024, while value-added services are projected to post a 6.20% CAGR to 2030.
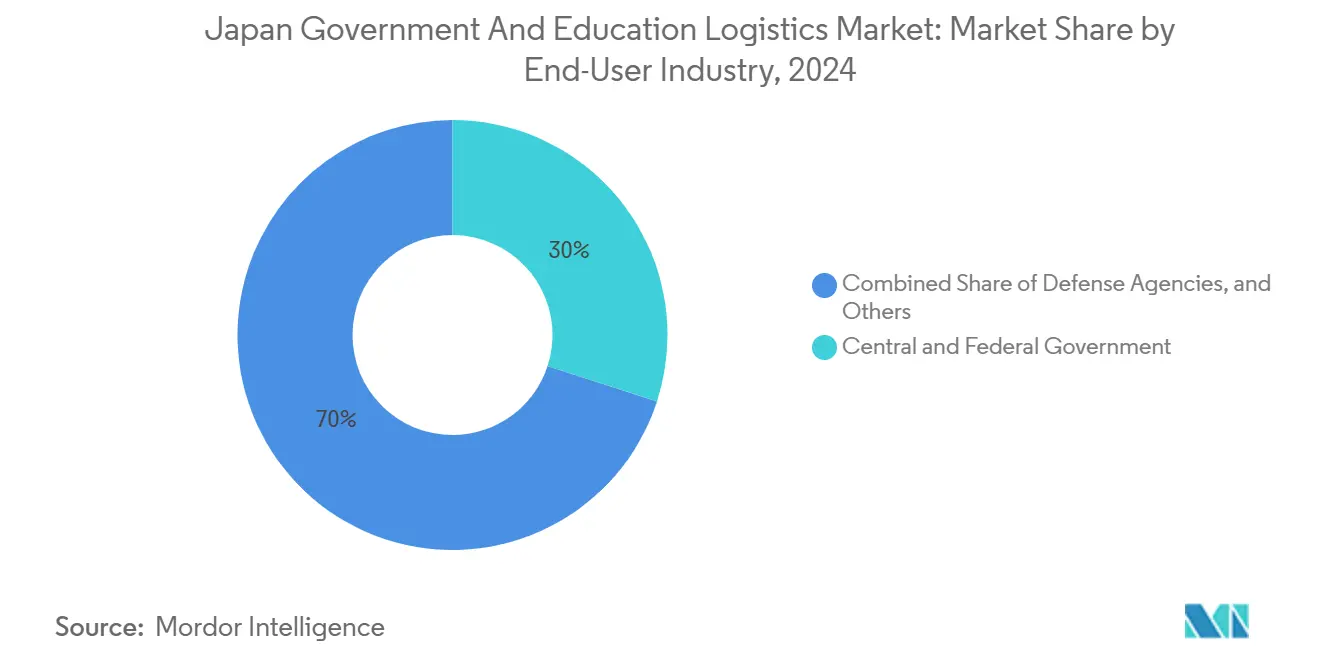
- By end-user, central and federal government agencies held a 30.00% share of the Japan Government and Education Logistics market size in 2024, whereas higher-education institutions are set to expand at a 5.80% CAGR through 2030.
National developments in Japan connect differently with activity unfolding across other parts of the world. In the global government and education logistics market coverage, Mordor Intelligence integrates these into a single analytical framework.
Japan Government And Education Logistics Market Trends and Insights
Drivers Impact Analysis*
| Driver | (~) % Impact on CAGR Forecast | Geographic Relevance | Impact Timeline |
|---|---|---|---|
| Government push for logistics efficiency and 2024 driver-hour reforms | +1.2% | National, with early adoption in Tokyo, Osaka, Nagoya metropolitan areas | Short term (≤ 2 years) |
| Digital-transformation mandates in public administration and education | +0.9% | National, led by central government agencies, cascading to prefectures | Medium term (2-4 years) |
| Disaster-preparedness spending for emergency-response logistics | +0.8% | National, concentrated in earthquake-prone regions and coastal areas | Long term (≥ 4 years) |
| STEAM equipment and digital-textbook distribution surge | +0.7% | National, with higher intensity in urban school districts | Medium term (2-4 years) |
| Expansion of e-procurement and consolidated purchasing contracts | +0.5% | National, with faster adoption in central government and major prefectures | Medium term (2-4 years) |
| Aging-infrastructure renewal requiring specialised reverse logistics | +0.4% | National, concentrated in older urban areas and legacy government facilities | Long term (≥ 4 years) |
| Source: Mordor Intelligence | |||
Government Push for Logistics Efficiency and 2024 Driver-Hour Reforms
Revised Labor Standards Act provisions introduced in April 2024 limit truck-driver overtime to 960 hours a year, generating a 14% capacity shortfall that has forced public buyers to bundle shipments and award multi-department contracts. Providers responded by investing in automation; Nippon Express earmarked JPY 100 billion (USD 708.79 million) for autonomous vehicles and AI-driven sortation dedicated to the Japan Government and Education Logistics market. Warehouses now deploy robotic pick-and-place systems to offset labor constraints, and route optimization is programmed daily against real-time road conditions to squeeze more deliveries inside capped driver hours. Larger average order values help agencies curb freight frequency, while automated compliance reporting satisfies audit requirements in a fraction of former processing time. The immediate payoff is lower per-shipment cost, but the deeper impact is a permanent shift toward data-rich, platform-integrated logistics contracts[1]“Logistics Efficiency Promotion Act Implementation Guidelines,” MLIT Japan, mlit.go.jp.
Digital-Transformation Mandates in Public Administration and Education
The Digital Agency’s 2024 launch of the Digital Marketplace platform standardizes government purchasing and creates end-to-end visibility into shipments, spare-part forecasts, and maintenance schedules. Parallel GIGA School Phase 2 deployments require distribution of tablets, displays, and network hardware across 30,000 schools; reverse logistics for repair cycles has become a core value-added service as devices rotate through refresh and disposal. Logistics firms now operate certified clean rooms that erase user data and reimage devices before redeployment, an essential safeguard for agencies governed by strict data-protection statutes. Dai Nippon Printing and Lenovo’s lifecycle-management service demonstrates how co-location of IT technicians inside logistics hubs speeds turnaround while keeping sensitive assets onshore. Cloud-migration programs deepen specialization: racks of legacy storage drives move under sealed, chain-of-custody protocols, with location pings automatically uploaded to the Digital Marketplace for real-time compliance records[2]“Revised Labor Standards Act: Transportation Sector Implementation,” MHLW Guidelines, mhlw.go.jp.
Disaster-Preparedness Spending for Emergency-Response Logistics
The JPY 20 trillion (USD 141.75 billion) National Resilience Plan (2026-2030) funds earthquake-resistant storage, backup power, and pre-positioned inventory across all 47 prefectures, escalating demand for temperature-controlled and redundant warehousing tailored to the Japan Government and Education Logistics market. Contracts now stipulate 72-hour fulfillment for relief supplies, driving providers to stage fleets of satellite-equipped trucks, modular cold-chain containers, and mobile command centers. SG Holdings’ investment in autonomous, disaster-ready vehicles illustrates a pivot toward resilient networks capable of bypassing damaged roads through drone or inland-waterway contingencies. Prefecture-level exercises test hub-and-spoke designs every quarter, feeding telemetry into government dashboards that score providers on speed, safety, and inventory accuracy. The program’s long horizon incentivizes multiyear capacity building, cushioning providers against cyclical budget lulls elsewhere in public spending.
STEAM Equipment and Digital-Textbook Distribution Surge
Expanded STEAM curricula mandate nationwide delivery of lab instruments, sensors, and 3-D printers, many of which require temperature control and calibrated handling. Digital textbook distribution scales device shipments into the millions, each tagged for real-time tracking and serialized inventory control. White-glove crews transport spectrometers and high-resolution microscopes directly to campus labs, complete install-and-calibrate services, and upload acceptance reports to agency portals within 24 hours. Asset-tagging enables perpetual inventory audits, while reverse-logistics contracts for end-of-lease pickups ensure secure data eradication. The surge creates recurring revenue streams for providers that couple physical moves with specialized maintenance and compliance services recognized under government grant conditions.
Restraints Impact Analysis*
| Restraint | (~) % Impact on CAGR Forecast | Geographic Relevance | Impact Timeline |
|---|---|---|---|
| Driver shortage and overtime caps constraining capacity | -0.8% | National, most severe in rural prefectures and aging communities | Short term (≤ 2 years) |
| Budget-cycle delays and fiscal constraints in public sector | -0.6% | National, with variations across prefecture fiscal health | Medium term (2-4 years) |
| Fragmented legacy IT systems across local governments | -0.4% | National, more pronounced in smaller municipalities and rural areas | Medium term (2-4 years) |
| Security-clearance rules limiting foreign-owned providers | -0.3% | National, with stricter enforcement for defense and sensitive agencies | Long term (≥ 4 years) |
| Source: Mordor Intelligence | |||
Driver Shortage and Overtime Caps Constraining Capacity
The same reforms that raised labor standards intensified regional shortfalls; rural prefectures now experience waitlists for time-critical shipments as younger drivers migrate to urban carriers offering higher wages. Government loads, already bound by security-clearance checks, feel amplified strain during spring semester starts and typhoon seasons. Providers accelerate automation—self-parking trailers, pallet robots, AI-cluster routing but deployment timeframes leave a near-term service gap. Some agencies employ staggered delivery windows, stretching non-urgent loads across wider calendars and leasing modular storage to mitigate bottlenecks. The constraint is temporary yet impactful enough to shave 0.8% from forecast CAGR, especially where alternative modes such as rail or inland waterways are limited[3]“Driver Working Hours Reform Impact Assessment 2024,” Japan Trucking Association, jta.or.jp .
Budget-Cycle Delays and Fiscal Constraints in Public Sector
Six-month average tender-to-award cycles place working-capital risk on logistics firms fronting assets and labor against unpredictable demand. Lower-tier municipalities often default to lowest-bid scoring, handicapping providers that invest heavily in automation or compliance infrastructure. Payment lags coincide with fiscal year-end, pressing smaller carriers to refinance or exit. Consolidated national contracts partly buffer the Japan Government and Education Logistics market, yet bottlenecks at ports and distribution centers persist because infrastructure upgrades trail technology adoption. Larger incumbents with dedicated government-relations units widen share by absorbing administrative overhead that encumbers new entrants[4]“Government Procurement Cycle Analysis,” Ministry of Finance, mof.go.jp .
*Our forecasts treat driver/restraint impacts as directional, not additive. The impact forecasts reflect baseline growth, mix effects, and variable interactions.
Segment Analysis
By Service Type: Transportation Dominance Amid Value-Added Growth
Transportation controlled 49.90% of Japan Government and Education Logistics market share in 2024, anchored by road networks that link ministries, schools, and disaster-stock sites across the archipelago. Rail and air lift supplement urgent moves—vaccines, seismic sensors, election materials—while coastal shipping supports outlying islands. Investments in green fleets and low-emission fuels position incumbents for carbon-target tenders scheduled from 2026 onward.
Value-added services are pacing at a 6.20% CAGR, reshaping the Japan Government and Education Logistics market size narrative for providers offering secure device destruction, chain-of-custody tracking, and climate-controlled biostorage. These services bundle compliance documentation directly into agency ERP systems, eliminating manual reconciliation and lifting service premiums. Supply-chain digitization routines API-fed shipment milestones, blockchain pilots, IoT sensor data—boost win rates where audit transparency influences bid scores. As disaster-preparedness inventories move toward distributed micro-warehouses, remote monitoring and predictive maintenance of stock become additional revenue channels.


By End-User: Federal Leadership with Education Acceleration
Central and federal agencies held 30.00% of the Japan Government and Education Logistics market size in 2024, leveraging standardized five-year master contracts that reward providers with multilocation reach and top-tier security standings. Defense sub-agencies, though smaller in value, impose the highest compliance costs, prompting logistics firms to ring-fence operations within classified facilities where only cleared personnel may work.
Higher-education institutions, posting a 5.80% CAGR, inject fresh complexity into the Japan Government and Education Logistics market through lab relocations, international equipment imports, and joint-research payloads requiring ATA Carnet processing. Universities offload campus mailrooms, food service pallets, and hazardous-material handling to logistics partners, blending traditional freight with on-site support technicians. K-12 public schools sustain steady growth via the GIGA program, yet competitive tenders increasingly weight sustainability credentials, nudging providers to electrify last-mile fleets serving urban districts.
Geography Analysis
Japan Government and Education Logistics market activity clusters along the Tokyo-Osaka corridor, which accounts for 45% of total volume thanks to dense administrative, academic, and corporate footprints. Superior rail and expressway grids here shorten lead times and foster same-day service benchmarks that rural prefectures cannot match. Recent warehouse construction in Chiba and Kanagawa adds seismic isolation and solar microgrids, ensuring continuity during blackouts.
Secondary cities such as Sendai, Hiroshima, and Fukuoka now host regional hubs designed to decouple disaster response from single-node dependence. Earthquake-prone Tohoku prefectures favor elevated racking systems and multi-access roads that bypass potential bridge failures, while coastal regions install flood-proof bulkheads at logistics parks. Northern prefectures combat snow-bound roads with heated loading docks and high-visibility scheduling that shifts sensitive freight to rail during blizzard alerts.
Okinawa and remote islands elevate multimodal service premiums in the Japan Government and Education Logistics market; air-sea combinations are standard, and providers experiment with drone drops for medical supplies where ferries are weather-bound. Historical growth at 3.8% between 2020-2024 trails the 4.51% forecast for 2025-2030, underscoring how digitalization and resilience programs extend logistics modernization into previously underserved geographies.
Mordor Intelligence's coverage of the government and education logistics market extends across other regions including Europe, Middle East, and Africa, while country-specific intelligence is also available for South Korea, India, Germany, China, Russia, and Canada, each offering a view on the jurisdiction-level dynamics as applicable.
Competitive Landscape
Domestic majors such as Nippon Express, Yamato Holdings, and SG Holdings sustain advantage through legacy ties, nationwide footprints, and clearance-ready staff pools. Government agencies now stipulate IoT-enabled tracking and instant compliance dashboards; consequently, technology alliances dictate bid competitiveness. Nippon Express’ AI-directed Chiba facility speeds sortation 35% over manual benchmarks, enhancing its margin on fixed-rate contracts. Yamato’s Government Digital Logistics Platform pushes real-time milestone data into 200+ agency systems, cutting administrative processing by 40%.
M&A accelerates specialization: Seino’s cold-chain acquisition augments vaccine-distribution credentials, while Mitsui-Soko’s blockchain pilot elevates audit trail integrity. Foreign entrants probe niches where global supply-chain savvy matters—laboratory equipment imports, international university collaborations—but security-clearance ceilings keep defense and classified loads primarily with domestic firms.
Competition also tilts on sustainability. Konoike’s carbon-neutral Osaka hub and Sankyu’s ISO 27001 certification speak to procurement scorecards that now reward environmental and information-security compliance. The Japan Government and Education Logistics market therefore trends toward hybrid competition: incumbents defend broad contracts, while tech-forward challengers capture high-spec subsegments.
Japan Government And Education Logistics Industry Leaders
Nippon Express Holdings Co., Ltd.
Yamato Holdings Co., Ltd.
SG Holdings Co., Ltd. (Sagawa Express)
Japan Post Co., Ltd. (JP Logistics)
Seino Holdings Co., Ltd.
- *Disclaimer: Major Players sorted in no particular order

Recent Industry Developments
- January 2025: Nippon Express completed a JPY 15 billion (USD 106.31 million) automated center in Chiba featuring AI inventory control and seismic design for government fulfillment.
- December 2024: SG Holdings secured a five-year, JPY 8.2 billion (USD 58.12 million) device-distribution contract under GIGA School Phase 2, including reverse logistics and secure data wipes.
- November 2024: Yamato launched a Government Digital Logistics Platform that interfaces with the Digital Marketplace, slicing document processing times by 40%.
- October 2024: Japan Post partnered with the Cabinet Office to pre-position emergency supplies at 1,200 post offices and deploy mobile command centers for disasters.


Japan Government And Education Logistics Market Report Scope
| Transportation | Road |
| Rail | |
| Air | |
| Sea and Inland Waterway | |
| Warehousing and Storage | |
| Value-Added Services |
| Central/Federal Government |
| State and Local Government |
| Defense Agencies |
| Public Education (K-12) |
| Higher Education Institutions |
| Others |
| By Service Type | Transportation | Road |
| Rail | ||
| Air | ||
| Sea and Inland Waterway | ||
| Warehousing and Storage | ||
| Value-Added Services | ||
| By End-User | Central/Federal Government | |
| State and Local Government | ||
| Defense Agencies | ||
| Public Education (K-12) | ||
| Higher Education Institutions | ||
| Others |


Key Questions Answered in the Report
How large is the Japan Government and Education Logistics market in 2025?
It is valued at USD 16.2 billion and is forecast to reach USD 20.2 billion by 2030 on a 4.51% CAGR.
Which service type leads spending in Japan’s public-sector logistics?
Transportation services hold 49.90% of 2024 spending, reflecting the core need to move goods among agencies and schools.
What segment is growing fastest?
Value-added services, driven by compliance tracking and reverse logistics, are projected to grow at 6.20% CAGR to 2030.
Why are higher-education institutions important for providers?
Universities outsource complex lab-equipment and campus-logistics demands, expanding their spend at a 5.80% CAGR.
How are driver-hour reforms affecting capacity?
The 960-hour overtime cap created a 14% labor shortfall, pushing providers to automate and agencies to consolidate shipments.
What role does disaster preparedness play?
A JPY 20 trillion (USD 141.75 billion) resilience program funds warehousing, mobile command centers, and drone logistics, adding long-term demand.
Page last updated on:


