
Asia-Pacific Data Center GPU Market Size and Share
Market Overview
| Study Period | 2020 - 2031 |
|---|---|
| Forecast Data Period | 2026 - 2031 |
| Base Year Market Size (2025) | USD 17.89 Billion |
| Market Size (2026) | USD 22.15 Billion |
| Market Size (2031) | USD 47.14 Billion |
| Growth Rate (2026 - 2031) | 16.30 % |
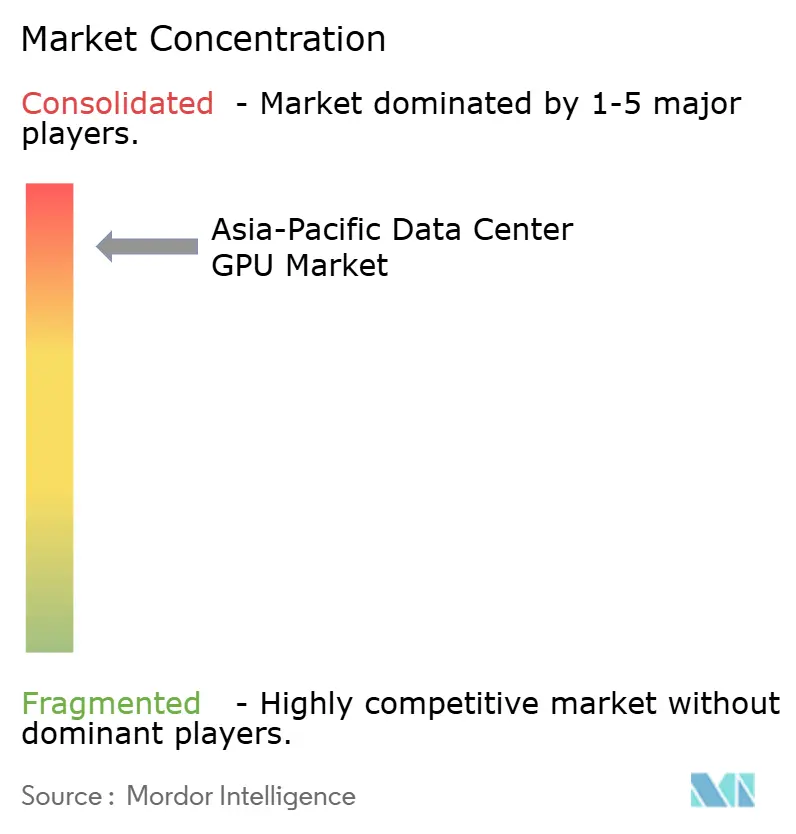
| Market Concentration | High |
Major Players *Disclaimer: Major Players sorted in no particular order Image © Mordor Intelligence. Reuse requires attribution under CC BY 4.0. | |
Asia-Pacific Data Center GPU Market Analysis by Mordor Intelligence
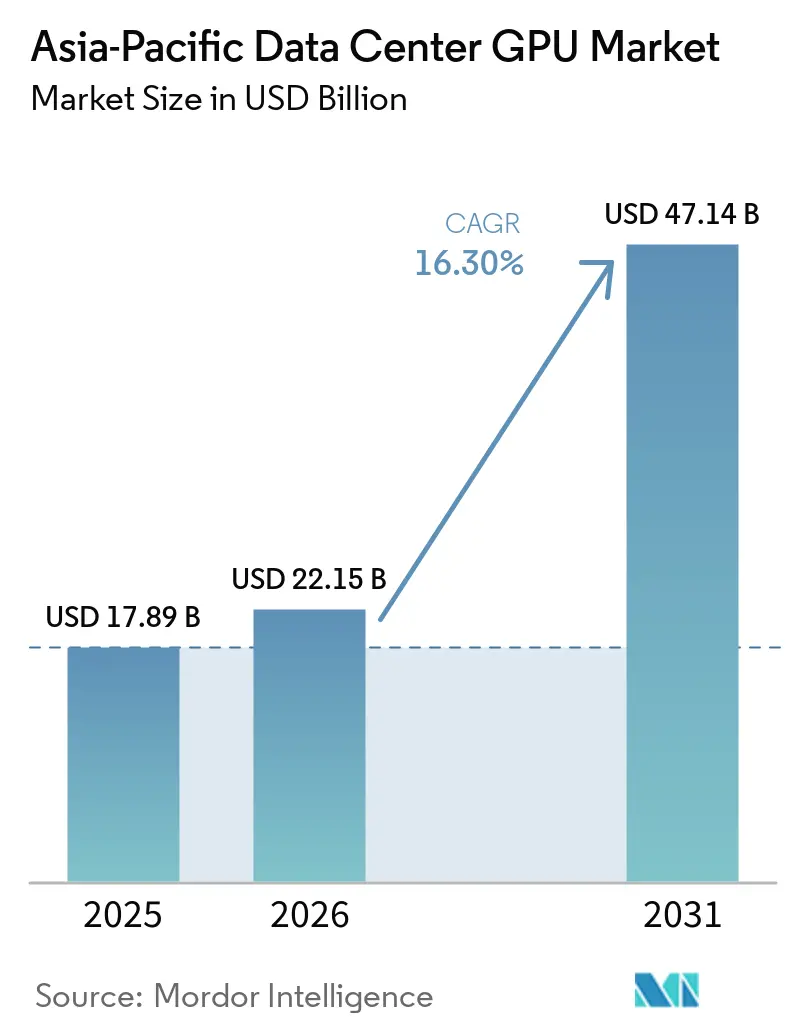
The Asia-Pacific data center GPU market size is projected to expand from USD 17.89 billion in 2025 and USD 22.15 billion in 2026 to USD 47.14 billion by 2031, registering a 16.3% CAGR between 2026 and 2031. Solid demand for generative-AI services, national semiconductor policies, and emerging edge-computing use cases sustain this momentum. Hyperscale cloud providers keep hardware utilization near 90%, driving volume orders that dominate regional GPU procurement. At the same time, enterprises in regulated industries are moving inference workloads on-premises to comply with local data-sovereignty rules, opening a parallel growth track. Chip export curbs, especially those affecting China, are forcing buyers to diversify vendors and embrace domestic silicon, causing a split in price-performance benchmarks. Liquid cooling, now standard in new-build facilities across China, Japan, and India, is pushing rack densities to 200 kilowatts while lowering megawatt-hour consumption per inference job.
Key Report Takeaways
- By deployment type, cloud data centers led with 63.45% of the Asia-Pacific data center GPU market share in 2025; edge facilities posted the fastest 17.88% CAGR through 2031.
- By GPU type, inference accelerators captured 58.77% of the Asia-Pacific data center GPU market share in 2025, and the same segment is forecast to grow at a 17.24% CAGR through 2031.
- By interconnect, PCIe-based designs retained 66.89% of the Asia-Pacific data center GPU market share in 2025, whereas high-bandwidth interconnect hardware is expected to grow at a 17.76% CAGR during 2026-2031.
- By workload, AI and ML workloads held a 64.33% share of the Asia-Pacific data center GPU market in 2025, and the data analytics deployments is expected to register the highest 18.12% CAGR to 2031.
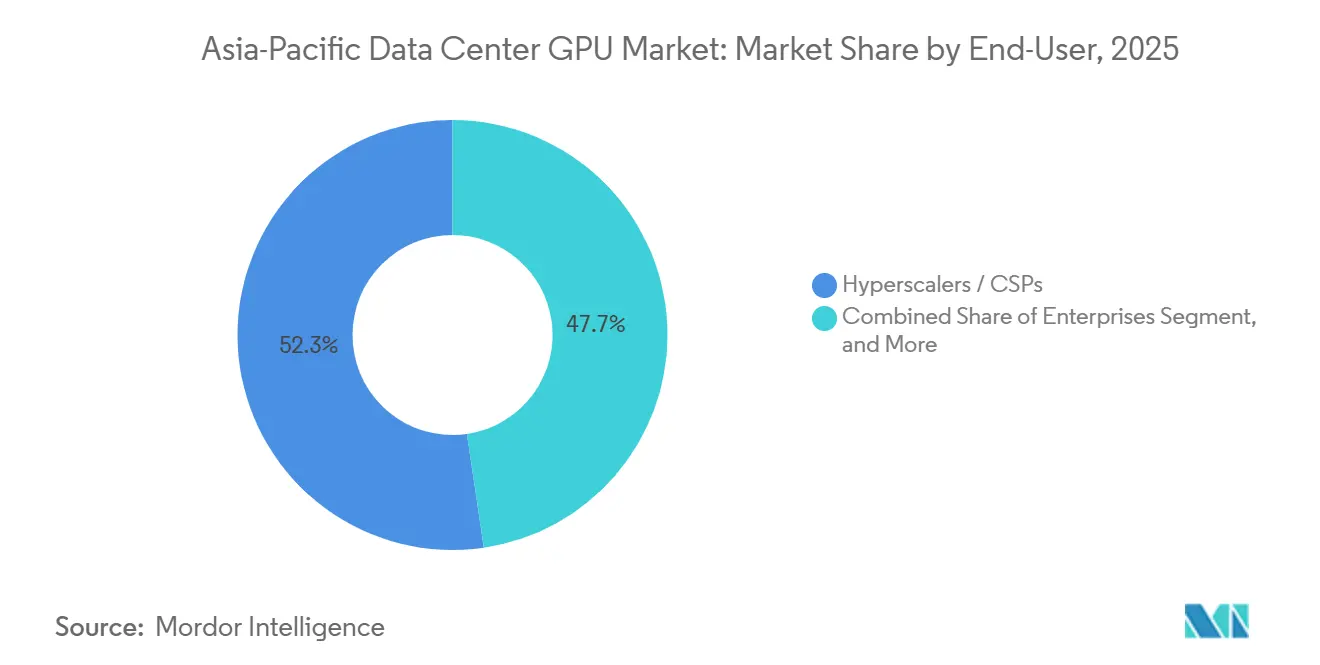
- By end user, hyperscalers commanded 52.33% of the Asia-Pacific data center GPU market share in 2025; enterprise users represent the fastest-growing customer base, with a 17.53% CAGR through 2031.
- By country, China remained the largest geography with a 46.77% share in 2025, whereas India posted the fastest 18.24% CAGR during the forecast horizon.
Note: Market size and forecast figures in this report are generated using Mordor Intelligence’s proprietary estimation framework, updated with the latest available data and insights as of January 2026.
Market Trends and Insights
Drivers Impact Analysis of Asia-Pacific Data Center GPU Market*
| DRIVER | (~) % IMPACT ON CAGR FORECAST | GEOGRAPHIC RELEVANCE | IMPACT TIMELINE |
|---|---|---|---|
| Surge in AI Training Workloads in Hyperscale Cloud Data Centers | +4.2% | China, India, Japan, South Korea, Southeast Asia spillover | Medium term (2–4 years) |
| Rise of Sovereign AI Clouds Demanding In-Region GPU Clusters | +3.1% | China, India, Japan | Long term (≥ 4 years) |
| Government Incentives for Domestic AI Semiconductor Manufacturing in Asia-Pacific | +2.8% | Japan, India, South Korea, China | Long term (≥ 4 years) |
| Expansion of Edge Data Centers for 5G and IoT Traffic | +2.3% | South Korea, Japan, China tier-2 cities, Singapore, Jakarta | Medium term (2–4 years) |
| Adoption of Liquid Cooling Enabling Higher GPU Rack Density | +1.6% | China, Japan | Short term (≤ 2 years) |
| Corporate Sustainability Targets Driving GPU Consolidation for Energy Efficiency | +1.1% | Multinationals in Japan, South Korea | Medium term (2–4 years) |
| Source: Mordor Intelligence | |||
Surge in AI Training Workloads in Hyperscale Cloud Data Centers
Hyperscale providers are rolling out clusters with more than 100,000 accelerators to support trillion-parameter model training. Microsoft and OpenAI’s landmark USD 100 billion Stargate project, though U.S.-based, set the bar for regional players racing to reach comparable scale. Tencent Cloud expanded its fleet in 2025 to meet skyrocketing demand from domestic LLM developers, and Baidu’s Wenxin platform added continuous batches of H100 cards to keep sub-second response for 200 million daily users. Regional capital-expenditure outlays are on pace to claim a significant share of the global USD 527 billion hyperscaler budget in 2026 as cloud operators position Asia-Pacific as the world’s largest AI compute hub.[1] Cloud-delivered GPU-as-a-Service products shorten launch cycles but concentrate pricing power in a handful of vendors, pressuring smaller rivals unable to secure volume contracts.
Rise of Sovereign AI Clouds Demanding In-Region GPU Clusters
Governments now require sensitive AI workloads to run on domestic infrastructure. Japan’s Digital Agency, working with Fujitsu and Microsoft, committed JPY 1.6 trillion (USD 10.3 billion) in 2024 to build sovereign cloud zones. India’s Semiconductor Mission 2.0 allocated USD 10.8 billion the same year, aiming to reduce reliance on imported GPUs by 40% before 2030.[2] China issued directives in 2025 mandating that government AI inference migrate to Ascend GPUs by 2027, guaranteeing thousands of annual domestic shipments. Such parallel architectures double infrastructure outlays because providers must maintain dedicated pools for sovereign and commercial tenants, diluting economies of scale.
Government Incentives for Domestic AI Semiconductor Manufacturing in the Asia-Pacific
Tax credits, grants, and equity investments are reshaping fabrication footprints. Japan’s Ministry of Economy, Trade and Industry carved out JPY 1.23 trillion (USD 7.9 billion) in 2024 to fund two-nanometer logic and advanced packaging plants.[3] India extended USD 2.3 billion in production-linked incentives in 2025, triggering Micron’s USD 2.75 billion packaging facility, which will handle GPU modules by 2028. South Korea’s KRW 26 trillion (USD 19.4 billion) program underwrites HBM capacity expansions at SK Hynix and Samsung, which already command a significant share of global HBM3e supply. While these moves lower import risk and anchor supply locally, they could lead to idle lines if demand plateaus or export restrictions persist.
Expansion of Edge Data Centers for 5G and IoT Traffic
Latency-critical services from autonomous vehicles to industrial robots require computing closer to users. SK Telecom outfitted 120 base stations with GPUs in 2025, enabling sub-10-millisecond surveillance analytics.[4] NTT Docomo paired A100 GPUs with factory robots in Japan, slashing defect-detection times by 80%.[5] China Mobile targets 500 GPU-equipped mini-facilities by 2027, spanning logistics and healthcare workloads. Edge deployments usually host 8-64 cards, are tuned for inference, and require fleet-wide orchestration tools to manage dispersed sites with limited on-site engineers.
Restraints Impact Analysis of Asia-Pacific Data Center GPU Market*
| RESTRAINT | (~) % IMPACT ON CAGR FORECAST | GEOGRAPHIC RELEVANCE | IMPACT TIMELINE |
|---|---|---|---|
| Export Control Regulations Limiting Access to Latest GPUs | -2.4% | China, with knock-on effects in Southeast Asia and India | Long term (≥ 4 years) |
| High Capital Expenditure for GPU-Based Infrastructure | -1.9% | Southeast Asia, India | Medium term (2–4 years) |
| Ongoing Supply-Chain Constraints for Advanced GPU Packaging | -1.3% | Global, acute in China | Short term (≤ 2 years) |
| Skill Gap in Optimizing GPU Workloads Among Enterprise IT Teams | -0.8% | India, Southeast Asia | Medium term (2–4 years) |
| Source: Mordor Intelligence | |||
Export Control Regulations Limiting Access to Latest GPUs
Washington’s October 2023 rules block H200-class GPU sales to China, capping performance ceilings at H100 equivalents. Tariffs of 25% imposed in 2025 further inflate acquisition prices. ByteDance and Alibaba responded by booking 600,000 Huawei Ascend 910C units for 2025, yet each chip delivers only 60-70% of the H100 transformer's throughput, prompting over-provisioning. License processing delays of six to twelve months amplify planning uncertainty for universities and research labs.
High Capital Expenditure for GPU-Based Infrastructure
A single H100 costs USD 30,000-40,000 in 2025, meaning an 80-card rack tops USD 3 million before interconnects and liquid cooling. Retrofit cooling raises costs by up to USD 1 million per rack, a barrier for regional enterprises that lack access to low-cost debt. While Yotta Data Services funded USD 2 billion for India’s first GPU megahub, smaller peers cannot match hyperscaler economies, resulting in utilization gaps and three-to-five-year payback windows.
*Our forecasts treat driver/restraint impacts as directional, not additive. The impact forecasts reflect baseline growth, mix effects, and variable interactions.
Asia-Pacific Data Center GPU Market Segment Analysis
By Deployment Type:
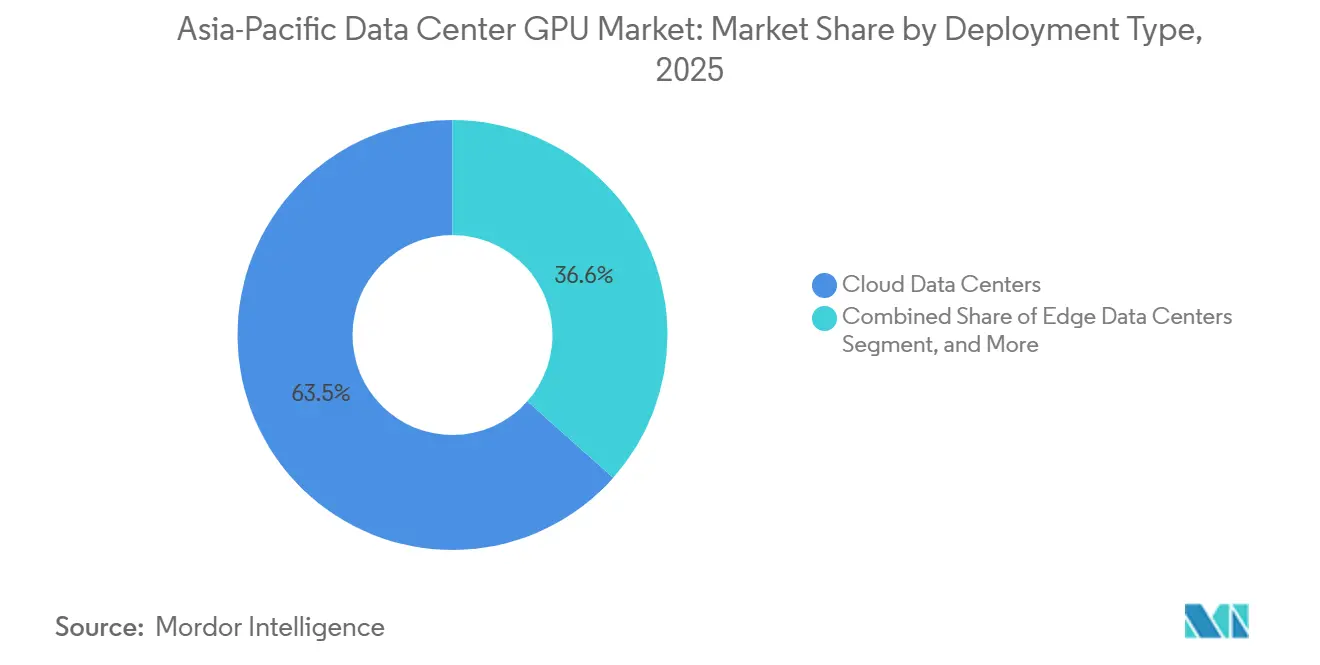
Cloud Dominance Meets Edge AccelerationCloud venues accounted for 63.45% of the Asia-Pacific data center GPU market share in 2025, reflecting hyperscalers’ unmatched buying power and multitenancy economics. Edge sites, however, post a 17.88% CAGR through 2031, spurred by 5G densification that requires sub-10-millisecond response loops. The Asia-Pacific data center GPU market size tied to private enterprise data centers also expands, as banks and pharmaceutical firms internalize inference to meet data residency.
Centralized cloud clusters reach utilization above 85%, enabling price leadership, while edge rollouts monetize new latency-sensitive services such as AR wayfinding and smart-factory controls. Enterprises can keep on-prem clusters smaller while maintaining full policy control, an attractive option for confidential workloads and regions subject to stricter privacy laws.

By GPU Type:
Inference Ascendancy Reshapes ProcurementInference accelerators captured 58.77% of the Asia-Pacific data center GPU market share in 2025 and will grow at a 17.24% CAGR through 2031 as workloads migrate from model research to production. Training GPUs remain indispensable for frontier models, yet their share declines as every trained model fuels millions of inference calls.
NVIDIA’s L4 and L40S, AMD’s MI300X, and Huawei’s Ascend 310 offer lower power draw and price points than H100 training silicon. The Asia-Pacific data center GPU market for inference continues to grow, thanks to INT8 and INT4 quantization, enabling older boards to remain competitive while driving down watts per token.
By Interconnect:
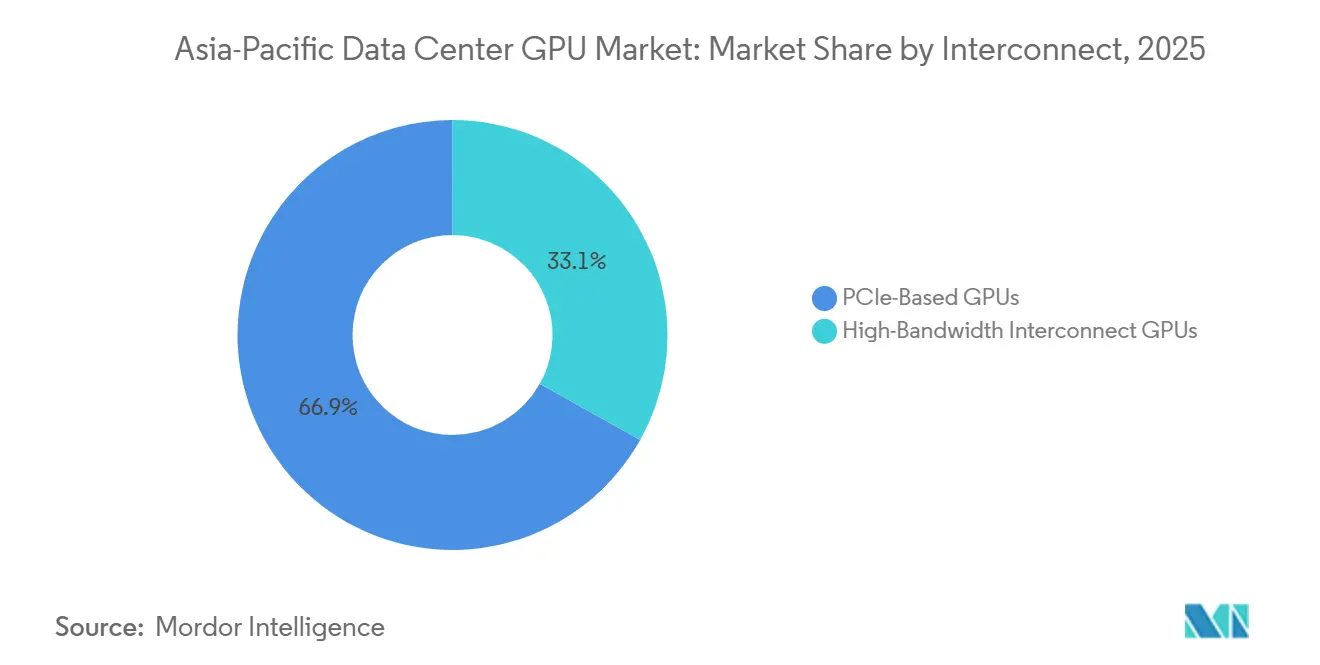
Bandwidth Economics Drive High-Speed AdoptionPCIe solutions held a 66.89% share of the Asia-Pacific data center GPU market in 2025, driven by their server compatibility and lower entry costs. Nonetheless, NVLink and Infinity Fabric configurations are projected to grow 17.76% annually by 2031, trimming training times for trillion-parameter LLMs by 40-60%.
The new Blackwell NVLink Switch provides 1.8 terabytes per second bidirectional bandwidth, allowing 576-card pods that finish epochs days faster than PCIe Gen5 equivalents. Even with 30-50% price premiums, hyperscalers adopt high-bandwidth fabrics to maximize facility throughput and reduce cloud service latency, thereby reinforcing vendor lock-in benefits.
By Workload Type:
AI & ML Dominance with Analytics SurgeAI and ML tasks accounted for 64.33% of the Asia-Pacific data center GPU market in 2025, encompassing training, inference, and computer vision. Data analytics acceleration grows at a 18.12% CAGR to 2031 as enterprises migrate petabyte-scale warehouses to GPU-enabled SQL engines.
NVIDIA RAPIDS cut query times up to 100× in financial-trading back tests, proving the cost case for GPU analytics. Hybrid pipelines that embed ML models inside data flows blur traditional workload boundaries, pushing buyers to favor GPUs optimized for both sparse and dense computations.
By End-User:
Hyperscalers Lead, Enterprises AccelerateHyperscalers held 52.33% of the Asia-Pacific data center GPU market share in 2025, with per-card costs 30-40% below those of enterprises. Enterprise demand, however, shows a forecast CAGR of 17.53% as firms in regulated verticals seek on-prem latency and privacy controls.
Government and research institutions expand clusters for sovereign AI and exascale science, with Japan’s RIKEN selecting ARM-based GPUs for its successor supercomputer, Fugaku. Enterprises battle lower utilization while gaining bespoke scheduling, which is vital to their proprietary foundation models.
Geography Analysis
China Data Center GPU Market
China’s command of the Asia-Pacific data center GPU market remains unmatched, yet the landscape splinters as domestic hyperscalers juggle export-restricted H100 boards for training and locally produced Ascend 910C cards for inference. The State Council’s 2025 directive that government AI workloads run on homegrown silicon by 2027 guarantees a captive domestic channel that shields Huawei from foreign restrictions. Edge facilities proliferate in tier-2 cities because smaller footprints bypass strict power-allocation caps applied to mega-campuses.
India Data Center GPU Market
India’s trajectory is propelled by ambitious public funding and private capex. Yotta’s Navi Mumbai campus, commissioned in February 2026, reached 85% utilization only two months after launch, underscoring pent-up demand. AWS and Microsoft complement these domestic ventures, while Semiconductor Mission 2.0 seeds local design ecosystems, although commercial-grade GPU production remains half a decade away. Training programs for 50,000 engineers per year mitigate skills shortages that once hindered enterprise AI adoption.
East Asia, ASEAN and Oceania Data Center GPU Market
Japan and South Korea exploit vertical integration. Tokyo underwrites sovereign clouds embedding Fujitsu GPUs in secure racks, and Osaka’s new Azure zone packs 10,000 H100 cards wired with NVLink Switch fabric. Seoul leverages SK Hynix’s control of a significant share of HBM3e output to win early-access pricing for domestic hyperscalers. Singapore and Indonesia anchor Southeast Asia’s growth via Digital Edge’s 500-megawatt pipeline, whereas Australia and New Zealand focus on specialized mining and agriculture AI workloads that benefit from GPU-accelerated analytics.
Competitive Landscape
NVIDIA still owns a significant share of the Asia-Pacific data center GPU market in 2025, defending its position with CUDA’s developer ecosystem and new Blackwell B200 chips that deliver FP4 compute. AMD narrows the gap with MI300X’s HBM3 memory, winning Oracle Cloud and regional telecom pilots, yet ROCm’s smaller software library slows widescale lift-and-shift migrations. Huawei dominates sovereign segments in China by shipping Ascend 910C units in 2025, trading some raw performance for guaranteed supply and local-stack compatibility.
Intel’s Gaudi 3 enters at a price point below H100, but the ecosystem remains early-stage, limiting deployments to proof-of-concept. Regional startups Biren Technology and Moore Threads plan domestic alternatives yet face yield and packaging limitations until post-2026. Hyperscalers increasingly design in-house accelerators, such as AWS Trainium, Google TPU, and Alibaba Hanguang, to temper vendor pricing. Even so, GPUs remain the default for third-party cloud services and mixed-workload versatility.
Edge-inference niches invite mid-range challengers. NVIDIA L4, AMD MI210, and Intel Gaudi 2 square off on performance-per-watt metrics, crucial for power-constrained micro-facilities. Co-location providers market GPU-as-a-Service offerings to small and medium enterprises, abstracting capital costs while driving new volume tiers that chipmakers now court aggressively.
Asia-Pacific Data Center GPU Industry Leaders
-
Nvidia Corporation
-
Advanced Micro Devices Inc.
-
Intel Corporation
-
Huawei Technologies Co. Ltd.
-
Inspur Group
- *Disclaimer: Major Players sorted in no particular order
Asia-Pacific Data Center GPU Market Companies Covered in this Report
- Nvidia Corporation
- Advanced Micro Devices Inc.
- Intel Corporation
- Huawei Technologies Co. Ltd.
- Tencent Cloud
- Baidu Inc.
- Amazon Web Services Inc.
- Microsoft Corporation
- Google LLC
- Samsung Electronics Co. Ltd.
- Inspur Group
- Giga Computing Technology Co. Ltd.
- Super Micro Computer Inc.
- Lenovo Group Limited
- NEC Corporation
- H3C Technologies Co. Ltd.
- Fujitsu Limited
Recent Industry Developments in Asia-Pacific Data Center GPU Market
- March 2026: NVIDIA announced Asia-Pacific availability of Blackwell B200 GPUs; Tencent Cloud and Baidu reserved 50,000 units for Q4 2026 deployments.
- February 2026: Yotta Data Services completed phase-one launch of a 16,384-H100 GPU facility in Navi Mumbai, achieving more than 85% utilization in 60 days
- January 2026: Microsoft opened a GPU-dense Azure zone in Osaka with 10,000 H100 boards under its JPY 1.6 trillion (USD 0.010 trillion) partnership with Japan’s Digital Agency.
- December 2025: AMD locked a multi-year deal securing 30% of SK Hynix’s 2026 HBM3e output for MI325X shipments.
Asia-Pacific Data Center GPU Market Report Scope
The Asia-Pacific Data Center GPU Market Report is Segmented by Deployment Type (Cloud Data Centers, Enterprise/Private Data Centers, and Edge Data Centers), GPU Type (Training GPUs, and Inference GPUs), Interconnect (PCIe-Based GPUs and High-Bandwidth Interconnect GPUs), Workload Type (AI and ML, HPC, Data Analytics, and Graphics and Visualization), End-User (Hyperscalers/CSPs, Enterprises, and Government and Research), and Geography (China, Japan, South Korea, India, Southeast Asia, and Rest of Asia-Pacific). The Market Forecasts are Provided in Value (USD).
Segmentation Overview
| Cloud Data Centers |
| Enterprise / Private Data Centers |
| Edge Data Centers |
| Training GPUs |
| Inference GPUs |
| PCIe-Based GPUs |
| High-Bandwidth Interconnect GPUs |
| Artificial Intelligence (AI) and Machine Learning (ML) |
| High-Performance Computing (HPC) (non-AI scientific computing) |
| Data Analytics (database acceleration, query processing) |
| Graphics and Visualization (VDI, rendering, digital twins) |
| Hyperscalers / Cloud Service Providers |
| Enterprises |
| Government and Research Institutions |
| China |
| Japan |
| South Korea |
| India |
| Southeast Asia |
| Rest of Asia-Pacific |
| By Deployment Type | Cloud Data Centers |
| Enterprise / Private Data Centers | |
| Edge Data Centers | |
| By GPU Type | Training GPUs |
| Inference GPUs | |
| By Interconnect | PCIe-Based GPUs |
| High-Bandwidth Interconnect GPUs | |
| By Workload Type | Artificial Intelligence (AI) and Machine Learning (ML) |
| High-Performance Computing (HPC) (non-AI scientific computing) | |
| Data Analytics (database acceleration, query processing) | |
| Graphics and Visualization (VDI, rendering, digital twins) | |
| By End-User | Hyperscalers / Cloud Service Providers |
| Enterprises | |
| Government and Research Institutions | |
| By Country | China |
| Japan | |
| South Korea | |
| India | |
| Southeast Asia | |
| Rest of Asia-Pacific |
Key Questions Answered in the Report
What is the current size of the Asia-Pacific data center GPU market?
The market reached USD 22.15 billion in 2026 and is forecast to hit USD 47.14 billion by 2031, reflecting strong hyperscale and enterprise demand.
How fast is the market expected to grow?
Between 2026 and 2031, the Asia-Pacific data center GPU market is projected to register a 16.3% CAGR, driven by AI adoption, edge computing, and sovereign-cloud mandates.
Which deployment segment is expanding the quickest?
Edge data centers posted the fastest 17.88% CAGR through 2031, as 5G and IoT use cases demand sub-10-millisecond latency.
Why is India considered the fastest-growing market?
Government incentives, hyperscaler investments, and large enterprise AI rollouts push India's market to an 18.24% CAGR, the highest in Asia-Pacific.
How do export controls affect regional GPU supply?
U.S. restrictions limit China's access to top-tier GPUs, prompting procurement of domestic alternatives and influencing pricing and performance benchmarks across the region.
- Canada Data Center GPU Market
- China Data Center GPU Market
- Europe Data Center GPU Market
- France Data Center GPU Market
- Germany Data Center GPU Market
- India Data Center GPU Market
- Japan Data Center GPU Market
- Middle East and Africa Data Center GPU Market
- North America Data Center GPU Market
- Singapore Data Center GPU Market
- South Korea Data Center GPU Market
- Artificial Intelligence (AI) Data Center Market Global AI facilities demand, split by facility type, component and tier.
- Data Center Construction Market Construction across the global market, covering tier, facility size and facility type.
- Data Center Server Market Servers across all regions, split by tier, facility size and facility type.