Asia-Pacific GPU Market Size and Share
Market Overview
| Study Period | 2020 - 2031 |
|---|---|
| Forecast Data Period | 2026 - 2031 |
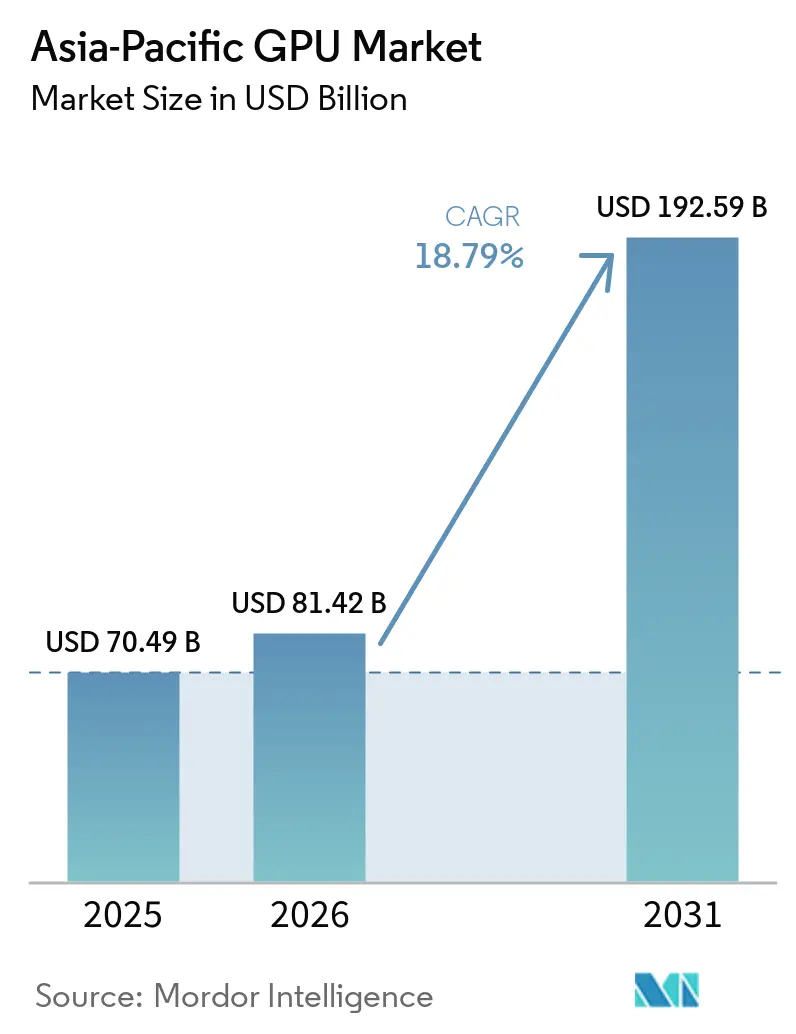
| Base Year Market Size (2025) | USD 70.49 Billion |
| Market Size (2026) | USD 81.42 Billion |
| Market Size (2031) | USD 192.59 Billion |
| Growth Rate (2026 - 2031) | 18.79% CAGR |
| Market Concentration | High |
Major Players *Disclaimer: Major Players sorted in no particular order Image © Mordor Intelligence. Reuse requires attribution under CC BY 4.0. | |
Asia-Pacific GPU Market Analysis by Mordor Intelligence
The Asia-Pacific GPU market size is expected to grow from USD 70.49 billion in 2025 to USD 81.42 billion in 2026 and is forecast to reach USD 192.59 billion by 2031 at 18.79% CAGR over 2026-2031. Rapid adoption of generative AI across cloud infrastructure, sustained capital expenditure on hyperscale data centers, and continuing government incentives for domestic semiconductor ecosystems together propel demand for high-performance accelerators. A tighter export-control environment is simultaneously spurring localization, prompting Chinese, Indian, and Southeast Asian operators to diversify silicon supply and invest in indigenous design capability. Momentum around chiplet architectures, HBM4 memory, and advanced packaging is reshaping product roadmaps, while rising electricity tariffs and substrate shortages are introducing cost volatility. Competition is bifurcating between United States incumbents that retain software moats and emerging Asia-based challengers that leverage policy support, sovereign cloud contracts, and proximity to fast-growing end markets.
Key Report Takeaways
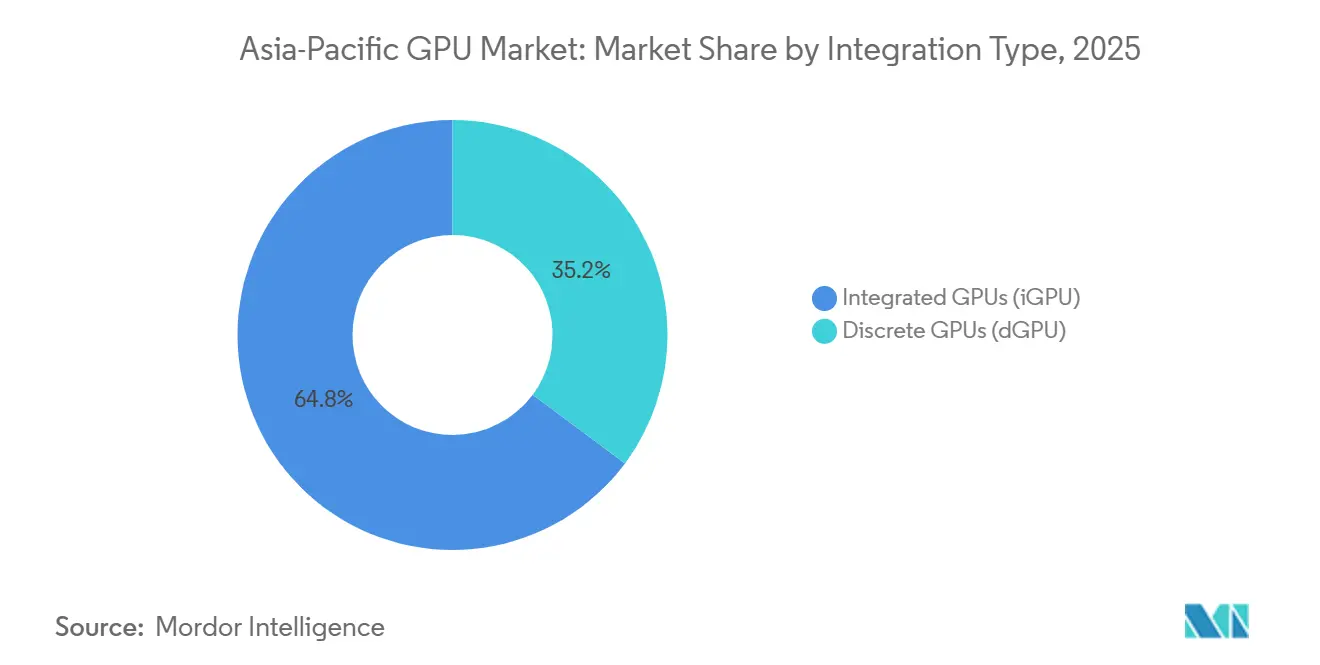
- By integration type, discrete GPUs led the Asia-Pacific GPU market with a 64.81% share in 2025 and are projected to expand at a 19.26% CAGR through 2031.
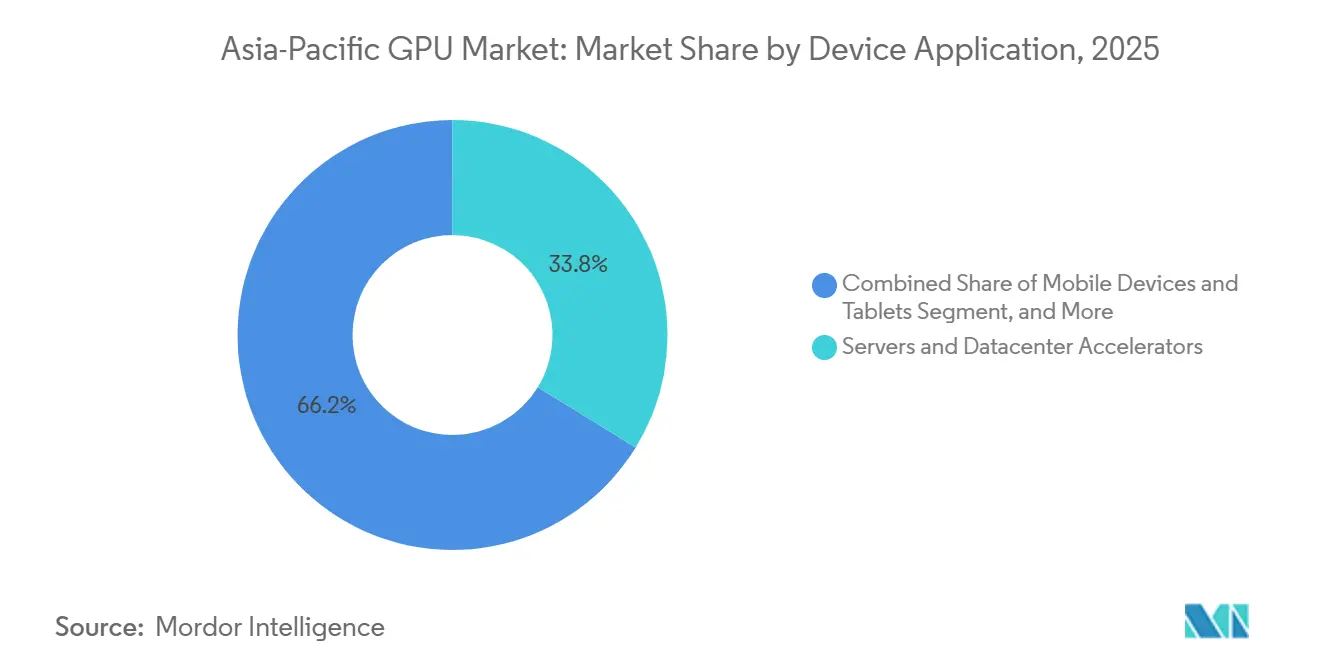
- By device application, servers and datacenter accelerators accounted for 33.76% of the Asia-Pacific GPU market size in 2025 and are advancing at a 19.33% CAGR through 2031.
- By country, China captured 47.93% share of regional revenue in 2025, whereas India is forecast to record the highest 19.44% CAGR to 2031.
Note: Market size and forecast figures in this report are generated using Mordor Intelligence’s proprietary estimation framework, updated with the latest available data and insights as of January 2026.
Asia-Pacific GPU Market Trends and Insights
Drivers Impact Analysis*
| DRIVER | (~) % IMPACT ON CAGR FORECAST | GEOGRAPHIC RELEVANCE | IMPACT TIMELINE |
|---|---|---|---|
| Rising Demand for AI Acceleration in Data Centers | +6.2% | China, India, Southeast Asia | Medium term (2-4 years) |
| Proliferation of Cloud Gaming Platforms | +3.8% | China, Japan, South Korea, Southeast Asia | Short term (≤ 2 years) |
| Expansion of Mobile Gaming Ecosystem in Asia-Pacific | +3.1% | India, Indonesia, Vietnam, China | Short term (≤ 2 years) |
| Emergence of Chiplet-Based GPU Architectures | +2.5% | Global, early adoption in China, Japan, South Korea | Long term (≥ 4 years) |
| Increasing Graphics Requirements for PC Content Creation | +1.9% | China, Japan, South Korea, India | Medium term (2-4 years) |
| Government Incentives for Domestic GPU Design Start-ups | +1.3% | China, India, Japan, South Korea | Long term (≥ 4 years) |
| Source: Mordor Intelligence | |||
Rising Demand for AI Acceleration in Data Centers
Hyperscale operators across the region continue to scale GPU clusters capable of training and serving large language models at petaflop precision. Orders for next-generation accelerators routinely exceed 10,000 units per campus, forcing suppliers to prioritize data-center products over consumer graphics. Vietnam, Thailand, and Malaysia have issued multi-year tax holidays that lower effective capital outlay for cloud-service providers, prompting new builds of 300-megawatt campuses designed around liquid-cooled GPU pods. In China, policy limits on imported silicon are accelerating the adoption of Huawei Ascend devices, whose 2026 production target of 600,000 units is almost double 2025 output. Demand is also expanding in India, where semiconductor incentives worth USD 10 billion earmark a significant tranche for data-center accelerators. Altogether, the scale, localization push, and diversified workloads keep AI servers as the fastest-growing end use for the Asia-Pacific GPU market.
Proliferation of Cloud Gaming Platforms
The rollout of 5G standalone networks and metropolitan edge nodes has driven average latency below 20 milliseconds in major cities, enabling premium game streaming at 1080p with minimal compression. Chinese publishers now launch day-and-date cloud versions to reach console-averse segments, while Japanese incumbents deploy regional edge caches to preserve user experience during peak hours. Telecom bundles that pair unlimited 5G with subscription access have increased conversion rates for first-time console customers, aligning operator average revenue per user and platform attach metrics. GPU demand arises on two fronts: additional datacenter cards for rendering clusters and integrated smartphone GPUs that can decode ray-traced streams without throttling. Accordingly, cloud gaming continues to exert a meaningful positive pull on regional GPU shipments.
Expansion of Mobile Gaming Ecosystem in Asia-Pacific
Asia-Pacific generated the highest share of global mobile-game revenue in 2025, with sustained growth from South Korea, Japan, and a cohort of emerging markets led by India and Indonesia. Genre diversification toward strategy and shooter titles increases real-time shader complexity, stimulating the adoption of newer smartphone SoCs that embed dedicated ray-tracing cores. OEMs aggressively market devices with 165 hertz OLED panels and vapor-chamber cooling, differentiating on sustained graphics throughput rather than transient benchmark peaks. For GPU vendors, this dynamic extends unit lifecycles and justifies premium pricing for mid-range die stacks optimized for visual fidelity, thereby supporting total addressable volume.
Emergence of Chiplet-Based GPU Architectures
Chiplet partitioning enables suppliers to sidestep reticle-limited monolithic dies and improve yield on advanced nodes. AMD’s multi-chiplet MI450 mates logic slices on a 5-nanometer base tile to nine HBM4 stacks via 2.5D interposers, delivering over 400 gigabytes of on-package memory bandwidth per device. Similar principles underpin Intel’s Ponte Vecchio and NVIDIA’s Blackwell families, indicating industry-wide convergence. TSMC’s ongoing CoWoS capacity constraints, however, amplify the strategic importance of Intel's advanced packaging facilities and Samsung foundry collaborations. Over the long term, chiplets promise modular roadmaps and cost elasticity that reinforce supply resilience for the Asia-Pacific GPU market.
Restraints Impact Analysis*
| RESTRAINT | (~) % IMPACT ON CAGR FORECAST | GEOGRAPHIC RELEVANCE | IMPACT TIMELINE |
|---|---|---|---|
| Stricter Export Controls on High-Performance GPUs to China | -3.4% | China and adjacent trans-shipment hubs | Short term (≤ 2 years) |
| Supply-Chain Volatility for Advanced Packaging Materials | -2.7% | Taiwan, South Korea, global | Medium term (2-4 years) |
| Rising Average Selling Prices Limiting Mass-Market Adoption | -1.6% | India, Indonesia, Vietnam, Thailand | Short term (≤ 2 years) |
| Escalating Data-Center Energy Tariffs in Japan and South Korea | -0.9% | Japan, South Korea | Medium term (2-4 years) |
| Source: Mordor Intelligence | |||
Stricter Export Controls on High-Performance GPUs to China
The United States implemented more rigorous license thresholds in late 2023, constraining shipments of top-bin accelerators. A partial relaxation in January 2026 allowed case-by-case export of certain models, yet legislative proposals such as the AI OVERWATCH Act could reinstate blanket prohibitions. Regional distributors face elevated compliance costs, and Chinese hyperscalers increasingly dual-source with domestic silicon despite lagging performance. The resulting fragmentation slows near-term revenue recognition for United States suppliers and redirects capital toward local alternatives, shaving several points off the regional CAGR forecast.
Supply-Chain Volatility for Advanced Packaging Materials
High-bandwidth memory and CoWoS substrate capacity remain critical bottlenecks. SK Hynix is investing USD 13 billion to ramp HBM4 output at its P&T7 fab, while Samsung earmarks USD 73 billion across memory and foundry operations through 2027.[1]Jane Lanhee Lee, “SK Hynix to Boost HBM4 Output,” Reuters, reuters.com Lead times for advanced substrates exceed 6 months, forcing allocations that favor flagship data-center accelerators over mid-range gaming cards. Any geopolitical escalation that disrupts material flows from Taiwan or Korea would immediately tighten supply and inflate bill-of-materials costs, tempering unit growth across the Asia-Pacific GPU market.
*Our forecasts treat driver/restraint impacts as directional, not additive. The impact forecasts reflect baseline growth, mix effects, and variable interactions.
Segment Analysis
By Integration Type: Discrete GPUs Sustain Datacenter Dominance
Discrete accelerators captured 64.81% of the Asia-Pacific GPU market share in 2025 on the back of escalating AI training deployments. The Asia-Pacific GPU market size for discrete devices is expected to outpace integrated alternatives at a 19.26% CAGR to 2031 as hyperscalers specify stand-alone cards with 700-watt thermal envelopes and multi-terabyte HBM capacity. Continuous enhancements in interconnect bandwidth and memory-centric architectures keep discrete GPUs as the default choice for enterprise workload consolidation.
Integrated solutions remain indispensable in mobile devices, ultrathin laptops, and entry-level desktops where thermal and cost constraints prevail. Apple’s custom silicon and Qualcomm Snapdragon X series illustrate performance parity for many consumer tasks, yet sustained ray-traced gaming or foundation-model inference still triggers demand for discrete add-in boards.[2]Qualcomm, “Snapdragon X Elite Product Brief,” qualcomm.com Over the forecast period, a hybrid system-on-package approach that embeds GPU chiplets alongside CPU tiles may blur definitions, but overall revenue concentration will continue to skew toward discrete designs in the Asia-Pacific GPU market.


By Device Application: Servers and Datacenters Accelerate Outperformance
Servers and datacenter accelerators accounted for 33.76% of the Asia-Pacific GPU market size in 2025 and are projected to climb at a 19.33% CAGR through 2031. Each new hyperscale region opening typically commits several thousand GPUs, and sovereign-cloud regulations in India, Singapore, and Malaysia add incremental capacity. High average selling prices, often 20 times those of premium desktop cards, magnify revenue contribution, even though unit volume trails consumer segments.
Mobile devices and tablets continue to dominate on a shipment basis, thanks to billions of smartphones sold annually, but revenue share lags because integrated GPUs command lower margins. Console and handheld demand, anchored by PlayStation and Switch successors, provides a cyclical uplift in dedicated gaming silicon. Automotive ADAS and edge-computing endpoints represent nascent high-growth niches that will gradually diversify the end-market mix for the Asia-Pacific GPU market.

Geography Analysis
China’s entrenched position in electronics manufacturing and consumer internet services accounts for half of regional GPU demand. Policy-driven substitution is likely to reshape vendor mix rather than overall consumption, as domestic operators increase orders for locally designed accelerators that meet sovereign compliance requirements. Beijing’s broader “compute power network” initiative further embeds GPUs into provincial economic development agendas.
India’s strategic policy shift toward onshore semiconductor value addition gained momentum with the inauguration of Micron’s assembly and test facility in Gujarat. A deep, mobile-first digital economy, coupled with the rapid rollout of generative AI applications in financial services and healthcare, underpins outsized growth potential.[3]Micron Technology, “Micron Gujarat Facility Begins Production,” micron.com The confluence of domestic capacity creation and rising local demand positions India as a focal point for new GPU supply chains.
Southeast Asian economies leverage their geographical proximity to submarine cable intersections and supportive fiscal regimes to attract hyperscale investment. Vietnam’s multibillion-dollar AI campuses illustrate the scale of capital inflows, while Malaysia’s expedited permitting framework reduces lead times for data-center builds. These developments collectively boost regional adoption of advanced GPUs, solidifying Southeast Asia as a rising node in the Asia-Pacific GPU market.
Competitive Landscape
The Asia-Pacific GPU competition remains moderately concentrated. NVIDIA preserves a commanding lead in training software ecosystems and high-end datacenter silicon. The September 2025 pact with Intel, valued at USD 5 billion in equity, diversifies manufacturing risk by tapping Intel Foundry Services for future RTX chiplets and x86 integration.[4]NVIDIA, “NVIDIA Makes USD 5 Billion Equity Investment in Intel,” nvidia.com AMD differentiates through an open-standards positioning and deepening HBM4 collaboration with Samsung, seeking to erode perceptions of proprietary vendor lock-in.
Domestic Chinese vendors, including Moore Threads and Biren Technology, pursue aggressive scale-up strategies, buoyed by capital-market access and national procurement preferences. Moore Threads’ December 2025 STAR Market listing, with an equivalent capitalization of USD 42 billion, underscores investor appetite for sovereign GPU champions. Huawei’s Ascend roadmap targets an annual output of 600,000 units in 2026, positioning the brand as the primary beneficiary if export controls tighten further.
Memory suppliers wield disproportionate influence. Samsung and SK Hynix together command a significant share of HBM production, effectively acting as kingmakers for next-generation accelerator launches. Foundry capacity and substrate availability remain strategic choke points; thus, alliances that secure advanced packaging lanes, such as AMD-Samsung or NVIDIA-Intel, provide critical hedge advantages within the Asia-Pacific GPU market.
Asia-Pacific GPU Industry Leaders
Samsung Electronics Co. Ltd.
Qualcomm Technologies Inc.
Intel Corporation
Advanced Micro Devices Inc.
NVIDIA Corporation
- *Disclaimer: Major Players sorted in no particular order

Recent Industry Developments
- March 2026: Samsung Electronics and AMD signed a memorandum of understanding to collaborate on next-generation AI memory and computing platforms. Samsung commenced mass production of sixth-generation HBM4 at 13 gigabits per second, supplying AMD’s MI455X accelerator.
- February 2026: AMD and Nutanix announced a multi-year partnership to co-develop an open full-stack AI infrastructure platform optimized for EPYC CPUs and Instinct GPUs, with AMD investing USD 150 million in Nutanix common stock and pledging up to USD 100 million for joint research and development.
- February 2026: Micron Technology started production at its assembly and test facility in Gujarat, India, delivering the first output supported by the India Semiconductor Mission 2.0 incentive scheme.
- December 2025: Biren Technology filed for an initial public offering in Hong Kong, seeking approximately USD 300 million to fund next-generation GPU development.


Asia-Pacific GPU Market Report Scope
The Asia-Pacific GPU Market Report is Segmented by Integration Type (Integrated GPUs and Discrete GPUs), Device Application (Mobile Devices and Tablets, PCs and Workstations, Servers and Datacenter Accelerators, Gaming Consoles and Handhelds, Automotive and ADAS, and Other Embedded and Edge Devices), and Geography (China, Japan, South Korea, India, Southeast Asia, and Rest of Asia-Pacific). The Market Forecasts are Provided in Terms of Value (USD).
| Integrated GPUs (iGPU) |
| Discrete GPUs (dGPU) |
| Mobile Devices and Tablets |
| PCs and Workstations |
| Servers and Datacenter Accelerators |
| Gaming Consoles and Handhelds |
| Automotive / ADAS |
| Other Embedded and Edge Devices |
| China |
| Japan |
| South Korea |
| India |
| Southeast Asia |
| Rest of Asia-Pacific |
| By Integration Type | Integrated GPUs (iGPU) |
| Discrete GPUs (dGPU) | |
| By Device Application | Mobile Devices and Tablets |
| PCs and Workstations | |
| Servers and Datacenter Accelerators | |
| Gaming Consoles and Handhelds | |
| Automotive / ADAS | |
| Other Embedded and Edge Devices | |
| By Geography | China |
| Japan | |
| South Korea | |
| India | |
| Southeast Asia | |
| Rest of Asia-Pacific |


Key Questions Answered in the Report
How large will GPU demand in Asia-Pacific data centers be by 2031?
Servers and datacenter accelerators are forecast to grow at 19.33% CAGR, driving regional revenue to the largest share of the Asia-Pacific GPU market by the end of the forecast period.
Which integration type dominates GPU shipments in the Asia-Pacific?
Discrete GPUs led with 64.81% share in 2025 and maintain leadership through 2031 thanks to hyperscale AI deployments that favor stand-alone accelerators.
Why is India the fastest-growing geography?
The India Semiconductor Mission 2.0’s USD 10 billion incentives and Micron’s new assembly facility underpin a 19.44% CAGR in Indian GPU revenue to 2031.
How do export controls affect market growth?
Stricter United States licensing reduces near-term shipments of high-performance GPUs to China, subtracting approximately 3.4 percentage points from the regional CAGR forecast.
Which technology trend most improves future GPU supply resilience?
Chiplet-based architectures distribute logic across smaller dies, achieving better yield and enabling modular scaling, mitigating advanced-node risk for Asia-Pacific suppliers.
Page last updated on:


