Asia-Pacific Cross-Border B2C E-commerce Market Size and Share
Market Overview
| Study Period | 2020 - 2031 |
|---|---|
| Forecast Data Period | 2026 - 2031 |
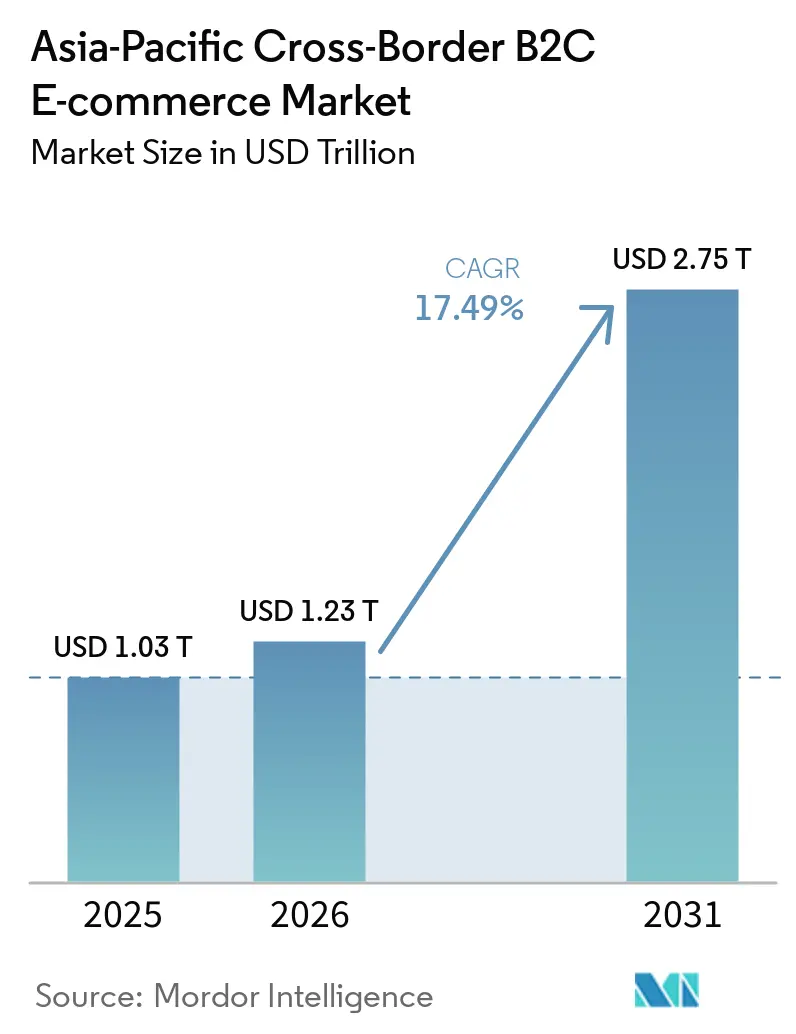
| Base Year Market Size (2025) | USD 1.03 Trillion |
| Market Size (2026) | USD 1.23 Trillion |
| Market Size (2031) | USD 2.75 Trillion |
| Growth Rate (2026 - 2031) | 17.49% CAGR |
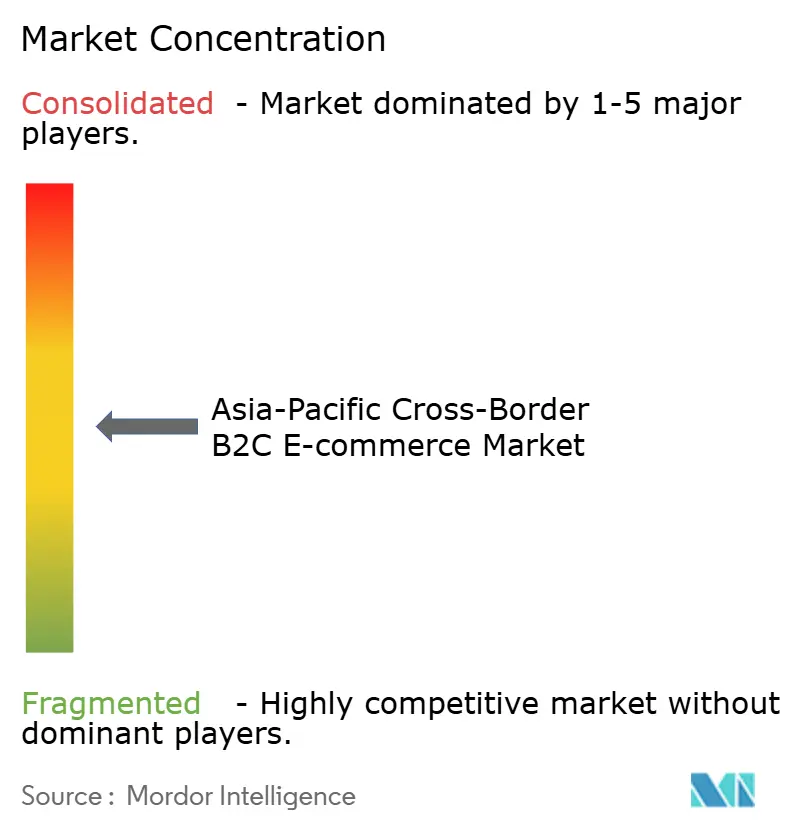
| Market Concentration | Medium |
Major Players *Disclaimer: Major Players sorted in no particular order Image © Mordor Intelligence. Reuse requires attribution under CC BY 4.0. | |
Asia-Pacific Cross-Border B2C E-commerce Market Analysis by Mordor Intelligence
The Asia-Pacific cross-border B2C e-commerce market size is expected to grow from USD 1.03 trillion in 2025 to USD 1.23 trillion in 2026 and is forecast to reach USD 2.75 trillion by 2031 at 17.49% CAGR over 2026-2031.
The Asia-Pacific cross-border B2C e-commerce market is moving through a structural shift as trade agreements, payment systems, and logistics capacity are being developed to reduce friction across regional corridors. China remains the gravity center for routing and fulfillment decisions across the region, so supply chain choices in export provinces continue to shape seller economics in Southeast Asia and other APAC destinations. RCEP is still improving cost economics for regional trade, and Guangdong Customs reported that tariff concessions on RCEP-eligible trade grew by 32.1% in 2025, suggesting sustained rather than temporary benefits for the Asia-Pacific cross-border B2C e-commerce market. Market opportunities are strongest where platforms can combine buyer trust, local payments, and faster delivery, especially as bonded warehousing and social-led product discovery expand across the region. At the same time, tighter tax treatment, rising compliance demands, and costly reverse logistics are making scale more valuable and pushing smaller sellers toward platform-led operating models.
Key Report Takeaways
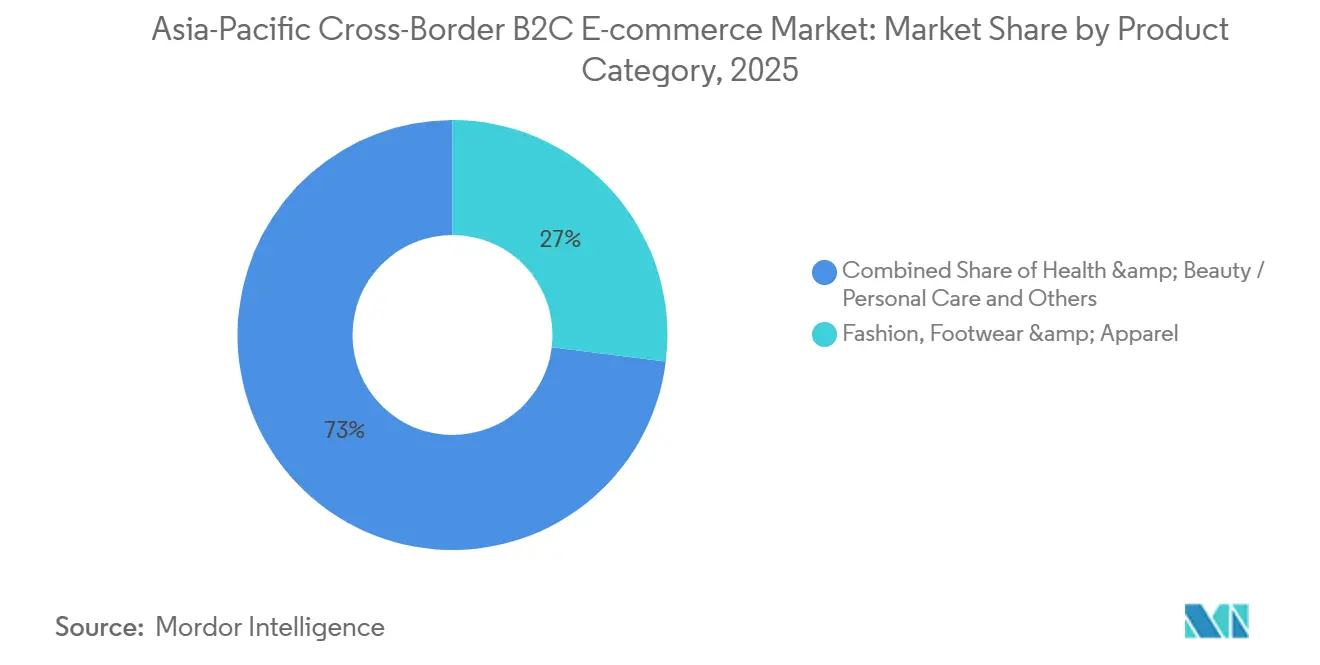
- By product category, fashion, footwear & apparel held 26.97% of the Asia-Pacific cross-border B2C e-commerce market share in 2025, while health & beauty / personal care is forecast to expand at 19.24% CAGR through 2031.
- By sales channel, online marketplaces held 60.01% of the Asia-Pacific cross-border B2C e-commerce market size in 2025, while social commerce is projected to grow at 23.21% CAGR through 2031.
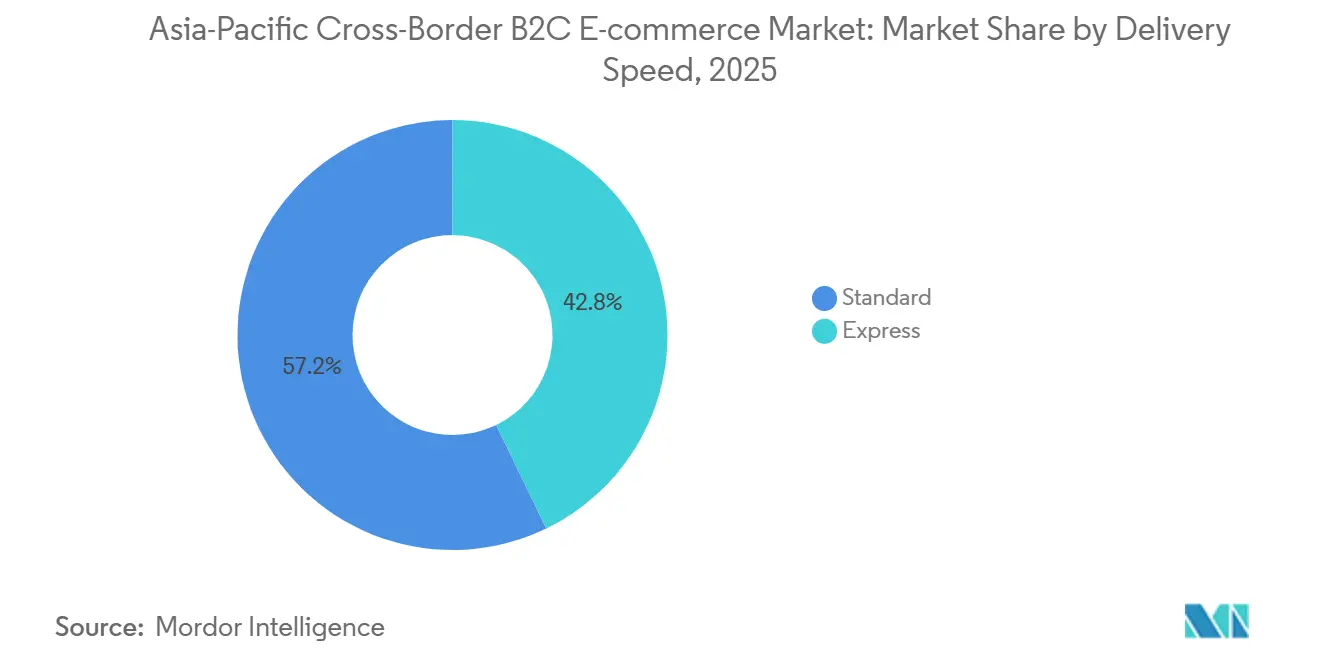
- By delivery speed, standard delivery accounted for 57.19% of the Asia-Pacific cross-border B2C e-commerce market size in 2025, while express is advancing at 20.34% CAGR through 2031.
- By geography, China held 73.8% of the Asia-Pacific cross-border B2C e-commerce market share in 2025, while India is forecast to expand at 21.61% CAGR through 2031.
Note: Market size and forecast figures in this report are generated using Mordor Intelligence’s proprietary estimation framework, updated with the latest available data and insights as of January 2026.
Asia-Pacific Cross-Border B2C E-commerce Market Trends and Insights
Drivers Impact Analysis*
| Driver | (~) % Impact on CAGR Forecast | Geographic Relevance | Impact Timeline |
|---|---|---|---|
| RCEP Tariff Phase-Downs and Digital-Trade Alignment | +3.2% | RCEP-member corridors, China, Japan, South Korea, Australia, ASEAN-10 | Medium term (2-4 years) |
| Local-Wallet and BNPL Checkout Expansion | +2.8% | Southeast Asia core, Indonesia, Thailand, Vietnam, Malaysia, with spillover to India | Short term (≤ 2 years) |
| Marketplace and Social-Commerce Assortment Discovery | +3.5% | Southeast Asia, China, South Korea | Short term (≤ 2 years) |
| Cross-Border Fulfillment and Bonded-Warehouse Expansion | +2.1% | China, Singapore, Malaysia, Vietnam, Japan | Medium term (2-4 years) |
| China Return-Tax Relief for Cross-Border Returns | +1.4% | China outbound, with benefits flowing to Chinese exporters serving APAC destinations | Short term (≤ 2 years) |
| Japan Simplified Small-Parcel Customs Clearance | +1.0% | Japan inbound, with a secondary benefit to Korean and Chinese exporters serving Japan. | Short term (≤ 2 years) |
| Source: Mordor Intelligence | |||
RCEP Tariff Phase-Downs and Digital-Trade Alignment
Tariff erosion under RCEP is becoming increasingly commercially meaningful for the Asia-Pacific cross-border B2C e-commerce market, as annual reductions continue to accumulate. A 2026 study in the Journal of Geographical Sciences modeled a 7.7% increase in intra-RCEP trade and found only a 0.8% external-trade diversion effect, suggesting that the agreement is creating new trade rather than primarily shifting existing flows[1]Source: Xin Li et al., “Reshaping Effects of RCEP on China’s Foreign Trade Pattern,” Journal of Geographical Sciences, link.springer.com. The Asia-Pacific cross-border B2C e-commerce market is also benefiting from RCEP's approach to reducing administrative complexity across multiple corridors rather than improving only one bilateral route. That makes the agreement more valuable for platforms and logistics providers that run large multi-country networks and need consistent trade rules across several APAC markets.
Local-Wallet and BNPL Checkout Expansion
Checkout infrastructure is becoming as important as price in the Asia-Pacific cross-border B2C e-commerce market, especially in Southeast Asia, where card penetration remains uneven. Local wallets and embedded installment options help reduce payment abandonment and build consumer trust when buying goods from foreign sellers. The shift also favors platform-linked fintech systems because those tools sit inside the same environment as order management, refunds, and promotions. As ASEAN payment interoperability expands, platforms that already control traffic and checkout can protect margins better than standalone payment providers. These dynamic matters most in categories with higher repeat behavior, where stored payment credentials and familiar wallet brands raise lifetime value. It also supports smaller exporters because localized checkout removes one of the largest barriers to entering a new market without first building a local entity.
Marketplace and Social-Commerce Assortment Discovery
The merging of content and transaction flows is changing how buyers discover foreign products in the Asia-Pacific cross-border B2C e-commerce market. TikTok Shop’s regional scale in 2025 pushed incumbents to adjust both merchant strategy and logistics readiness across Southeast Asia. The key advantage is speed: sellers can test product demand in a new country within days rather than spend months on a slower marketplace-only rollout. That is why the Asia-Pacific cross-border B2C e-commerce market is seeing stronger convergence between media, commerce, and fulfillment than in many other retail models.
Cross-Border Fulfillment and Bonded-Warehouse Expansion
Distributed bonded warehousing is reshaping the economics of fulfillment in the Asia-Pacific cross-border B2C e-commerce market. Cainiao expanded its APAC warehousing network to more than 20 facilities across 10 markets in July 2025 and reported a 99.9% same-day outbound rate, which shows how quickly regional inventory positioning is improving[2]Source: Cainiao, “Cainiao Expands APAC Supply Chain, Now Operating Warehousing and Fulfillment in 10 Markets,” PR Newswire, prnewswire.com. Maersk also opened its largest Asia-Pacific contract logistics facility in Malaysia in November 2025, with bonded and non-bonded storage and on-site customs support. When exporters pre-position inventory across several APAC nodes, delivery times are sufficiently reduced to make faster service viable for mid-priced goods rather than only premium orders. That shift matters because Express delivery then becomes a realistic default expectation for buyers, not just an upgrade option. The Asia-Pacific cross-border B2C e-commerce market is therefore moving away from a single-hub model toward a distributed regional network that reduces both delivery uncertainty and customs friction.
Restraints Impact Analysis*
| Restraint | (~) % Impact on CAGR Forecast | Geographic Relevance | Impact Timeline |
|---|---|---|---|
| Fragmented De Minimis and VAT/GST Thresholds | -1.8% | Thailand, Vietnam, Indonesia, and Japan are under reform, with broader APAC relevance. | Short term (≤ 2 years) |
| Reverse-Logistics Cost Burden in Fashion-Led Baskets | -1.2% | APAC-wide, with sharper exposure in Australia, Japan, and South Korea | Medium term (2-4 years) |
| Data-Localization and Platform-Liability Compliance | -0.9% | Vietnam, Indonesia, India, China, with lighter exposure in Singapore and Japan | Medium term (2-4 years) |
| Low-Value Import Tax Tightening in Key APAC Markets | -1.5% | Japan, Thailand, Vietnam, Australia, with secondary exposure in Malaysia and the Philippines | Short term (≤ 2 years) |
| Source: Mordor Intelligence | |||
Fragmented De Minimis and VAT/GST Thresholds
The Asia-Pacific cross-border B2C e-commerce market still faces a patchwork of tax thresholds and low-value import treatment across countries. That fragmentation creates uneven landed-cost outcomes, even when the same product moves through closely linked regional corridors. Larger platforms can absorb this complexity through centralized pricing tools and tax engines, but small sellers often cannot. The result is a competitive tilt toward operators that already have scale, automated compliance, and stronger checkout localization. Frequent policy changes also make it harder to run stable promotions, as the final delivered cost can vary by market with little notice. This remains a practical restraint on cross-border expansion even when demand and logistics conditions are favorable.
Reverse-Logistics Cost Burden in Fashion-Led Baskets
Reverse logistics remains a structural issue because the largest product group in the Asia-Pacific cross-border B2C e-commerce market is still fashion-led and therefore more exposed to fit, style, and expectation mismatches. Cross-border returns take longer, cost more, and create more customer-service friction than domestic returns. These burdens weigh on gross margins and make free-return policies harder to sustain across several APAC markets. They also favor platforms and sellers with local processing partners or regional warehouse footprints that can reduce the distance between the buyer and the return node. China’s policy support for returned cross-border goods improves the outbound position of Chinese sellers, adding another operating advantage within the region. Until return handling becomes cheaper and more standardized, fashion-heavy baskets will continue to carry a margin penalty versus more predictable product categories.
*Our forecasts treat driver/restraint impacts as directional, not additive. The impact forecasts reflect baseline growth, mix effects, and variable interactions.
Segment Analysis
By Product Category: Fashion Leads, But Health & Beauty Is Rewriting the Growth Curve
Fashion, footwear & apparel accounted for 26.97% of the Asia-Pacific cross-border B2C e-commerce market share in 2025, maintaining its lead among product categories. The segment benefited from China-to-ASEAN fast-fashion logistics and from Korean apparel flows that travel beside broader beauty and lifestyle demand. In the Asia-Pacific cross-border B2C e-commerce market, fashion is the easiest category for rapid assortment rotation because trend cycles are short and platforms can quickly surface demand. That same flexibility also explains why fashion keeps strong order volumes even when regulatory and tax settings become less favorable.
Health & beauty / personal care is projected to grow at a 19.24% CAGR through 2031, making it the fastest-growing product group in this market. The growth profile of beauty and personal care reflects stronger demand for authenticity, trusted origin, and brand provenance in cross-border purchases. Japanese and Korean beauty exporters are well-positioned because their origins still command a quality premium in many APAC markets. Consumer electronics & appliances and home & office also remain important volume categories, especially where tariff alignment improves the cost case for regional sourcing. Hobbies & toys and automotive parts are smaller but more compliance-heavy, which creates a higher entry barrier for smaller merchants. The Asia-Pacific cross-border B2C e-commerce industry, therefore, shows a split: fashion leads in current scale, beauty in future momentum, and compliance-sensitive categories reward sellers who can manage documentation and product standards more effectively.


By Sales Channel: Online Marketplaces Consolidate, Social Commerce Disrupts
Online marketplaces accounted for 60.01% of the Asia-Pacific cross-border B2C e-commerce market size in 2025, making them the largest sales channel in the region. This lead reflects platform trust, integrated payments, fulfillment support, and after-sales processes that reduce uncertainty for buyers purchasing from overseas sellers. Marketplace models also aggregate demand signals across large product catalogs, helping merchants forecast inventory levels and reduce stockouts. In practice, the strongest marketplace operators are those that combine product discovery, delivery visibility, and dispute resolution within a single workflow.
Social commerce is forecast to grow at a 23.21% CAGR through 2031, making it the fastest-growing sales format in the market. This growth is not only about app usage; it also reflects a tighter link between content, checkout, and fulfillment. TikTok Shop’s scale in Southeast Asia has already forced a strategic response from incumbents, and Rakuten’s 2026 partnership with Google to bring YouTube Shopping to Japan shows that content-led commerce is being treated as a mainstream channel by established platforms. Direct-to-consumer webstores are also gaining strategic value as brands seek greater data ownership and stronger control over margins. In the Asia-Pacific cross-border B2C e-commerce industry, DTC matters most for mid-sized brands seeking cross-border reach without relying on marketplace fees or ranking systems. The channel mix is therefore widening, but the Asia-Pacific cross-border B2C e-commerce market still favors models that shorten the distance between discovery and transaction.
By Delivery Speed: Express Acceleration Powered by Warehouse Pre-Positioning
Standard delivery held 57.19% share in 2025 and remained the largest delivery tier in the Asia-Pacific cross-border B2C e-commerce market. Its lead reflects the continued importance of price-sensitive orders, especially in categories such as commodity electronics, household items, and lower-ticket accessories. Express delivery is projected to grow at a 20.34% CAGR through 2031, making it the fastest-rising speed tier in the market. That acceleration is closely linked to bonded-warehouse growth and better regional inventory planning rather than only to last-mile improvements. As sellers move stock closer to destination markets, 2 to 3-day delivery becomes viable across more corridors and product ranges.
Nippon Express also launched a new service in August 2025 that enables overseas sellers to serve Japanese consumers, while the NX Group handles customs clearance and domestic delivery in Japan. These moves strengthen the position of operators with owned or tightly managed logistics infrastructure. They also raise customer expectations, because once faster delivery becomes reliable in one category, buyers start expecting it in adjacent categories as well. The Asia-Pacific cross-border B2C e-commerce market is likely to keep Standard as the volume leader in the near term. Still, express is steadily redefining what competitive service looks like.
Geography Analysis
China accounted for 73.8% of the Asia-Pacific cross-border B2C e-commerce market share in 2025, which kept it far ahead of every other country in the study. This position reflects much more than domestic scale, because China also anchors outbound logistics, seller density, and platform reach across the region. In January 2025, the State Taxation Administration introduced a departure-based tax refund approach for overseas warehouse exports, which improved exporter cash flow by allowing refunds at customs clearance rather than after the final overseas sale. China then expanded return-support measures in 2026, which further strengthened exporters' operating efficiency for cross-border flows. Alibaba’s fiscal 2026 disclosures also showed that AliExpress brand GMV grew by more than 40% in fiscal 2025, suggesting rising quality stratification in China’s outbound mix.
India is the fastest-growing country in the Asia-Pacific cross-border B2C e-commerce market, with a projected growth of 21.61% CAGR from 2026 to 2031. Amazon’s Global Selling program crossed USD 20 billion in cumulative exports from India in October 2025, and the seller base rose to more than 200,000 exporters[3]Source: Amazon, “Amazon Surpasses USD 20 Billion Milestone for Ecommerce Exports from India Before 2025 Deadline, Targets USD 80 Billion by 2030,” Amazon Press Center, press.aboutamazon.com. The company also committed more than USD 35 billion in India investments through 2030, reinforcing the scale of long-term platform confidence in the country. India’s export reforms in 2026 lowered frictions for courier-led outbound trade and improved the operating case for MSME sellers in higher-value categories. That combination of platform support and policy easing gives India a stronger path to close part of the regional gap with China over the forecast period.
Japan remains a critical inbound destination, where logistics and compliance are becoming increasingly structured in the Asia-Pacific cross-border B2C e-commerce market. Nippon Express’s 2025 service launch for overseas sellers targeting Japanese buyers shows that specialist logistics providers still see room to simplify entry into the country. Southeast Asian markets are also tightening tax and platform rules, which is changing landed-cost calculations and raising the value of local regulatory capability. Australia stays attractive for direct-parcel models, but offshore sellers still face GST collection obligations once local sales activity reaches the required threshold.
Competitive Landscape
The Asia-Pacific cross-border B2C e-commerce market is moderately concentrated at the platform level, but it is more fragmented across logistics, payments, and seller operations. Alibaba Group, Shopee, PDD Holdings, Amazon, and TikTok Shop remain the most visible competitive forces shaping the regional landscape[4]Source: Alibaba Group, “Alibaba Group Announces March Quarter 2026 and Fiscal Year 2026 Results,” BusinessWire, businesswire.com. The core divide is between scale-and-infrastructure players that invest in owned fulfillment and transaction control, and content-native players that compress the path from attention to purchase. In this market, the winning model increasingly depends on how well a company connects traffic, checkout, inventory placement, and service resolution within a single operating loop. That is why competitive advantage in the Asia-Pacific cross-border B2C e-commerce market now comes less from traffic alone and more from how efficiently platforms convert traffic into predictable cross-border fulfillment.
Alibaba’s fiscal 2026 update is a good example of this shift, because the company launched Accio Work as an AI business platform designed to manage sourcing, operations, logistics, and market analytics for global SMEs. This move extends the marketplace role beyond merchant acquisition to full operating support, raising switching costs for sellers. Amazon is pursuing a different path, using export-scale programs and long-term investment commitments to deepen seller participation from India. Shopee and TikTok Shop are competing more directly around discovery, merchant monetization, and regional fulfillment readiness. The competitive tension between marketplace-led scale and social-led conversion is now one of the defining features of the Asia-Pacific cross-border B2C e-commerce market.
White-space opportunities remain strongest in underpenetrated D2C cross-border flows from India and Southeast Asia, regulated categories where origin and trust matter, and faster-delivery services for sellers without their own infrastructure. Cainiao’s APAC warehouse expansion is a direct strategic move to defend speed and cost control across several regional corridors. Rakuten’s YouTube Shopping partnership in Japan is another clear move, expanding discovery channels while keeping merchants within a known domestic ecosystem. Companies that lack embedded logistics or payment support are under the most pressure, because traffic alone is becoming a weaker basis for competition as the regional operating model gets more integrated.
Asia-Pacific Cross-Border B2C E-commerce Industry Leaders
Alibaba Group
PDD Holdings (Temu)
Shopee
Amazon
JD.com
- *Disclaimer: Major Players sorted in no particular order

Recent Industry Developments
- May 2026: AliExpress announced at its 2026 cross-border market strategy briefing that it will help 2,000 Chinese brands double their overseas scale in 2026 through its Brand+ program, following brand GMV growth of over 40% in fiscal 2025, with investment targeted at South Korea, the United States, and Latin America.
- February 2026: Rakuten and Google announced a partnership to bring the YouTube Shopping affiliate program to Japan, enabling local YouTube creators to tag Rakuten Ichiba products directly within videos and Shorts. With over 50,000 Rakuten merchants and 500 million product listings, the partnership materially expands discovery channels for cross-border products sold on Japan's largest domestic marketplace.
- November 2025: A.P. Moller Maersk launched its largest Asia-Pacific contract logistics facility in Malaysia, Maersk Mega Distribution Center, expanding its regional warehousing footprint by more than 30% and offering bonded and non-bonded storage with on-site customs officers for cross-border e-commerce fulfillment.
- October 2025: Amazon announced that it surpassed USD 20 billion in cumulative e-commerce exports from India ahead of its 2025 deadline, with the seller base growing 33% in the past year to over 200,000 exporters. The company has set a new target of USD 80 billion in cumulative India exports by 2030 and committed over USD 35 billion in fresh India investment through 2030.


Asia-Pacific Cross-Border B2C E-commerce Market Report Scope
| Fashion, Footwear & Apparel |
| Health & Beauty / Personal Care |
| Home & Office |
| Hobbies & Toys |
| Consumer Electronics & Appliances |
| Automotive Parts |
| Rest of the Product Categories |
| Online Marketplaces |
| Direct-to-Consumer (Webstores) |
| Social Commerce (Live, Chat) |
| Express |
| Standard |
| Vietnam | Outbound (Exports) |
| Inbound (Imports) | |
| Thailand | Outbound (Exports) |
| Inbound (Imports) | |
| Malaysia | Outbound (Exports) |
| Inbound (Imports) | |
| Singapore | Outbound (Exports) |
| Inbound (Imports) | |
| India | Outbound (Exports) |
| Inbound (Imports) | |
| China | Outbound (Exports) |
| Inbound (Imports) | |
| Japan | Outbound (Exports) |
| Inbound (Imports) | |
| South Korea | Outbound (Exports) |
| Inbound (Imports) | |
| Australia | Outbound (Exports) |
| Inbound (Imports) | |
| Rest of Asia-Pacific |
| By Product Category | Fashion, Footwear & Apparel | |
| Health & Beauty / Personal Care | ||
| Home & Office | ||
| Hobbies & Toys | ||
| Consumer Electronics & Appliances | ||
| Automotive Parts | ||
| Rest of the Product Categories | ||
| By Sales Channel | Online Marketplaces | |
| Direct-to-Consumer (Webstores) | ||
| Social Commerce (Live, Chat) | ||
| By Delivery Speed | Express | |
| Standard | ||
| By Country | Vietnam | Outbound (Exports) |
| Inbound (Imports) | ||
| Thailand | Outbound (Exports) | |
| Inbound (Imports) | ||
| Malaysia | Outbound (Exports) | |
| Inbound (Imports) | ||
| Singapore | Outbound (Exports) | |
| Inbound (Imports) | ||
| India | Outbound (Exports) | |
| Inbound (Imports) | ||
| China | Outbound (Exports) | |
| Inbound (Imports) | ||
| Japan | Outbound (Exports) | |
| Inbound (Imports) | ||
| South Korea | Outbound (Exports) | |
| Inbound (Imports) | ||
| Australia | Outbound (Exports) | |
| Inbound (Imports) | ||
| Rest of Asia-Pacific | ||


Key Questions Answered in the Report
What is the size outlook for Asia-Pacific cross-border B2C e-commerce through 2031?
The Asia-Pacific cross-border B2C e-commerce market is projected to grow from USD 1.23 trillion in 2026 to USD 2.75 trillion by 2031, at a 17.49% CAGR.
Which country leads regional cross-border B2C activity?
China led the region with 73.8% share in 2025, supported by export infrastructure, tax support for overseas warehouse flows, and strong platform scale.
Which country is growing the fastest in APAC cross-border online retail?
India is forecast to expand at a 21.61% CAGR from 2026 to 2031, supported by growth in export platforms and easier outbound trade procedures.
Which product segment has the largest share, and which one is growing fastest?
Fashion, footwear & apparel led with a 26.97% share in 2025, while health & beauty / personal care is the fastest-growing category, with a 19.24% CAGR through 2031.
Why are online marketplaces still ahead of other sales channels?
Online marketplaces held a 60.01% share in 2025 because they combine trust, payments, logistics, and after-sales support in a single environment for cross-border buyers.
Why is express delivery becoming more important in APAC cross-border commerce?
Express delivery is forecast to grow at 20.34% CAGR through 2031 as sellers place inventory in regional bonded warehouses and reduce delivery times across major trade corridors.
Page last updated on:


