India Cross-border B2C E-commerce Market Size and Share
Market Overview
| Study Period | 2020 - 2031 |
|---|---|
| Forecast Data Period | 2026 - 2031 |
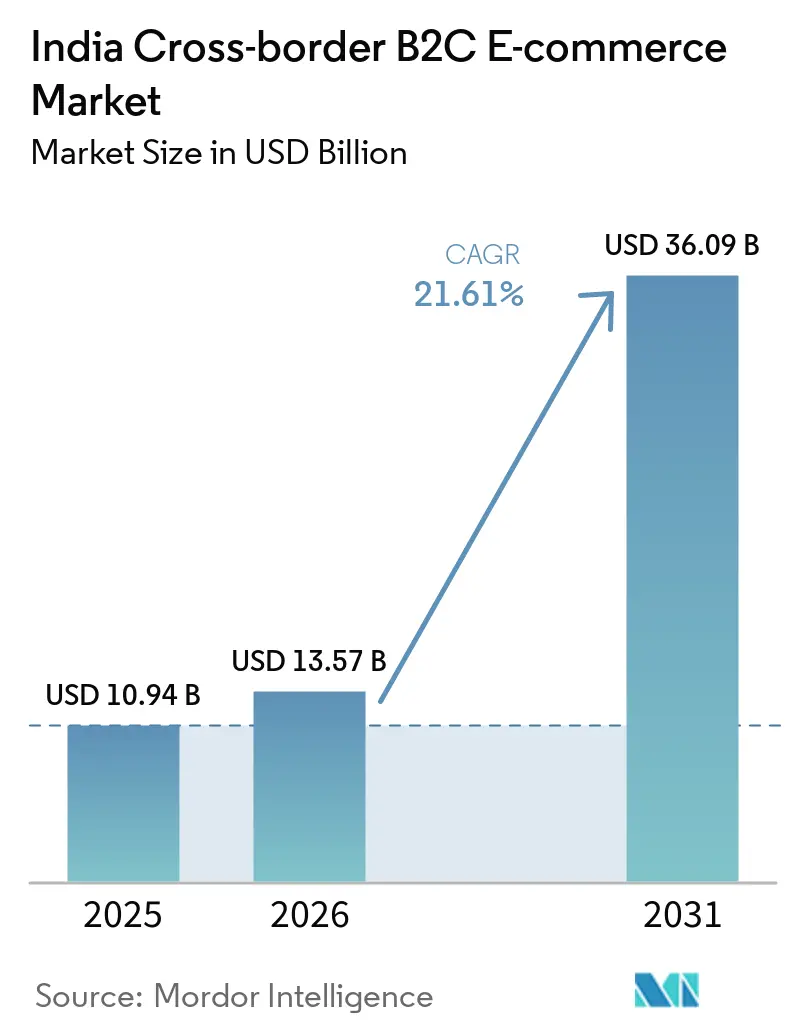
| Base Year Market Size (2025) | USD 10.94 Billion |
| Market Size (2026) | USD 13.57 Billion |
| Market Size (2031) | USD 36.09 Billion |
| Growth Rate (2026 - 2031) | 21.61% CAGR |
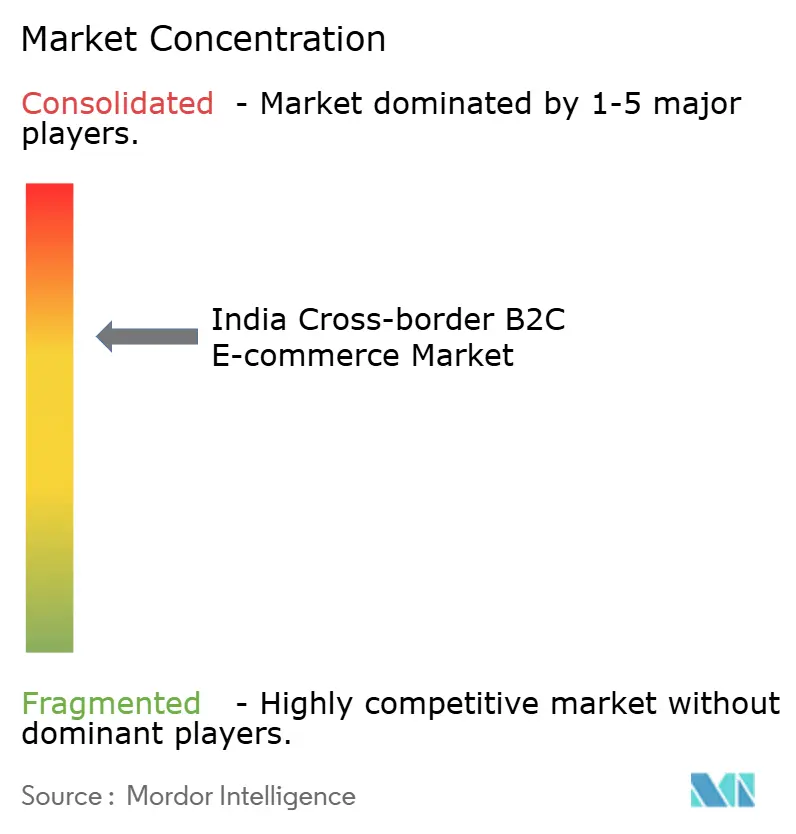
| Market Concentration | Medium |
Major Players *Disclaimer: Major Players sorted in no particular order Image © Mordor Intelligence. Reuse requires attribution under CC BY 4.0. | |
India Cross-border B2C E-commerce Market Analysis by Mordor Intelligence
The India cross-border B2C e-commerce market size is expected to increase from USD 10.94 billion in 2025 to USD 13.57 billion in 2026 and reach USD 36.09 billion by 2031, growing at a CAGR of 21.61% over 2026-2031.
The India cross-border B2C e-commerce market carries a rare two-way structure, because the country is expanding as both a large import destination for premium global goods and a scaling export origin for small sellers serving overseas demand. Export participation is expanding through marketplace-led onboarding, and Amazon Global Selling alone had more than 200,000 exporters from 28 states by late 2025, underscoring how platform infrastructure is widening access beyond a narrow seller base. Policy support is also widening access, with Dak Niryat Kendras extending export pathways into smaller clusters and giving postal channels a larger role in seller participation nationwide. India’s digital base continues to support discovery and transaction growth, as internet users crossed 950 million in 2025 and total internet subscribers reached 1.028 billion by December 2025. Payment reform is improving settlement options for merchants, but duties, returns friction, and documentation burdens still make operating conditions uneven for smaller exporters and price-aware buyers.
Key Report Takeaways
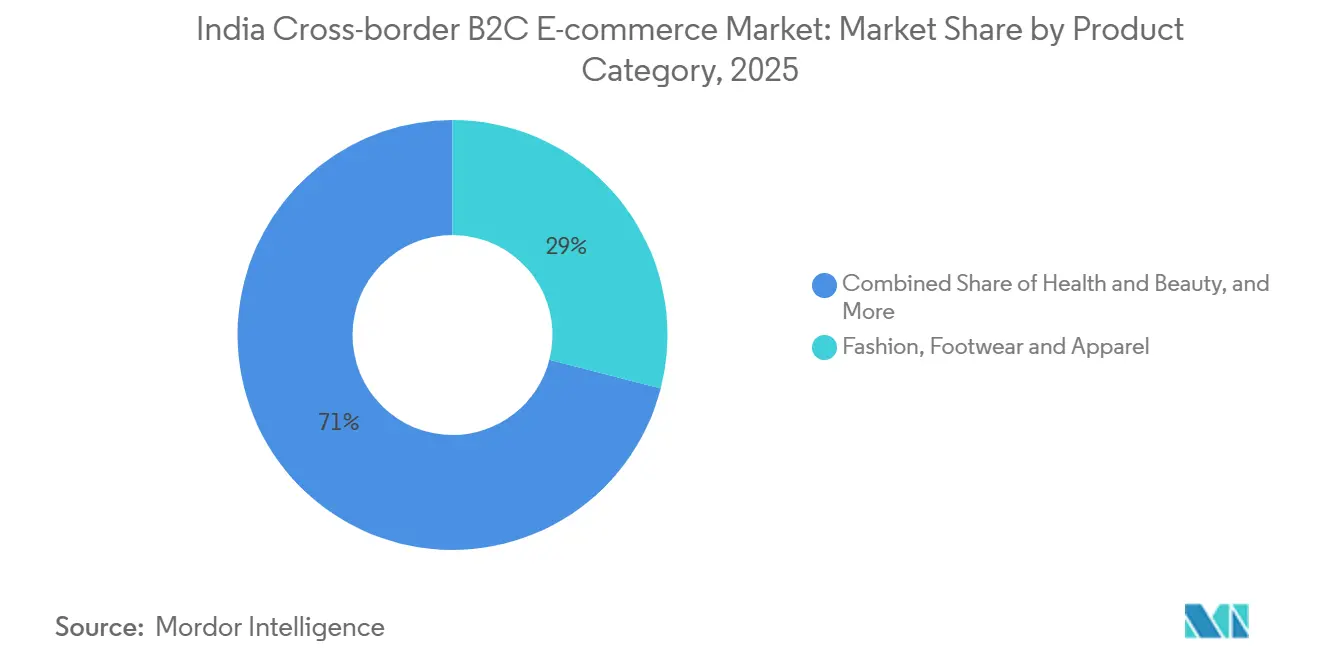
- By product category, fashion, footwear & apparel accounted for 29.00% of India cross-border B2C e-commerce market share in 2025, while it is forecast to expand at a 23.11% CAGR through 2031.
- By sales channel, online marketplaces held 71.28% of India cross-border B2C e-commerce market share in 2025, while social commerce is projected to grow at a 27.03% CAGR through 2031.
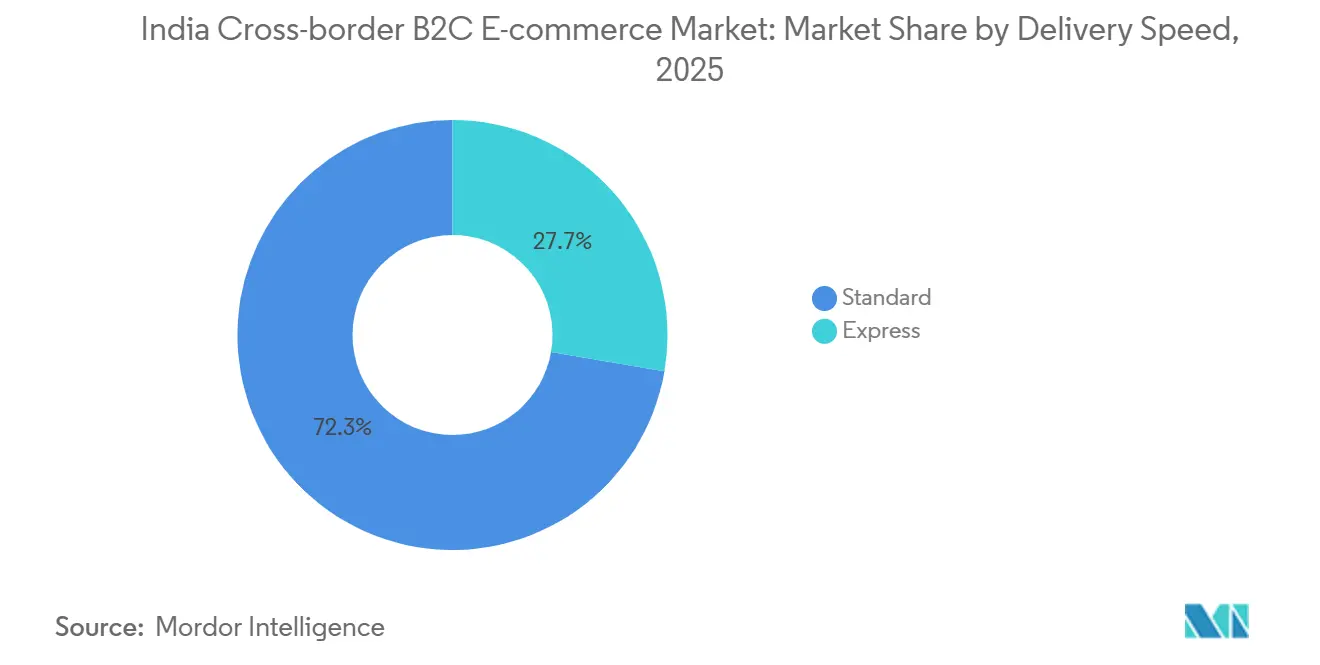
- By delivery speed, standard delivery accounted for 72.30% share of the India cross-border B2C e-commerce market size in 2025, while express delivery is advancing at a 20.20% CAGR through 2031.
- By country and flow direction, inbound (imports) held 62.86% of India cross-border B2C e-commerce market share in 2025, while outbound (exports) are forecast to expand at a 26.54% CAGR through 2031.
Note: Market size and forecast figures in this report are generated using Mordor Intelligence’s proprietary estimation framework, updated with the latest available data and insights as of January 2026.
India Cross-border B2C E-commerce Market Trends and Insights
Drivers Impact Analysis*
| Driver | (~) % Impact on CAGR Forecast | Geographic Relevance | Impact Timeline |
|---|---|---|---|
| Smartphone and affordable-data led international product discovery | +4.20% | National, deepest impact in Tier 2/3 cities and semi-urban corridors | Short term (≤ 2 years) |
| Marketplace-led access to global buyers and premium global brands | +3.80% | Global, highest concentration in US, UAE, UK outbound and inbound corridors | Medium term (2-4 years) |
| FTP 2023, Dak Niryat Kendras, and Postal-Export Incentives | +3.10% | National, last-mile gains in hinterland and landlocked export clusters | Medium term (2-4 years) |
| Cross-border payment stack expansion and multi-currency acceptance | +2.50% | Global, with core UPI linkages in UAE, Singapore, UK, spill-over to GCC, ASEAN | Medium term (2-4 years) |
| US-China tariff realignment favoring india-origin discretionary exports | +2.90% | US-India corridor, secondary gains in EU, UK, Australia | Short term (≤ 2 years) |
| Diaspora and festive-demand clustering in key corridors | +2.20% | UAE, US, UK, Canada, Australia, NRI-dense markets with Indian cultural calendar | Short term (≤ 2 years) to Medium term (2-4 years) |
| Source: Mordor Intelligence | |||
Smartphone and Affordable-Data Led International Product Discovery
India’s internet base is now large enough to make international product discovery part of everyday browsing behavior rather than a niche urban activity. Internet users crossed 950 million in 2025, and total internet subscribers reached 1.028 billion by December 2025, which shows the depth of the digital funnel now feeding the India cross-border B2C e-commerce market. Wireless broadband connections reached 983 million, reinforcing a mobile-first shopping pattern in which cross-border browsing begins on handheld devices and often continues across apps, chat, and creator content[1]“Quarterly Performance Indicator Report, Q3 2025-26,” TRAI, trai.gov.in. This matters because it lowers the practical barrier between discovery and transaction for both imported products and India-origin export catalogs. It also means cross-border intent is no longer confined to metro buyers, since the same mobile rails now support browsing and order formation in smaller cities and semi-urban corridors. For the India cross-border B2C e-commerce market, which keeps widening the base of future buyers and sellers without requiring a separate infrastructure cycle.
Marketplace-Led Access to Global Buyers and Premium Global Brands
Marketplace enablement remains the main route through which Indian MSMEs reach overseas buyers at scale. Amazon Global Selling had more than 200,000 exporters from 28 states by late 2025, and cumulative e-commerce exports from India crossed USD 20 billion ahead of schedule, with a new target of USD 80 billion by 2030. That scale matters because these platforms do more than list products. They absorb a large share of the discovery, logistics, payments, and onboarding burden that small exporters would struggle to handle on their own. The India cross-border B2C e-commerce market therefore, grows not only from consumer demand, but also from the way platform tools reduce the cost of participation for new sellers. The trade-off is concentration: sellers who depend too heavily on a single platform remain exposed to search ranking changes, policy shifts, and fee revisions.
FTP 2023, Dak Niryat Kendras, and Postal-Export Incentives
Policy changes are giving smaller exporters a more practical path into cross-border trade. Dak Niryat Kendras are now operating through a wide post office network, which extends export handling into locations that are far from major ports and private logistics hubs[2]“RoDTEP Scheme and Export Promotion Mission,” PIB, pib.gov.in. This is important for artisans, weavers, and regional MSMEs whose main constraint is not product demand but access to usable export channels. The broader export incentive architecture also remains active in 2026, with the government continuing to position RoDTEP and related trade support measures as part of its export promotion efforts. In practical terms, the India cross-border B2C e-commerce market benefits when smaller sellers can ship through familiar local networks instead of relying only on high-cost formal gateways. That shifts cross-border participation from a major-city model toward a wider national seller footprint.
Cross-Border Payment Stack Expansion and Multi-Currency Acceptance
Payment capability is becoming a more material growth driver as sellers move from platform dependence toward mixed channel strategies. RBI-linked FEMA reforms in early 2025 were intended to encourage the use of Indian rupees in cross-border settlements, thereby supporting greater flexibility in invoicing and settlement design. That matters for the India cross-border B2C e-commerce market because merchants increasingly need to present country-specific pricing, support multiple payment methods, and reduce currency settlement friction across storefronts and marketplaces. Better payment rails also improve cash visibility, which is critical for small sellers managing export working capital. Even so, the benefits are not evenly distributed because larger sellers adopt compliant settlement structures faster than micro sellers with limited finance teams. The result is a payment stack that is clearly improving, while still leaving smaller exporters with a heavier learning curve.
Restraints Impact Analysis*
| Restraint | (~) % Impact on CAGR Forecast | Geographic Relevance | Impact Timeline |
|---|---|---|---|
| Duties, GST, and No-De-Minimis landed-cost opacity for Indian importers | -1.80% | National, concentrated among Tier 1 and Tier 2 aspirational consumers importing mid-value goods | Short term (≤ 2 years) to Medium term (2-4 years) |
| Shipping, returns, and authenticity anxiety in cross-border fulfillment | -1.50% | Global, most acute on long-haul corridors, US, Europe to India and Indian exports to US, EU | Medium term (2-4 years) |
| RBI/FEMA realization timelines, variance caps, and EDPMs compliance costs | -1.20% | National, disproportionate impact on small-ticket exporters and D2C sellers | Short term (≤ 2 years) to Medium term (2-4 years) |
| Reverse-logistics re-import friction and customs-code gaps | -0.90% | National, India-US, India-UK, and India-EU return corridors most affected | Medium term (2-4 years) |
| Source: Mordor Intelligence | |||
Duties, GST, and No-De-Minimis Landed-Cost Opacity
Landed-cost visibility remains one of the clearest conversion barriers on the inbound side of the India cross-border B2C e-commerce market. Indian buyers still face duties and GST on low-value international purchases, which means the final payable amount is often less transparent than it is in markets with a higher threshold for duty-free entry. The 2026 budget reduced the basic customs duty on personal imports to 10% from April 1, 2026, which clearly improves the pricing position for some imported categories. Even with that change, taxes still affect the final delivered price and keep many buyers sensitive to checkout clarity. This matters most in categories where demand is aspirational but not urgent, because surprise charges weaken repeat purchase intent. As long as landed-cost communication remains uneven across platforms and sellers, inbound scale will remain below potential.
RBI/FEMA Realization Timelines, Variance Caps, and EDPMs Compliance Costs
Compliance remains a heavier burden for small exporters than for established sellers. Cross-border merchants have to align receipts, bank documentation, and reporting requirements with shipment records, and that process adds fixed work even when order values are small. The India cross-border B2C e-commerce market therefore, rewards sellers who already have strong finance discipline or access to platform support. RBI-linked reforms are helping by widening settlement flexibility, but they do not remove the operational burden of reconciling export receipts and managing reporting workflows[3]“Liberalization of FEMA Regulations to Encourage Use of Indian Rupee for Settlement of Cross-Border Transactions,” IIBF, iibf.org.in. For D2C brands and small-ticket exporters, these costs can erode margins more quickly than for large marketplace-first sellers. The effect is not large enough to stop market growth, but it does shape which seller groups can scale fastest.
*Our forecasts treat driver/restraint impacts as directional, not additive. The impact forecasts reflect baseline growth, mix effects, and variable interactions.
Segment Analysis
By Product Category: Apparel Leads While Niche Categories Build Depth
Fashion, footwear & apparel accounted for 29.00% share of the India cross-border B2C e-commerce market size in 2025, and it is projected to expand at a 23.11% CAGR through 2031. That rare combination of category leadership and fastest growth points to a segment that is benefiting from both broad demand and strong supply readiness. The category is supported by India’s deep base in ethnic textiles, artisanal products, value-fashion production, and flexible MSME manufacturing, which together suit cross-border small-parcel selling. It also benefits from the fact that fashion works well in marketplace discovery, creator-led promotion, and direct-to-consumer storytelling, giving sellers multiple routes to reach overseas buyers. The category’s strength therefore reflects more than product popularity, because it also reflects the compatibility between India’s production structure and the way international digital commerce works.
The next layer of demand is more balanced across import-heavy and export-heavy categories. Health & beauty and consumer electronics remain important on the inbound side, where Indian buyers look for global brands, premium formulations, and product specifications that are not always fully replicated in the domestic market. Home & office products and hobbies & toys add export depth, especially where craftsmanship, decorative value, or niche product identity supports better pricing. Automotive parts remain smaller in transaction count, but they offer higher unit values and give the India cross-border B2C e-commerce industry exposure to a more specialized buyer base. The long tail of remaining categories is also meaningful because it broadens order mix and reduces dependence on a single demand theme. Over time, that category spread makes the market more resilient, since growth can continue even when one category faces temporary policy or logistics pressure.


By Sales Channel: Marketplaces Anchor Volume While Social Commerce Expands Discovery
Online marketplaces held 71.28% of India cross-border B2C e-commerce market share in 2025, which confirms that platform-led selling remains the main operating model for cross-border transactions. This dominance is rooted in function as much as in reach. Marketplaces reduce entry barriers for MSMEs by combining storefront visibility with logistics support, payment collection, and parts of the compliance process in one environment. For many new exporters, that bundled structure is the difference between participating and staying offline. It also explains why a few large platforms have become so central to the India cross-border B2C e-commerce market, especially on the export side where seller enablement matters as much as consumer demand.
Social commerce is the fastest-growing sales channel, with a projected CAGR of 27.03% through 2031, and it is changing how products are discovered even when checkout still happens elsewhere. The strength of this model comes from visual trust, live interaction, and the way creators compress product explanation into formats buyers already consume every day. That matters most in fashion, beauty, wellness, and lifestyle categories, where confidence often builds before the transaction page is opened. Direct-to-consumer webstores occupy the third layer of the channel mix and are gaining relevance where branding, country-specific pricing, and control over customer experience justify the effort. This part of the India cross-border B2C e-commerce industry is still smaller than marketplaces, but it matters disproportionately for premium and artisanal sellers who do not want brand value diluted by marketplace competition. The channel structure is therefore becoming more layered, with platforms driving scale, social media shaping discovery, and webstores serving higher-control brand strategies.
By Delivery Speed: Standard Retains Scale While Express Gains Premium Demand
Standard delivery accounted for 72.30% share of the India cross-border B2C e-commerce market size in 2025, while express delivery is projected to grow at a 20.20% CAGR through 2031. The current balance clearly reflects the economics of the market. Many exporters still compete on affordability, and many inbound buyers remain willing to wait longer if the final price stays lower. That keeps standard shipping attractive for categories such as apparel, home décor, handicrafts, and other purchases that are planned rather than urgent. In a market where average order economics still matter heavily, standard delivery remains the most scalable default option across a large share of transactions.
Express delivery is growing as the buyer mix gradually changes. Premium categories place more value on tracking, predictability, authenticity support, and faster issue resolution, and that makes express shipping more relevant even when it costs more. On the export side, sellers gain from better tracking visibility and stronger service perception in overseas markets. On the import side, faster fulfillment reduces hesitation around high-value purchases, especially when buyers worry about counterfeit risk or unclear after-sales support. The India cross-border B2C e-commerce market is therefore likely to keep its volume base in standard shipping while steadily shifting more high-value orders toward express. That is not a sudden change, but it is a meaningful change in how value is distributed across the delivery mix.
By Country and Flow Direction: Inbound Leads Today While Export Momentum Builds Faster
Inbound imports held 62.86% of India cross-border B2C e-commerce market share in 2025, while outbound exports are forecast to grow at a 26.54% CAGR through 2031. The current structure shows that India remains a large destination for premium electronics, beauty products, fashion labels, and other aspirational goods sourced from abroad. This inbound weight reflects consumer appetite, brand gaps in selected niches, and a willingness among upper and middle-income shoppers to pay for differentiated global products. At the same time, the faster growth on the export side shows that seller participation is expanding more quickly than current market weight suggests. That combination gives the India cross-border B2C e-commerce market an unusual profile where present scale and future momentum sit on different sides of the trade flow.
The outbound side is being pushed by platform-based seller onboarding, wider regional participation, and product categories that suit small-parcel shipping. Amazon’s exporter base crossed 200,000 sellers from 28 states, which shows how broad the seller expansion has already become. The United States, the United Kingdom, and the UAE continue to matter heavily because they combine market size, familiarity with Indian goods, and strong diaspora links. Chinese-origin goods still influence inbound trade patterns, but the route is more constrained because major Chinese consumer apps remain restricted in India. Over the forecast period, the flow mix is likely to become more balanced, not because inbound demand weakens, but because export capacity is scaling from a lower base with stronger recent momentum.
Geography Analysis
The United States remains the most important geography in the India cross-border B2C e-commerce market, because it acts as a major destination for Indian exports and an important origin for premium inbound demand. This corridor matters not only for size, but also for category breadth, since it supports fashion, home goods, toys, health & beauty, and electronics demand across both directions of trade. Amazon’s export milestone from India highlights how central overseas demand has become to Indian seller expansion, and the United States remains the key reference market in that export buildout. The corridor also shapes platform strategy, because success in the United States often determines whether Indian sellers invest further in product adaptation, packaging, compliance, and paid discovery. On the inbound side, the United States corridor remains important for premium consumer categories where Indian buyers seek authentic branded goods with specifications and assortments not always available through domestic channels.
The UAE and the United Kingdom form the next most important corridor set, and their importance comes from a mix of diaspora demand, purchasing power, and familiarity with Indian product categories. These markets are particularly relevant for fashion, festive buying, wellness products, and home-oriented categories that benefit from cultural alignment and repeat seasonal demand. Germany sits within the broader European opportunity set and matters because it reflects a more diversified export path beyond the traditional English-speaking corridors. The India cross-border B2C e-commerce market benefits from this second tier because it spreads demand risk across multiple destinations instead of concentrating entirely on one market.
Other geographies are also widening the addressable map for sellers. Australia, Canada, and Singapore continue to matter because they combine diaspora-linked demand with relatively clear consumer receptivity to Indian products. Emerging outbound corridors such as Spain, Italy, France, South Africa, Malaysia, Belgium, and Mexico show that India-origin sellers are no longer limited to a narrow three-market template. Postal reach is also improving the practical addressability of smaller destinations, because the Department of Posts has been adding tracked packet service reach to additional countries through its international network expansion. For inbound trade, East and Southeast Asian sources remain relevant for technology-adjacent and niche manufactured goods where Indian consumers still look abroad for choice or specifications[4]“Dak Ghar Niryat Kendras (DNK) – Export Through Post Offices,” Council for Leather Exports, leatherindia.org. The India cross-border B2C e-commerce market is therefore becoming more geographically distributed, even though the United States, UAE, and the United Kingdom still anchor the main trade logic.
Competitive Landscape
The India cross-border B2C e-commerce market remains fragmented overall, but competition is uneven across trade flows and business models. On the export side, a few large enablement platforms hold the strongest strategic positions because they combine seller onboarding, demand generation, logistics support, and payment infrastructure into a single operating stack. Amazon is the clearest example, with more than 200,000 exporters from 28 states and cumulative e-commerce exports from India crossing USD 20 billion ahead of schedule. Its declared target of USD 80 billion by 2030 shows that leading platforms are competing not only for transactions, but also for long-horizon control over seller relationships. That makes platform depth more important than simple traffic scale, because sellers tend to stay where compliance, payments, and fulfillment are easiest to manage.
A second layer of competition sits in D2C and artisan-focused export selling. Shopify and Etsy matter here because they give sellers more control over brand identity, customer data, and country-specific storefront design. This layer is smaller than the marketplace core, but it serves products that benefit from storytelling, authenticity, and presentation to support higher price realization. The India cross-border B2C e-commerce market, therefore, has one set of leaders built around scale and another set built around brand control. That split keeps the market from becoming fully consolidated, even when a few companies dominate onboarding visibility.
On the import side, regulatory constraints create a different kind of competition. The absence or restricted presence of major low-price Chinese apps has left a gap in the mass-value import space, which means no single platform has fully captured the broad low-ticket inbound opportunity at legal scale. Domestic players such as Flipkart and Meesho remain relevant because they already understand Indian demand patterns and can extend seller or sourcing capabilities over time. Walmart’s FY26 Q1 earnings release showed Flipkart’s advertising business growing 32%, which indicates improving monetization capacity that could support broader platform investment. Amazon’s April 2026 investment of INR 2,800 crores (USD 311.63 million) in pan-India operations is another clear strategic move, because it reinforces the logistics layer that supports both domestic and cross-border commerce. Competitive intensity is therefore high, but the structure is asymmetric, with export enablement more platform-led and inbound whitespace still shaped by regulation, trust, and landed-cost transparency.
India Cross-border B2C E-commerce Industry Leaders
Amazon, Inc.
Etsy
Shopify
Shopee
eBay, Inc.
- *Disclaimer: Major Players sorted in no particular order

Recent Industry Developments
- June 2026: iThink Logistics took a significant step to support Indian sellers, including MSMEs and Etsy sellers, by launching live cross-border shipment tracking. Covering over 220 countries, this initiative addressed a long-standing transparency gap in Indian export logistics, giving buyers more confidence in India's direct-to-consumer and marketplace exports.
- April 2026: Amazon India announced an investment of over INR 2,800 crore (USD 311.63 million) to expand pan-India fulfillment centers, sortation centers, and delivery stations, supporting both domestic and cross-border export logistics. The investment is part of Amazon's broader USD 35 billion commitment to India by 2030.
- December 2025: FedEx opened a cutting-edge 60,000 ft² integrated hub at Bengaluru Airport, designed to make import and export operations faster and more efficient. By incorporating automated systems and bonded customs, FedEx is helping businesses in key sectors improve their supply chain efficiency and strengthen export connectivity in India.
- September 2025: UPS expanded its intra-Asia air network, making it easier for Indian exporters and importers to connect with other Asian markets. By increasing flight frequencies and deploying larger aircraft, UPS improved delivery speeds and cargo capacity. This upgrade supports sectors like healthcare, technology, and industrial goods, while also enabling e-commerce sellers to deliver faster and replenish inventory more efficiently, enhancing India's regional trade links and supply chain performance.


India Cross-border B2C E-commerce Market Report Scope
| Fashion, Footwear and Apparel |
| Health and Beauty / Personal Care |
| Home and Office |
| Hobbies and Toys |
| Consumer Electronics and Appliances |
| Automotive Parts |
| Rest of the Product Categories |
| Online Marketplaces |
| Direct-to-Consumer (Webstores) |
| Social Commerce (Live, Chat) |
| Express |
| Standard |
| Outbound (Exports) | United States |
| United Arab Emirates | |
| United Kingdom | |
| Germany | |
| Saudi Arabia | |
| Canada | |
| Singapore | |
| Australia | |
| Netherlands | |
| China | |
| France | |
| Italy | |
| Mexico | |
| Spain | |
| South Korea | |
| Japan | |
| South Africa | |
| Malaysia | |
| Belgium | |
| Hong Kong | |
| Rest of the Countries | |
| Inbound (Imports) | United States |
| China | |
| United Kingdom | |
| United Arab Emirates | |
| Australia | |
| Germany | |
| Saudi Arabia | |
| Singapore | |
| Canada | |
| Netherlands | |
| Japan | |
| South Korea | |
| Switzerland | |
| Hong Kong | |
| Indonesia | |
| Thailand | |
| Malaysia | |
| Taiwan | |
| France | |
| Italy | |
| Rest of the Countries |
| By Product Category | Fashion, Footwear and Apparel | |
| Health and Beauty / Personal Care | ||
| Home and Office | ||
| Hobbies and Toys | ||
| Consumer Electronics and Appliances | ||
| Automotive Parts | ||
| Rest of the Product Categories | ||
| By Sales Channel | Online Marketplaces | |
| Direct-to-Consumer (Webstores) | ||
| Social Commerce (Live, Chat) | ||
| By Delivery Speed | Express | |
| Standard | ||
| By Country and Flow Direction | Outbound (Exports) | United States |
| United Arab Emirates | ||
| United Kingdom | ||
| Germany | ||
| Saudi Arabia | ||
| Canada | ||
| Singapore | ||
| Australia | ||
| Netherlands | ||
| China | ||
| France | ||
| Italy | ||
| Mexico | ||
| Spain | ||
| South Korea | ||
| Japan | ||
| South Africa | ||
| Malaysia | ||
| Belgium | ||
| Hong Kong | ||
| Rest of the Countries | ||
| Inbound (Imports) | United States | |
| China | ||
| United Kingdom | ||
| United Arab Emirates | ||
| Australia | ||
| Germany | ||
| Saudi Arabia | ||
| Singapore | ||
| Canada | ||
| Netherlands | ||
| Japan | ||
| South Korea | ||
| Switzerland | ||
| Hong Kong | ||
| Indonesia | ||
| Thailand | ||
| Malaysia | ||
| Taiwan | ||
| France | ||
| Italy | ||
| Rest of the Countries | ||


Key Questions Answered in the Report
What is the 2026 size of the India cross-border B2C e-commerce space?
The India cross-border B2C e-commerce market stands at USD 13.57 billion in 2026 and is projected to reach USD 36.09 billion by 2031 at a 21.61% CAGR.
Which product category is leading growth in India’s cross-border online retail flows?
Fashion, footwear & apparel led with a 29.00% share in 2025 and is also the fastest-growing category with a 23.11% CAGR through 2031.
Why do online marketplaces still dominate cross-border transactions in India?
Online marketplaces held 71.28% share in 2025 because they reduce seller friction by bundling discovery, logistics, payments, and parts of the compliance process.
Is import demand or export demand larger in India right now?
Inbound imports were larger in 2025 with a 62.86% share, but outbound exports are growing faster and are forecast to expand at a 26.54% CAGR through 2031.
What is driving faster adoption of express delivery for international orders?
Express delivery is growing at a 20.20% CAGR because premium buyers value better tracking, faster delivery, and more confidence on authenticity and returns.
Which countries matter most for India’s cross-border B2C activity?
The United States is the most important corridor, while the UAE and the United Kingdom form the next key set of markets because they combine demand scale, diaspora links, and strong fit with Indian product categories.
Page last updated on:


