Market Overview
| Study Period | 2017 - 2030 |
|---|---|
| Forecast Data Period | 2025 - 2030 |
| Historical Data Period | 2017 - 2023 |
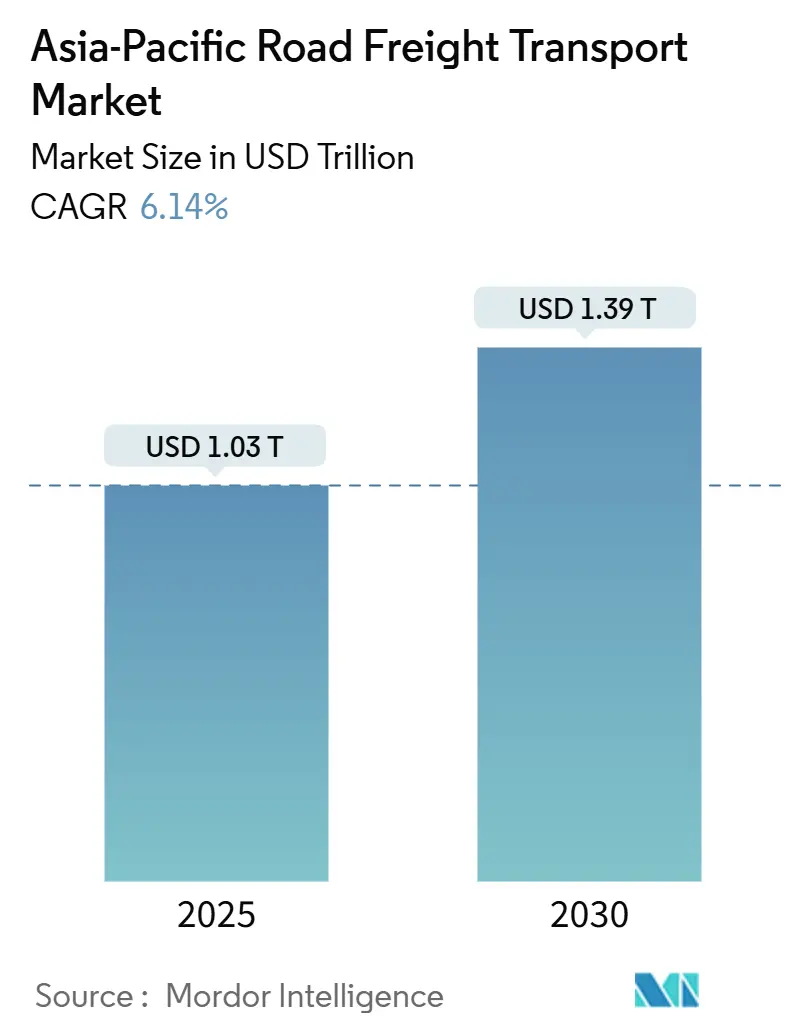
| Market Size (2025) | USD 1.03 Trillion |
| Market Size (2030) | USD 1.39 Trillion |
| Growth Rate (2025 - 2030) | 6.14% CAGR |
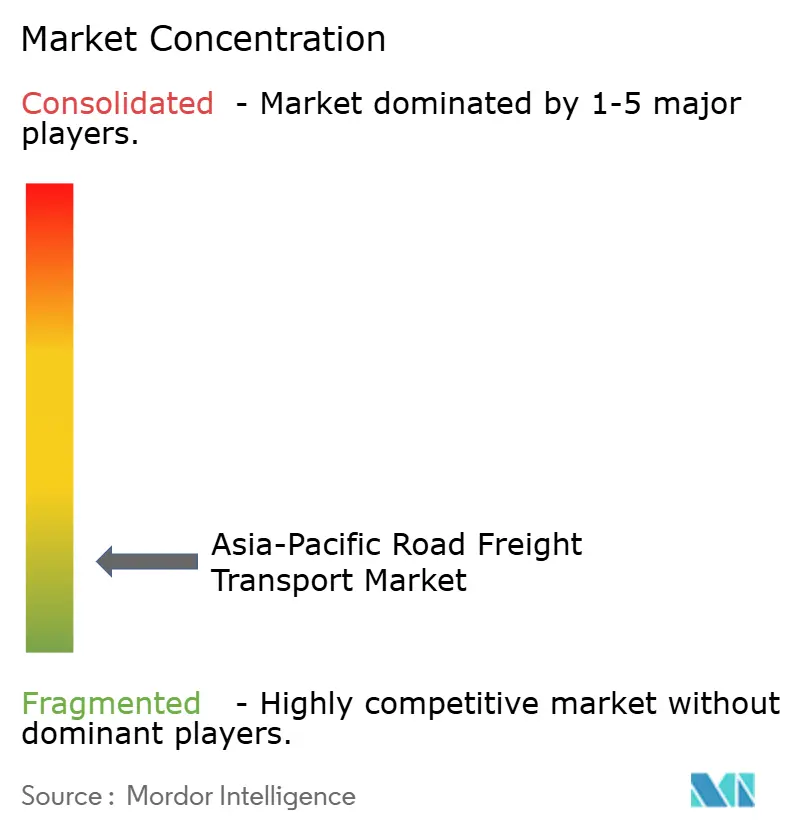
| Market Concentration | Low |
Major Players *Disclaimer: Major Players sorted in no particular order Image © Mordor Intelligence. Reuse requires attribution under CC BY 4.0. | |
Asia-Pacific Road Freight Transport Market Analysis by Mordor Intelligence
The Asia-Pacific road freight transport market size reached USD 1,033.74 billion in 2025 and is projected to advance at a 6.14% CAGR between 2025-2030 to USD 1,392.76 billion by 2030. Robust manufacturing activity, a surge in e-commerce parcels, and customs digitalization across ASEAN collectively underpin this expansion. Battery-swapping electric trucks in China lower operating costs relative to diesel fleets and accelerate long-haul electrification. Infrastructure mega-projects—many aligned with Belt-and-Road corridors—reduce transit times between production clusters and export gateways, while temperature-controlled logistics investments widen pharmaceutical and fresh-food distribution reach. Meanwhile, tightening driver availability in Japan, South Korea, and Australia is prompting heightened adoption of autonomous technologies and route-optimization software.
Key Report Takeaways
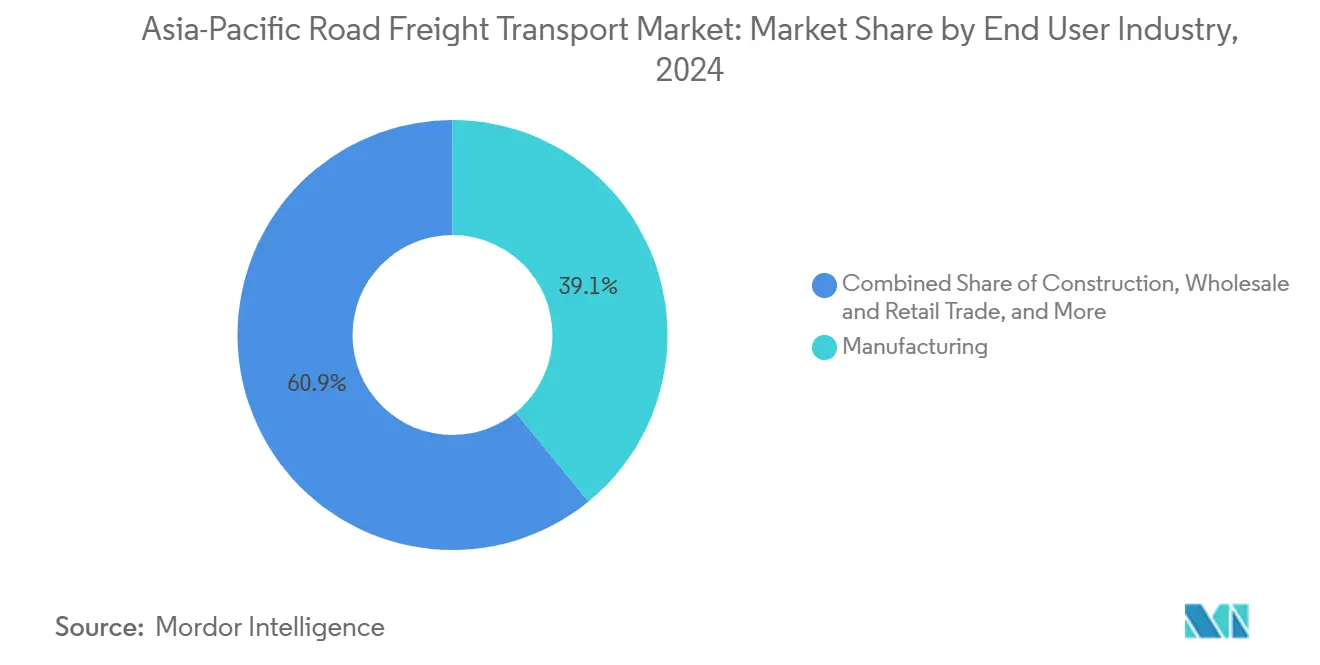
- By end user industry, manufacturing led with 39.08% of the Asia-Pacific road freight transport market share in 2024; wholesale and retail trade is projected to record the fastest 6.95% CAGR between 2025-2030.
- By destination, domestic freight commanded 70.74% of the Asia-Pacific road freight transport market size in 2024, while international freight is forecast to expand at a 7.77% CAGR between 2025-2030.
- By truckload specification, full-truck-load operations captured 80.29% share in 2024; less-than-truck-load services are set to grow the quickest at 6.93% CAGR between 2025-2030.
- By containerization, non-containerized cargo held 86.42% of revenue in 2024, whereas containerized freight is expected to rise at a 6.35% CAGR between 2025-2030.
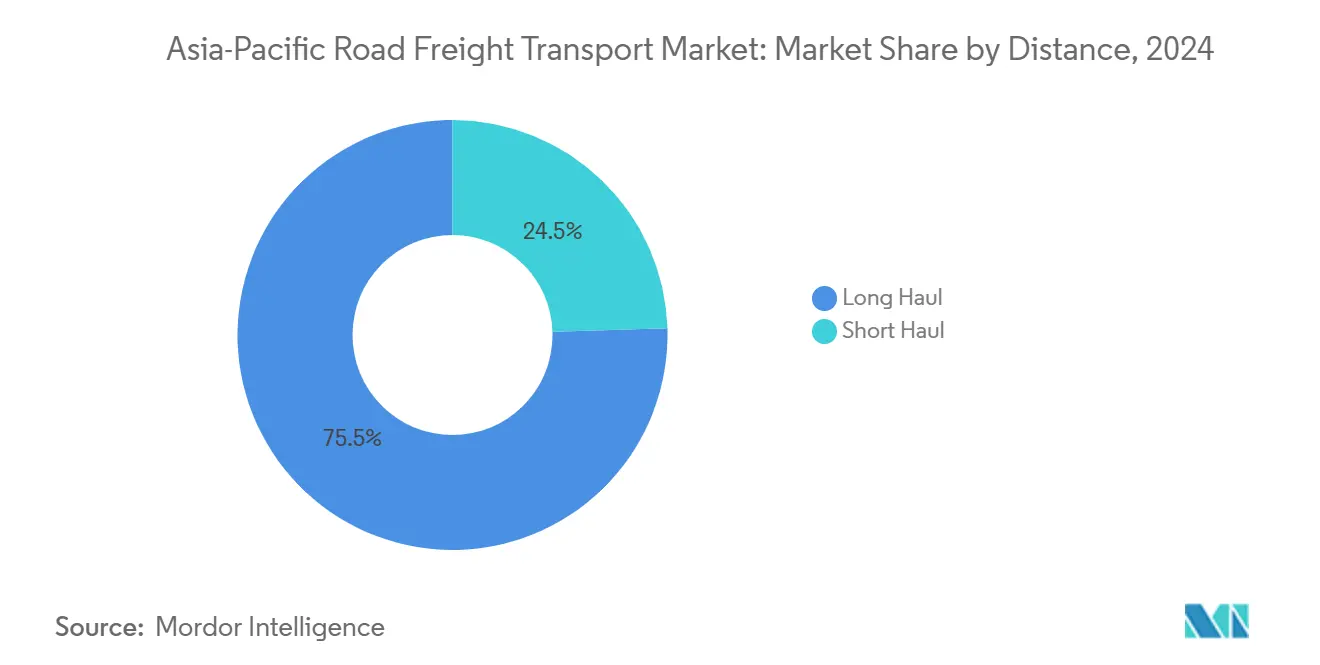
- By distance, long-haul shipments dominated with a 75.48% share in 2024 and also lead growth with a 6.45% CAGR between 2025-2030.
- By goods configuration, solid goods accounted for 69.29% of revenue in 2024; fluid goods represent the fastest-growing category at a 6.41% CAGR between 2025-2030.
- By temperature control, non-temperature-controlled freight comprised 94.38% share in 2024, whereas temperature-controlled logistics is anticipated to post the highest 5.62% CAGR over 2025-2030.
- By country, China accounted for 45.77% of revenue in 2024; while India is set to log the quickest 8.95% CAGR between 2025-2030
Asia-Pacific Road Freight Transport Market Trends and Insights
Drivers Impact Analysis*
| Driver | (~) % Impact on CAGR Forecast | Geographic Relevance | Impact Timeline |
|---|---|---|---|
| Explosive e-commerce and omnichannel retail boom | +1.8% | China, India, Southeast Asia core markets | Short term (≤ 2 years) |
| Government mega-infrastructure programs and Belt-and-Road corridors | +1.2% | China, Central Asia, ASEAN connectivity routes | Long term (≥ 4 years) |
| Manufacturing resurgence in ASEAN and India | +1.0% | Vietnam, Thailand, India, Indonesia manufacturing hubs | Medium term (2-4 years) |
| Battery-swapping electric truck roll-out in China and early ASEAN pilots | +0.8% | China nationwide, pilot programs in Thailand, Malaysia | Medium term (2-4 years) |
| ASEAN Customs Transit System cuts border dwell-times | +0.6% | ASEAN member states, cross-border trade corridors | Short term (≤ 2 years) |
| Temperature-controlled niche boom across food and pharma | +0.4% | Regional cold chain networks, urban distribution centers | Medium term (2-4 years) |
| Source: Mordor Intelligence | |||


Explosive E-commerce and Omnichannel Retail Boom
Same-day and next-day delivery promises across digital marketplaces have reshaped freight flows in China, India, and fast-growing Southeast Asian economies. In 2024, Alibaba's Tmall really nailed its strategy of boosting brands, with more than 4,100 of them each generating over 100 million RMB in yearly sales[1]Alibaba Group, “Tmall Peak-Season Delivery Statistics 2024,” alibabagroup.com. Reverse-logistics activity tied to online returns adds 15-20% extra mileage in mature e-commerce markets such as Japan and South Korea. Retailers deploying micro-fulfillment centers within 10 km of urban consumers increase demand for short-haul routes while maintaining pressure on real-time routing, load-pooling, and driver scheduling. This demand dynamic materially lifts the Asia-Pacific road freight transport market by elevating shipment frequency and reducing average load size, in turn favoring less-than-truck-load (LTL) and courier-express-parcel specialists.
Government Mega-Infrastructure Programs and Belt-and-Road Corridors
China’s Belt and Road Initiative continues to unlock new corridor capacity. A completed China-Pakistan Economic Corridor has halved Kashgar-to-Karachi truck transit times to 10 days, shifting modal preference from ocean detours to direct road links. Thailand’s USD 43 billion Eastern Economic Corridor improves connectivity between Laem Chabang port and manufacturing clusters, slashing origin-to-port travel times for automotive exporters[2]Eastern Economic Corridor Office, “Infrastructure Investment Progress Report 2024,” eeco.or.th. Vietnam’s North-South Expressway, scheduled for full commissioning by 2025, is forecast to cut Hanoi-Ho Chi Minh City road freight times by 40%, a critical enabler for just-in-time manufacturing models.
Manufacturing Resurgence in ASEAN and India
Diversification away from single-country sourcing has attracted significant foreign direct investment into Vietnam, Thailand, India, and Indonesia. Vietnam closed 2024 as the world’s second-largest exporter of mobile phones and parts, shipping USD 134.5 billion worth of electronics[3]Vietnam General Statistics Office, “Electronics Manufacturing Export Statistics 2024,” gso.gov.vn. India’s production-linked incentive schemes for automotive, textiles, and pharmaceuticals catalyzed multi-billion-dollar factory commitments that now require inbound raw-material trucking and outbound finished-goods distribution. Component movements within Thailand’s automotive clusters are rising due to improved intra-ASEAN sourcing. These developments have bolstered demand for full-truck-load lanes linking industrial parks to ports and border crossings, deepening the Asia-Pacific road freight transport market’s reliance on reliable, time-definite haulage.
Temperature-controlled Niche Boom Across Food and Pharma
COVID-19 vaccination programs embedded permanent pharmaceutical cold chains across Asia-Pacific, driving sustained demand for 2-8 °C transport capacity[4]World Health Organization, “Pharmaceutical Cold Chain Infrastructure Development,” who.int . DHL’s EUR 500 million (USD 551.82 billion) rollout of healthcare logistics hubs in Shanghai, Mumbai, Bangkok, and Jakarta expands regional availability of GDP-compliant temperature-controlled trucking. Meanwhile, Indonesia’s refrigerated storage capacity climbed significantly in 2024, reflecting modern retail adoption and higher fresh-food quality standards. South Korea’s fresh-food e-commerce players require multi-temperature trucks for citywide deliveries, further widening the opportunity for specialized carriers. Despite representing just 5.62% of total value, cold-chain freight advances faster than any other configuration, adding incremental, premium-yield tonnage to the Asia-Pacific road freight transport market.
Restraints Impact Analysis*
| Restraint | (~) % Impact on CAGR Forecast | Geographic Relevance | Impact Timeline |
|---|---|---|---|
| Driver shortage and wage inflation | -0.9% | Japan, South Korea, Australia, urban centers | Short term (≤ 2 years) |
| Chronic port-road congestion across mega-hubs | -0.7% | Shanghai, Singapore, Busan, Jakarta gateway cities | Medium term (2-4 years) |
| Carbon-reduction mandates lifting diesel fleet TCO | -0.5% | China, Japan, South Korea, Australia | Medium term (2-4 years) |
| Land-border bureaucracy and 'grey-area' facilitation costs | -0.3% | Cross-border corridors, customs checkpoints | Short term (≤ 2 years) |
| Source: Mordor Intelligence | |||
Driver Shortage and Wage Inflation
Japan projects the retirement of 36% of its truck drivers by 2030, forcing wage hikes that averaged 12-15% in 2024. Australia reported 26,000 vacant trucking positions, prompting high signing bonuses for long-haul recruits. South Korea’s 52-hour work-week ceiling curtails driver productivity, compelling fleets to enlarge headcount or compromise service levels. Labor scarcity raises the total cost of ownership for diesel fleets, eroding margins in an industry already contending with volatile fuel prices and tightening emission standards. Autonomous pilots in controlled port corridors show promise but remain commercially unviable for open-road deployment until sensor costs fall and regulatory frameworks mature.
Chronic Port-Road Congestion Across Mega-Hubs
Shanghai processed 50 million TEU in 2024, extending average truck dwell time to 4.2 hours during peak gate windows. Singapore’s limited landmass constrains the expansion of road capacity despite port throughput gains, leading to dynamic truck-access pricing schemes and incentives to shift boxes to inland depots. Busan’s hinterland roads face mixed passenger and freight traffic, creating morning and evening peaks that delay container drays. In Jakarta, Tanjung Priok’s urban location forces trucks through heavily congested arterial roads, inflating round-trip times and reducing asset turns. Congestion introduces schedule uncertainty that spills into factory supply chains and elevates logistics cost ratios across the Asia-Pacific road freight transport market.
*Our forecasts treat driver/restraint impacts as directional, not additive. The impact forecasts reflect baseline growth, mix effects, and variable interactions.
Segment Analysis
By End User Industry: Manufacturing Dominance Sustained Amid Diversification
Manufacturing held 39.08% of 2024 revenue as electronics, automotive, textile, and chemical producers relied on high-frequency replenishment of components from regional suppliers. This dominance translates into steady demand for full-truck-load lanes, bonded warehouse services, and synchronized cross-docking activities. The Asia-Pacific road freight transport market size for manufacturing consignments is forecast to climb, aided by ASEAN and Indian industrial policies that court relocated capacity from higher-cost economies.
In parallel, wholesale and retail trade will outpace all other end-users through 2030, propelled by omnichannel fulfillment models that rely on agile LTL networks for restocking and returns. Construction freight grows alongside mega-infrastructure projects, pulling bulk cement, steel rebar, and heavy machinery toward job sites. Agriculture and forestry continue shifting toward value-added cold-chain exports, catalyzing reefer-truck procurement in Vietnam and Thailand. Collectively, these divergent growth vectors diversify fleet composition, augmenting specialized service segments and strengthening the competitive fabric of the Asia-Pacific road freight transport market.


By Destination: Domestic Scale Coupled With Rising Cross-border Shifts
Domestic routes generated 70.74% of 2024 revenues as manufacturers, retailers, and e-commerce platforms served vast national consumer bases. In China alone, daily e-commerce pickups require dense intra-provincial distribution webs, reinforcing domestic carrier networks. However, international lanes are projected to expand 7.77% CAGR between 2025-2030 as RCEP and Belt-and-Road agreements remove regulatory frictions and standardize transit documentation across corridors.
Thailand now functions as a trucking hub that channels parts and consumer goods between Malaysia, Laos, and Cambodia, while Vietnam leverages new expressways to expedite exports into China’s southern provinces. E-commerce retailers such as JD.com replenish Southeast Asian fulfillment centers via scheduled cross-border drays, effectively internationalizing last-mile inventory positioning. Harmonized axle-load rules and digital carnets under ASEAN Transit protocols further lower cost-per-ton-kilometer on international legs, boosting the Asia-Pacific road freight transport market’s cross-border share without displacing entrenched domestic volumes.
By Truckload Specification: FTL Remains Predominant, LTL Gains Density
Full-truck-load captured 80.29% of 2024 turnover, reflecting the prevalence of large-lot manufacturing and bulk raw-material movements across extended distances. FTL services continue to benefit from dedicated freight corridors that permit higher gross-vehicle weights and overnight operations. Yet, as parcel volumes swell, LTL networks forecast a 6.93% CAGR between 2025-2030, particularly in populous metro regions where consolidation centers and advanced sortation automation raise stop density and lower cost per drop.
Digital freight platforms utilize AI-based algorithms to fill backhauls and co-load disparate shippers’ freight, shrinking the empty-mile penalty that historically disadvantaged LTL carriers. The Asia-Pacific road freight transport market size linked to LTL shipments will also attract venture funding into cloud-based track-and-trace systems and dynamic routing engines. Nonetheless, time-critical freight and synchronized manufacturing timetables safeguard the primacy of FTL for high-value or just-in-sequence cargoes, balancing service mix across carrier portfolios.
By Containerization: Bulk Retains Majority Amid Accelerating Standardization
Non-containerized cargo held 86.42% of 2024 sales, anchored by coal, ores, construction materials, and project cargo that resist modular packaging. Oversized wind-turbine blades and prefabricated building modules require specialized extendable trailers and police-escorted convoys, preserving demand for bespoke haulage firms.
Containerized freight, however, will grow near the overall market CAGR at 6.35% between 2025-2030 as electronics, apparel, and packaged foods increasingly ship in sealed TEU units to streamline intermodal transfers. Inland container depots in Vietnam’s Bac Ninh and Thailand’s Lat Krabang allow factory-door stuffing, reducing double handling and cutting repositioning of empties. As transport management systems integrate truck, rail, and river-barge legs under a single electronic documentation, container uptake will progressively chip away at bulk share, reshaping fleet mix within the Asia-Pacific road freight transport market.
By Distance: Long-haul Advantage Strengthened by Corridor Programs
Long-haul segments exceeding 500 km represented 75.48% of 2024 billings and are anticipated to grow 6.45% annually on the back of expressway build-out across China, India, and Indonesia. Dedicated truck lanes lower accident risk and permit higher cruising speeds that shorten door-to-door lead times. Infrastructure-enabled scale economies render road competitive versus rail for many high-value or time-sensitive consignments, consolidating the strategic role of long-haul providers.
Short-haul markets continue expanding in dense urban agglomerations, powered by e-commerce and convenience retail with high delivery frequency. Electric and hydrogen fuel-cell trucks see early adoption in city zones where range limitations align with daily mileage patterns and zero-emission regulations impose access surcharges on diesel vehicles. Together, the two distance bands complement each other and broaden carrier service offerings within the Asia-Pacific road freight transport market.
By Goods Configuration: Solid Goods Prevail, Fluid Goods Accelerate
Solid goods commanded 69.29% of 2024 revenue, spanning automotive parts, white goods, construction inputs, and consumer electronics. These items increasingly require load-security systems, real-time shock monitoring, and in-transit temperature stability to protect high-value contents. Meanwhile, fluid-goods revenue will rise 6.41% CAGR between 2025-2030 as chemical sector output, LNG imports, and dairy product flows intensify.
Petrochemical clusters in Singapore’s Jurong Island and Thailand’s Map Ta Phut invest in specialized stainless-steel tankers equipped with vapor-recovery systems to comply with stricter hazardous-goods regulations. Food-grade tanker demand rises in India and Indonesia, where bottled water and edible oil consumption spike. Consequently, niche fleets specializing in fluid commodities gain pricing power, boosting overall diversity of the Asia-Pacific road freight transport market.
By Temperature Control: Cold-chain Infrastructure Scales From Small Base
Non-temperature-controlled haulage constituted 94.38% of revenue in 2024, yet temperature-controlled services hold outsized growth potential at 5.62% CAGR between 2025-2030. Pharmaceutical shippers specify GDP-compliant trucks with telematics-integrated data loggers to satisfy regulatory audits. Concurrently, fresh-food e-grocers in South Korea and Japan require compartmentalized vehicles to carry multi-temperature consignments on single routes, thereby increasing asset utilization for cold-chain fleets.
Government incentives in Indonesia and Vietnam subsidize cold-store construction that anchors hub-and-spoke refrigerated truck networks. Premium rate structures—30-50% above dry-van tariffs—support investment paybacks within three to five years. As compliance demands climb, established cold-chain operators enjoy barriers to entry that fortify their position in the Asia-Pacific road freight transport market.
Geography Analysis
China accounted for 45.77% of 2024 revenue thanks to its vast consumer market, integrated industrial supply chains, and rapidly scaling electric-truck ecosystem that lowers per-kilometer energy costs. Belt-and-Road highway corridors funnel outbound freight toward Central Asia and mainland Southeast Asia, while internal expressway networks sustain high domestic tonnage. Growth moderates relative to emerging neighbors as services outpace manufacturing, yet cold-chain, e-commerce, and intermodal trucking continue to expand in double digits.
India delivers the fastest growth at 8.95% CAGR between 2025-2030 as GST implementation removes inter-state checkpoints and expressway construction shrinks average route lengths. Production-linked incentives in electronics and automotive heighten demand for time-definite components transport. Dedicated freight corridors connecting Mumbai with Delhi and Chennai unlock fresh long-haul opportunities, while rising urban incomes seed LTL and parcel services.
Japan, South Korea, and Australia focus on automation and zero-emission fleets to offset labor constraints and environmental commitments, respectively. Autonomous truck pilots at Japanese ports transition into limited public-road trials, and hydrogen fuel-cell vehicles gain traction in Australia where refueling infrastructure follows mining routes.
Competitive Landscape
The market remains fragmented but is consolidating as global logistics majors pursue scale and technology. DSV’s EUR 14.3 billion (USD 15.78 billion) acquisition of DB Schenker in April 2025 created the world’s largest contract logistics provider, reinforcing cross-border road capabilities between China and Southeast Asia. Similar strategic moves see established forwarders acquiring digital freight marketplaces to internalize load-matching algorithms and customer-centric dashboards.
Competitive differentiation pivots on technology adoption. Leading fleets outfit tractors with IoT sensors that feed predictive maintenance engines, reducing unscheduled downtime and optimizing fuel burn. Cloud-based transport-management systems marry AI route planning with dynamic scheduling, trimming empty miles for LTL operators and driving higher asset turns. Specialized niches—pharma cold chain, hazardous chemicals, and heavy-haul project cargo—offer attractive margins but demand regulatory compliance and bespoke equipment, raising entry barriers.
Venture-backed disruptors expand regionally but confront profitability challenges without physical asset bases. Partnerships with incumbents offer them a path to scale while delivering technology leaps to traditional carriers. Ongoing driver shortages and emission mandates accelerate trials of battery-swapping rigs, hydrogen tractors, and autonomous platooning solutions, signaling that hardware innovation will shape the strategic playbook in the Asia-Pacific road freight transport market over the next decade.
Asia-Pacific Road Freight Transport Industry Leaders
DHL Group
SF Express
DSV A/S
Nippon Express Holdings
Kuehne + Nagel
- *Disclaimer: Major Players sorted in no particular order

Recent Industry Developments
- September 2025: Kuehne + Nagel and LEGO inaugurated a regional distribution center in Dong Nai, Vietnam, to support ASEAN e-commerce fulfillment.
- April 2025: DHL Group announced a EUR 500 million (USD 551.82 million) healthcare logistics program across Asia-Pacific, building temperature-controlled distribution centers in Shanghai, Mumbai, Bangkok, and Jakarta.
- April 2025: DSV completed its EUR 14.3 billion (USD 15.78 billion) acquisition of DB Schenker, creating the world’s largest contract logistics provider and strengthening cross-border capabilities between China and Southeast Asia.
- June 2024: Linfox introduced Volvo battery-electric prime movers into its Australian fleet to serve medium-range routes while reducing emissions.


Asia-Pacific Road Freight Transport Market Report Scope
Agriculture, Fishing, and Forestry, Construction, Manufacturing, Oil and Gas, Mining and Quarrying, Wholesale and Retail Trade, Others are covered as segments by End User Industry. Domestic, International are covered as segments by Destination. Full-Truck-Load (FTL), Less than-Truck-Load (LTL) are covered as segments by Truckload Specification. Containerized, Non-Containerized are covered as segments by Containerization. Long Haul, Short Haul are covered as segments by Distance. Fluid Goods, Solid Goods are covered as segments by Goods Configuration. Non-Temperature Controlled, Temperature Controlled are covered as segments by Temperature Control. Australia, China, India, Indonesia, Japan, Malaysia, Thailand, Vietnam are covered as segments by Country.End User Industry
| Agriculture, Fishing, and Forestry |
| Construction |
| Manufacturing |
| Oil and Gas, Mining and Quarrying |
| Wholesale and Retail Trade |
| Others |
Destination
| Domestic |
| International |
Truckload Specification
| Full-Truck-Load (FTL) |
| Less than-Truck-Load (LTL) |
Containerization
| Containerized |
| Non-Containerized |
Distance
| Long Haul |
| Short Haul |
Goods Configuration
| Fluid Goods |
| Solid Goods |
Temperature Control
| Non-Temperature Controlled |
| Temperature Controlled |
Country
| Australia |
| China |
| India |
| Indonesia |
| Japan |
| Malaysia |
| Thailand |
| Vietnam |
| Rest of Asia-Pacific |
| End User Industry | Agriculture, Fishing, and Forestry |
| Construction | |
| Manufacturing | |
| Oil and Gas, Mining and Quarrying | |
| Wholesale and Retail Trade | |
| Others | |
| Destination | Domestic |
| International | |
| Truckload Specification | Full-Truck-Load (FTL) |
| Less than-Truck-Load (LTL) | |
| Containerization | Containerized |
| Non-Containerized | |
| Distance | Long Haul |
| Short Haul | |
| Goods Configuration | Fluid Goods |
| Solid Goods | |
| Temperature Control | Non-Temperature Controlled |
| Temperature Controlled | |
| Country | Australia |
| China | |
| India | |
| Indonesia | |
| Japan | |
| Malaysia | |
| Thailand | |
| Vietnam | |
| Rest of Asia-Pacific |


Market Definition
- Agriculture, Fishing, and Forestry (AFF) - This end user industry segment captures the external (outsourced) logistics expenditure incurred by the AFF industry players on road freight transport service. The end user players considered are the establishments primarily engaged in growing crops, raising animals, harvesting timber, harvesting fish & other animals from their natural habitats and providing related support activities. Herein, across the value chain, Logistics Service Providers (LSPs) play a crucial role in acquisition, storage, handling, transportation, and distribution activities for the optimal & continuous flow of inputs (seeds, pesticides, fertilizers, equipment, and water) from manufacturers or suppliers to the producers and smooth flow of output (produce, agro-goods) to distributors/ consumers. This includes both termperature controlled and non-temperature controlled logistics, as and when required according to the shelf life of goods being transported or stored.
- Construction - This end user industry segment captures the external (outsourced) logistics expenditure incurred by the construction industry players, on road freight transport service. The end user players considered are the establishments primarily engaged in constructing, repairing and renovating residential & commercial buildings, infrastructure, engineering works, subdividing and developing land. Logistics Service Providers (LSPs) play a crucial role in increasing profitability of construction projects by maintaing the inventory of raw materials & equipment, time-critical supplies and by providing other value added services for effective project management.
- Containerized Road Freight Transport - The segment captures the external (outsourced) logistics expenditure incurred by the road freight transport service end users on Full-Truck-Load (FTL) services. FTL road freight transport is characterized as a full single load not combined with other shipments. It comprises of shipments (i) devoted to the goods of a single shipper (ii) taken directly from a point of origin to one or more destination points (iii) comprising of bulk mail truck transportation (iv) comprising of both Container (Full Container Load, FCL)/Non-Container trucking services (v)comprsing of goods requiring temperature controlled or non-temperature controlled transportation services (vi) comprising of bulk liquid tankering (vii) invoving trucking of waste (viii) hazardous material trucking. Related value added services (VAS) of sorting, consolidation, deconslidation are included in the other services segment of freight and logistics market.
- Export Trends and Import Trends - Overall logistics performance of an economy is positively and significantly (statistically) correlated to its trade performance (exports and imports). Hence, in this industry trend, total value of trade, major commodities/ commodity groups and the major trade partners, for the studied geography (country or region as per the scope of report) have been analysed alongside the impact of major trade/logistics infrastructure investments & regulatory environment.
- Fluid Goods - The segment captures the external (outsourced) logistics expenditure incurred by the road freight transport service end users for the transport of bulk liquids, that are often used in extraction, manufacturing, food processing, agriculture industries among others. It includes transportation of liquids like (i) Chemicals/ hazardous goods (for instance acids) (ii) Water (potable as well as waste) (iii) Oil and gas (upstream as well as downstream like gasoline, fuel, crude oil, or propane), (iv) Food grade bulk liquids (like milk, or juice), (v) Rubber, (vi) Agrichemical products, among others. These goods are generally transported through tanker trucking.
- Fuel Price - Fuel price spikes can cause delays and diruption for logistics service providers (LSPs), while drops in the same can result in higher short-term profitability and increased market rivalry to offer consumers with the best deals. Hence, the fuel price variations have been studied over the review period and presented along with the causes as well as market impacts.
- Full-Truck-Load (FTL) Road Freight Transport - The segment captures the external (outsourced) logistics expenditure incurred by the road freight transport service end users on Full-Truck-Load (FTL) services. FTL road freight transport is characterized as a full single load not combined with other shipments. It comprises of shipments (i) devoted to the goods of a single shipper (ii) taken directly from a point of origin to one or more destination points (iii) comprising of bulk mail truck transportation (iv) comprising of both Container (Full Container Load, FCL)/Non-Container trucking services (v)comprsing of goods requiring temperature controlled or non-temperature controlled transportation services (vi) comprising of bulk liquid tankering (vii) invoving trucking of waste (viii) hazardous material trucking. Related value added services (VAS) of sorting, consolidation, deconslidation are included in the other services segment of freight and logistics market.
- GDP Distribution by Economic Activity - Nominal Gross Domestic Product and distribution of the same, across major economic sectors in the geography studied (country or region as per scope of the report) have been studied and presented in this industry trend. As GDP is positively related to the profitability and growth of logistics industry, this data has been used in adjunction to the input-output tables/ supply-use tables for analyzing the potential major contributing sectors towards the logistics demand.
- GDP Growth by Economic Activity - Growth of Nominal Gross Domestic Product across major economic sectors, for the geography studied (country or region as per scope of the report) have been presented in this industry trend. This data has been utilized for assessing the growth of logistics demand from all the market end users (economic sectors considered here).
- Inflation - Variations in both Wholesale Price Inflation (YoY change in producer price index) and Consumer Price Inflation have been presented in this industry trend. This data has been used to assess the inflationary environment as it plays a vital role in smooth functioning of the supply chain, directly impacting the logistics operational cost components e.g., pricing of tyres, driver wages & benefits, energy/fuel prices, maintenace costs, toll charges, warehousing rents, custom brokerage, forwarding rates, courier rates etc. hence impacting the overall freight and logistics market.
- Key Industry Trends - The report section named "Key Industry Trends" include all the key variables/parameters studied to better analyze the market size estimates and forecasts. All the trends have been presented in the form of data points (time series or latest available data points) along with analysis of the paramter in the form of concise market relevant commentary, for the geography studied (country or region as per the scope of report).
- Key Strategic Moves - The action taken by a company to differentiate from its competitor or used as a general strategy is referred to as a key strategic move (KSM). This includes (1) Agreements (2) Expansions (3) Financial Restructuring (4) Mergers and Acquisitions (5) Partnerships, and (6) Product Innovations. Key players (Logistics Service Providers, LSPs) in the market have been shortlisted, their KSM have been studied and presented in this section.
- Less than-Truck-Load (LTL) Road Freight Transport - The segment captures the external (outsourced) logistics expenditure incurred by the road freight transport service end users on Less than-Truck-Load (LTL) services. LTL road freight transport is characterized as multiple shipments combined onto a single truck for multiple deliveries within a network. It comprises of establishments (i) primarily engaged in general and specialized freight trucking of less than complete truck-loads, (ii) characterized by the use of terminals to consolidate shipments, generally from several shippers, into a single truck for haulage between a load assembly terminal and a disassembly terminal, where the load is sorted and shipments are re-routed for delivery (iv) Less than-Container-Load (LCL) shipping/ Groupage Shipping in case of trucking services. The activities in scope include (i) local pick-up, (ii) line-haul, and (iii) local delivery. Related value added services (VAS) of sorting, consolidation, deconslidation are included in the other services segment of freight and logistics market.
- Logistics Performance - Logistics Performance and Logistics Costs are the backbone of trade, and influences trade costs, making countries compete globally. Logistics performance is influenced by market wide adopted supply chain management strategies, government services, investments & policies, fuel/ energy costs, inflationary environment etc. Hence, in this industry trend, the logistics performance of the geography studied (country/ region as per the scope of report) has been analysed and presented over the review period.
- Major Truck Suppliers - Market share of truck brands is influenced by factors like geographical preferences, portfolio of truck types, truck prices, local production, truck repair & maintenance service peneteration, customer support, technological innovations (like electric vehicles, digitalization, autonomous trucks), fuel efficiency, financing options, annual maintenance costs, availability of substitutes, marketing startegies etc. Hence, the distribution (share % for base year of the study) of truck sales volume for leading truck brands and commentary on current market scenario & market anticipation over the forecast period have been presented in this industry trend.
- Manufacturing - This end user industry segment captures the external (outsourced) logistics expenditure incurred by the Manufacturing industry players, on road freight transport service. The end user players considered are the establishments primarily engaged in the chemical, mechanical or physical transformation of materials or substances into new products. Logistics Service Providers (LSPs) play a crucial role in maintaining a smooth flow of raw materials across the supply chain, enabling timely delivery of finished goods to distributors or end customers and storing & supplying the raw materials to clients for just-in-time manufacturing.
- Modal Share - Freight Modal Share is influenced by factors like modal productivity, government regulations, containerization, distance of shipment, temperature control requirements, type of goods, international trade, terrain, speed of delivery, shipment weight, bulk shipments, etc. Also, modal share by tonnage (tons) and modal share by freight turnover (ton-km) differ as per average distance of shipments, weight of major commodity groups transported in the economy and number of trips. This industry trend represents the distribution of freight transported by mode of transport (tons as well as ton-km), for the study base year.
- Oil and Gas, Mining and Quarrying - This end user industry segment captures the external (outsourced) logistics expenditure incurred by the extraction industry players, on road freight transport service. The end user players considered are the establishments that extract naturally occurring mineral solids, such as coal and ores; liquid minerals, such as crude petroleum; and gases, such as natural gas. Logistics Service Providers (LSPs) covers entire phases from upstream to downstream and plays a crucial role in the transportation of machinery, drilling equipments, extracted minerals, crude oil & natural gas and refined/ processed products from one place to another.
- Other End Users - Other end user segment captures the external (outsourced) logistics expenditure incurred by the financial services (BFSI), real estate, educational services, healthcare, and professional services (administrative, waste management, legal, architectural, engineering, design, consulting, scientific R&D), on road freight transport service. Logistics Service Providers (LSPs) plays a crucial role in the reliable movement of supplies and documents to/from these industries such as transporting any equipment or resources required, shipping confidential documents and files, movement of medical goods & supplies (surgical supplies and instruments, including gloves, masks, syringes, equipment) to name a few.
- Producer Price Inflation - It indicates inflation from viewpoint of the producers viz. the average selling price received for their output over a period of time. Annual change (YoY) of producer price index is reported as wholesale price inflation in the "Inflation" industry trend. As WPI captures dynamic price movements in most comprehensive way, it is widely used by governments, banks, industry, business circles and is deemed important in formulation of trade, fiscal and other economic policies. The data has been used in adjunction to consumer price inflation for better understanding the inflationary environment.
- Road Freight Pricing Trends - Freight pricing by mode of transport (USD/tonkm), over the review period, has been presented in this industry trend. The data has been used in assessing the inflationary environment, impact on trade, freight turnover (tonkm), road freight transport market demand and hence the road freight transport market size.
- Road Freight Tonnage Trends - Freight tonnage (weight of goods in tons) handled by mode of transport, over the review period, has been presented in this industry trend. The data has been used as one of the parameters apart from average distance per shipment (km), freight volume (tonkm), and freight pricing (USD/tonkm) to assess the freight transport market size.
- Road Freight Transport - Hiring a road freight transport logistics service provider (LSP) or haulier (outsourced logistics), for the transport of commodities constitutes road freight transport market. The scope of study includes (i) road transport of goods reported by hauliers registered in the reporting countries (ii) transport of raw materials or manufactured goods (solids as well as fluids) (iii) transport using commerical motor vehicles (rigid trucks or tractor-trailers, (iv) Full-Truck-Load (FTL) or Less than-Truck-Load (LTL) transport (v) containerized or non-containerized transport (vi) temperature controlled or non-temperature controlled trasnport, (vii) short haul or long haul (Over-the-road, OTR) transport, (viii) used office or household goods transport (movers and packers), (ix) other specialized cargo transport (dangerous goods, oversized cargo) and (x) outsourced first mile/ middle mile/last mile delivery shipments undertaken by road freight transport players. The scope does not include (i) transport undertaken by hauliers registered in other countries (ii) last mile meal delivery market (iii) grocery delivery market (iv) transportation via road network undertaken/ reported by Courier, Express, and Parcel (CEP) players.
- Road Length - As infrastructure plays a vital role in an economy's logistics performance, variables like length of roads, distribution of road length by surface category (paved v/s unpaved), distribution of road length by road classification (expressways v/s highways v/s other roads), have been analysed and presented in this industry trend.
- Segmental Revenue - Segmental Revenue has been triangulated or computed and presented for all the major players in the market. It refers to the road freight transport market specific revenue earned by the company, over the base year of study, in the geography studied (country or region as per the scope of report). It is computed through the study and analysis of major parameters like financials, service portfolio, employee strength, fleet size, investments, number of countries present in, major economies of concern, etc. that have been reported by the company in its annual reports, webpage. For companies having scarce financial disclosures, paid databases like D&B Hoovers, Dow Jones Factiva have been resorted to and verified through industry/expert interactions.
- Short Haul Road Freight Transport - The segment captures the external (outsourced) logistics expenditure incurred by the road freight transport service end users on local trucking (less than 100 miles). It includes the road transport of goods (i) within a single administrative area and its hinterland, (ii) by smaller trucks and pickup trucks (iii) via containerized as well as dry bulk services (iv) intermodal from ports, container terminals or airports, and (v) outsourced first mile/ last mile delivery shipments undertaken by road freight transport players.
- Transport and Storage Sector GDP - Value and growth of Transport and Storage Sector GDP has a direct relation to the freight and logistics market size, and hence road freight transport market size. Therefore, this variable has been studied and presented over the review period, in value terms (USD) and as share % of total GDP, in this industry trend. The data has been supported by concise and relevant commentary around the investments, developments, and current market scenario.
- Trends in E-Commerce Industry - Enhanced internet connectivity and boom in smartphone penetration, coupled with increasing disposable incomes, has led to a phenomenal growth in the e-commerce market globally. Online shoppers require fast and efficient delivery of their orders leading to an increase in the demand for logistics services especially e-commerce fulfilment services. Hence, the Gross Merchandise Value (GMV), historial and projected growth, breakup of major commodity groups in e-commerce industry for the studied geography (country or region as per scope of the report) have been analysed and presented in this industry trend.
- Trends in Manufacturing Industry - Manufacturing industry involves the transformation of raw materials into finished products, while logistics industry ensures the efficient flow of raw materials to the factory, and the transport of manufactured products to the distributors & consumers. Demand-Supply of both industries are highly cross-linked and critical for a seamless supply chain. Hence, the Gross Value Added (GVA), breakup of GVA into major manufacturing sectors, and growth of manufacturing industry over the review period have been analysed and presented, in this industry trend.
- Trucking Fleet Size By Type - Market share of truck types is influenced by factors like geographical preferences, major end user industries, truck prices, local production, truck repair & maintenance service peneteration, customer support, technological disruptions (like electric vehicles, digitalization, autonomous trucks) etc. Hence, the distribution (share % for base year of study) of truck parc volume by type of truck, market disruptors, truck manufacturing investments, truck specifications, truck use & import regulations, and market anticipation over the forecast period have been presented in this industry trend.
- Trucking Operational Costs - The prime reasons for measuring/ benchmarking logistics performance of any trucking company are to reduce operational costs and increase profitability. On the other hand, measuring operational costs helps to identify whether and where to make operational changes to control expenses and identify areas for improved performance. Hence, in this industry trend, trucking operational costs and the variables involved viz. driver wages & benefits, fuel prices, repairs & maintenance costs, tyre costs etc. have been studied over the base year of study, and presented for the geography studied (country or region as per the scope of report).
- Wholesale and Retail Trade - This end user industry segment captures the external (outsourced) logistics expenditure incurred by the wholesalers and retailers, on road freight transport service. The end user players considered are the establishments primarily engaged in wholesaling or retailing merchandise, generally without transformation, and rendering services incidental to the sale of merchandise. Logistics Service Providers (LSPs) plays a crucial role in the reliable movement of supplies to and finished products from production houses to the distributors and finally to the end customer covering activites like material sourcing, transportation, order fulfillment, warehousing & storage, demand forecasting, inventory management etc.
| Keyword | Definition |
|---|---|
| Cabotage | Road transport by a motor vehicle registered in a country performed on the national territory of another country. |
| Cross Docking | Cross docking is a logistics procedure where products from a supplier or manufacturing plant are distributed directly to a customer or retail chain with marginal to no handling or storage time. Cross docking takes place in a distribution docking terminal; usually consisting of trucks and dock doors on two (inbound and outbound) sides with minimal storage space. The name ‘cross docking’ explains the process of receiving products through an inbound dock and then transferring them across the dock to the outbound transportation dock. |
| Cross Trade | International road transport between two different countries performed by a road motor vehicle registered in a third country. A third country is a country other than the country of loading/embarkation and than the country of unloading/disembarkation. |
| Dangerous Goods | The classes of dangerous goods carried by Road are those defined by the fifteenth revised edition of the UN Recommendations on the Transport of Dangerous Goods, United Nations, Geneva 2007. They include Class 1: Explosives; Class 2: Gases; Class 3: Flammable Liquids; Class 4: Flammable solids- substances liable to spontaneous combustion; substances which, on contact with water, emit flammable gases; Class 5: Oxidizing substances and organic peroxides; Class 6: Toxic and infectious substances; Class 7: Radioactive material and Class 8: Corrosive substances, Class 9: Miscellaneous dangerous substances and articles. |
| Direct Shipment | Direct shipment is a method of delivering goods from the supplier or the product owner to the customer directly. In most cases, the customer orders the goods from the product owner. This delivery scheme reduces transportation and storage costs, but requires additional planning and administration. |
| Drayage | A drayage is a form of trucking service that connects the different modes of shipping (intermodal), such as ocean freight or air freight. It’s a short-haul trip that transports goods from one place to another, usually before or after its long-haul shipping process. Drayage trucks move cargo to and from various destinations, such as container ships, storage lots, order fulfillment warehouses, and rail yards. Typically, drayage only transports goods in short distances and operates only in one metropolitan area. It also requires only one trucker in a single shift. But despite this, but it plays an important role in long-haul shipping because it gets the goods to the cargo and vice versa. It makes intermodal transport much more efficient and enables the seamless transfer of goods to the end customer. |
| Dry van | A dry van is a type of semi-trailer that's fully enclosed to protect shipments from outside elements. Designed to carry palletized, boxed or loose freight, dry vans aren't temperature-controlled (unlike refrigerated “reefer” units) and can't carry oversized shipments (unlike flatbed trailers). |
| Final Demand | Final demand includes all types of commodities (goods as well as services) consumed as final use and might include personal consumption, or consumption by government, by businesses as capital investment, and as exports. includes all types of commodities (goods as well as services) consumed as final use and might include personal consumption, or consumption by government, by businesses as capital investment, and as exports. |
| Flatbed Truck | A flatbed truck is a type of truck with rigid design. It has a back body that is flatly shaped for easy loading and unloading of goods. The flatbed truck is mostly used to transport heavy, oversized, wide and indelicate goods such as machinery, building supplies or equipment. Due to the truck open body, the goods transported with it must not be vulnerable to rain. By functionality, the flatbed truck is comparable to a flatbed trailer. |
| Inbound Logistics | Inbound logistics is the way materials and other goods are brought into a company. This process includes the steps to order, receive, store, transport and manage incoming supplies. Inbound logistics focuses on the supply part of the supply-demand equation. |
| Intermediate Demand | Intermediate demand includes goods, services, and maintenance and repair construction sold to businesses, excluding capital investment. |
| International Loaded | Place of loading of goods in reporting country (i.e., country in which the vehicle performing the transport is registered) and place of unloading in a different country. |
| International Unloaded | Place of unloading of goods in reporting country (i.e., country in which the vehicle performing the transport is registered) and place of loading in a different country. |
| OOG cargo | Out of Gauge (OOG) cargo is any cargo that can not be loaded into six-sided shipping containers simply because it is too large. The term is a very loose classification of all cargo with dimensions beyond the maximum 40HC container dimensions. That is a length beyond 12.05 meters – a width beyond 2.33 meters – or a height beyond 2.59 meters. |
| Pallets | Raised platform, intended to facilitate the lifting and stacking of goods. |
| Part load | A part load describes goods which only fills a truck partially. In essence, the quantity of the shipment is bigger than the Less Than Truckload (LTL) shipment. Also, the shipment cannot fully occupy a truck i.e. its capacity is much lower than a Full Truckload (FTL) shipment. |
| Paved Road | Road surfaced with crushed stone (macadam) with hydrocarbon binder or bituminized agents, with concrete or with cobblestone. |
| Reverse Logistics | Reverse logistics comprises of the sector of supply chains that process anything returning inwards through the supply chain or traveling ‘backward’ through the supply chain. |
| Road Freight Transport Service | Hiring a trucking agency for transport of commodities (raw materials or manufactured goods including both solids and liquids) form the origin to a destination within the country (domestic) or cross-border (international) constitutes road freight transport market. The service might be Full-Truck-Load or Less than-Truck-Load, containerized or non-containerized, temperature controlled or non temperature controlled, short haul or long haul. |
| Tautliner vehicle | Tautliner and curtainsider are used as generic names for curtain sided trucks/trailers. The curtains are permanently fixed to a runner at the top and detachable rails/poles at front and rear, allowing the curtains to be drawn open and forklifts used all along the sides for easy and efficient loading and unloading. When closed for travel, vertical load restraint straps are attached to a rope rail beneath the truck bed, connecting the truck bed and curtain along both sides. Winches at either end of the curtain tension it, hence the 'Tautliner' name. This stops the curtain from flapping or drumming in the wind and can also help retain light loads from slipping sideways. |
| Transport for hire or reward | The carriage for remuneration of goods. |
| Unpaved Road | Road with a stabilized base not surfaced with crushed stone, hydrocarbon binder or bituminized agents, concrete or cobblestone. |


Research Methodology
Mordor Intelligence follows a four-step methodology in all our reports.
- Step-1: Identify Key Variables: In order to build a robust forecasting methodology, the variables and factors identified in Step-1 are tested against available historical market numbers. Through an iterative process, the variables required for market forecast are set and the model is built on the basis of these variables.
- Step-2: Build a Market Model: Market-size estimations for the forecast years are in nominal terms. Inflation is considered to be a part of the pricing, and the average selling price (ASP) is varying throughout the forecast period for each country
- Step-3: Validate and Finalize: In this important step, all market numbers, variables and analyst calls are validated through an extensive network of primary research experts from the market studied. The respondents are selected across levels and functions to generate a holistic picture of the market studied.
- Step-4: Research Outputs: Syndicated Reports, Custom Consulting Assignments, Databases & Subscription Platforms


