AI Toolkit Market Size and Share
Market Overview
| Study Period | 2019 - 2030 |
|---|---|
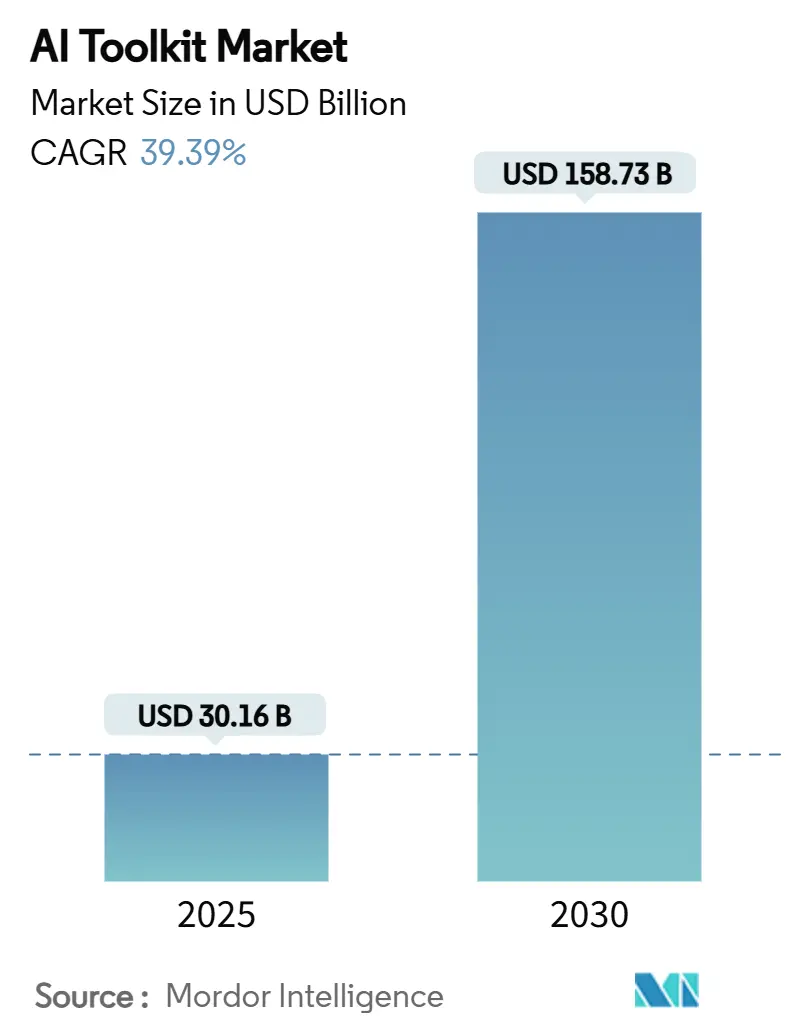
| Market Size (2025) | USD 30.16 Billion |
| Market Size (2030) | USD 158.73 Billion |
| Growth Rate (2025 - 2030) | 39.39% CAGR |
| Fastest Growing Market | Asia Pacific |
| Largest Market | North America |
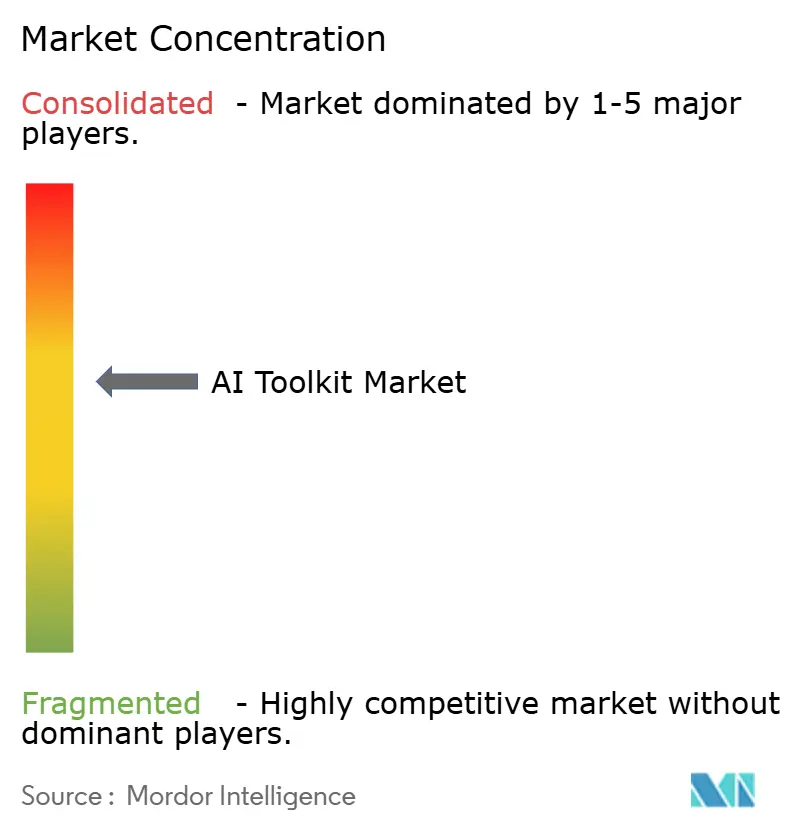
| Market Concentration | Medium |
Major Players *Disclaimer: Major Players sorted in no particular order Image © Mordor Intelligence. Reuse requires attribution under CC BY 4.0. | |
AI Toolkit Market Analysis by Mordor Intelligence
The AI toolkit market size stands at USD 30.16 billion in 2025 and is projected to reach USD 158.73 billion by 2030, expanding at a 39.39% CAGR during 2025-2030. Growth momentum stems from enterprise-scale generative-AI deployments, hyperscaler competition that lowers infrastructure costs, and an open-source ecosystem that has reduced time-to-value for new entrants. Cloud-based toolkits dominate today because they bundle managed compute, turnkey model hubs, and pay-as-you-grow pricing. Even so, the rapid shift toward hybrid architectures signals rising sensitivity to sovereignty laws and egress fees. Subscription packaging, no-code interfaces, and pre-trained models are accelerating adoption among SMEs, while domain-specific foundation models fuel vertical innovation in healthcare, manufacturing, and finance. Heightened demand is reinforced by record venture funding, large data-center build-outs such as the USD 500 billion Stargate Project, and fast-evolving EU-US policy frameworks that mandate governance tooling for explainability.
Key Report Takeaways
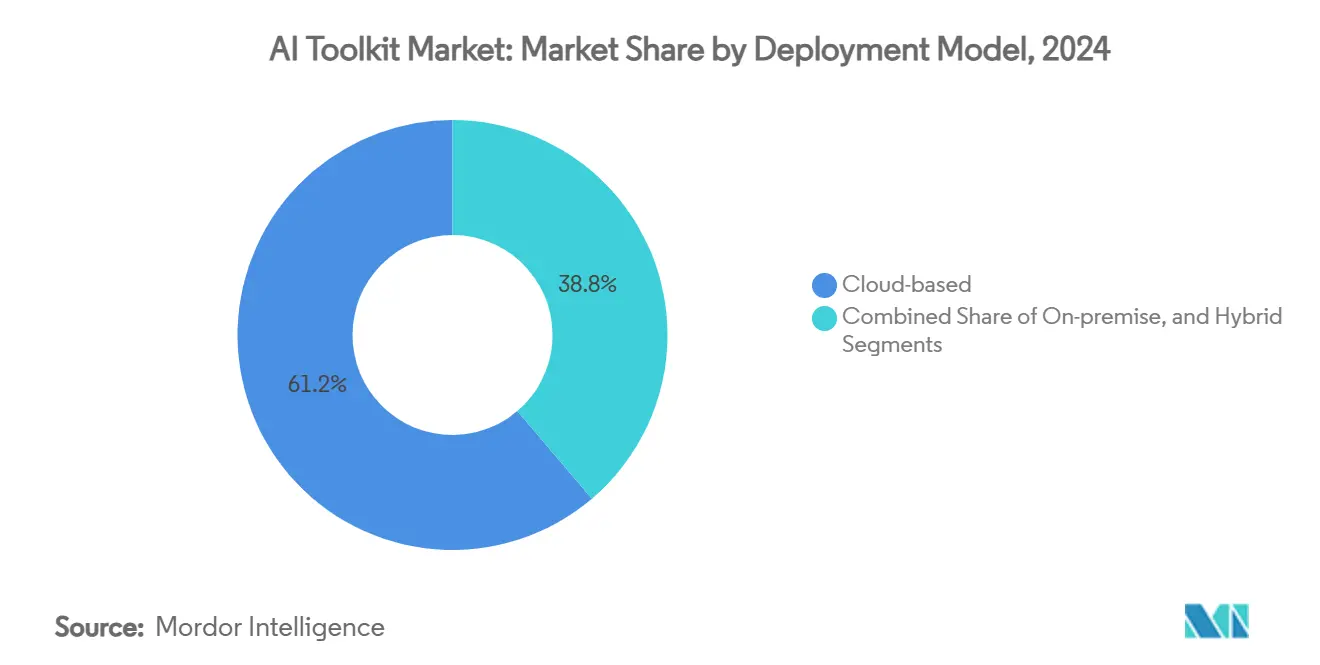
- By deployment model, cloud solutions led with 61.23% of AI toolkit market share in 2024; hybrid alternatives are forecast to advance at a 40.31% CAGR through 2030.
- By component, software libraries and frameworks held 37.15% of the AI toolkit market size in 2024, whereas pre-trained models are set to grow at 41.62% CAGR through 2030.
- By end-user industry, BFSI accounted for 23.41% revenue share in 2024, while healthcare and life sciences is projected to expand at a 42.07% CAGR to 2030.
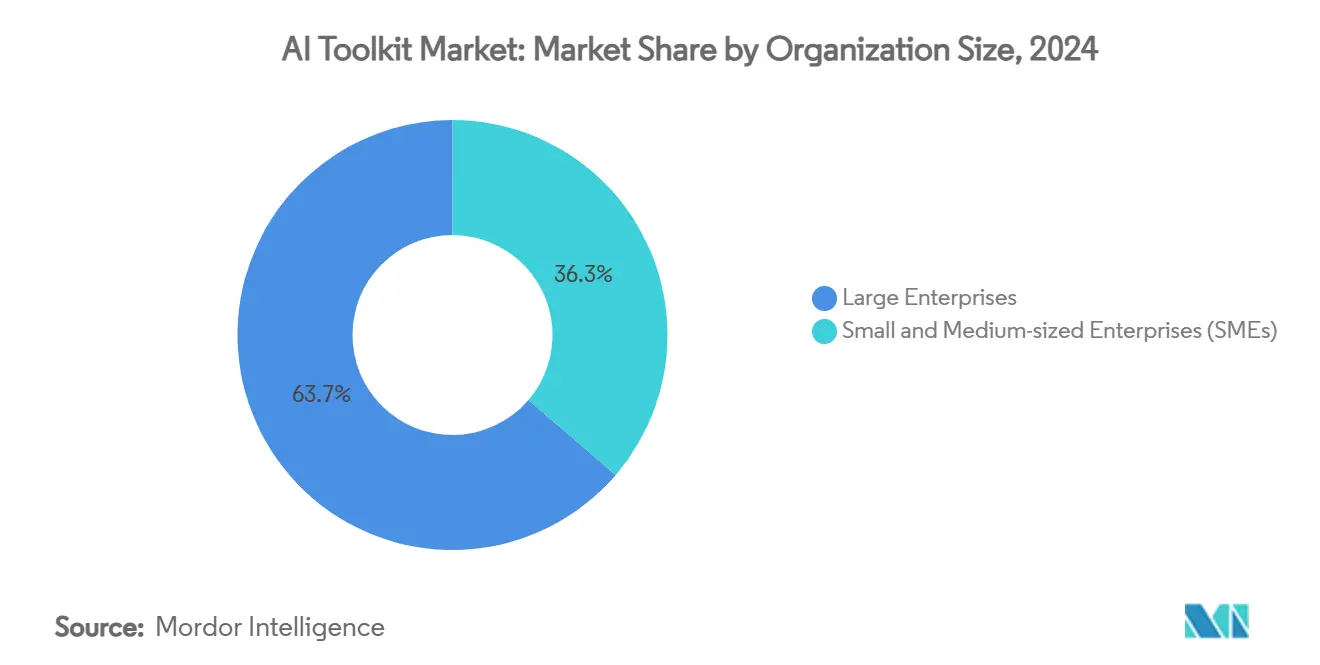
- By organization size, large enterprises captured 63.72% of the AI toolkit market size in 2024; SMEs are expected to register the fastest 43.62% CAGR through 2030.
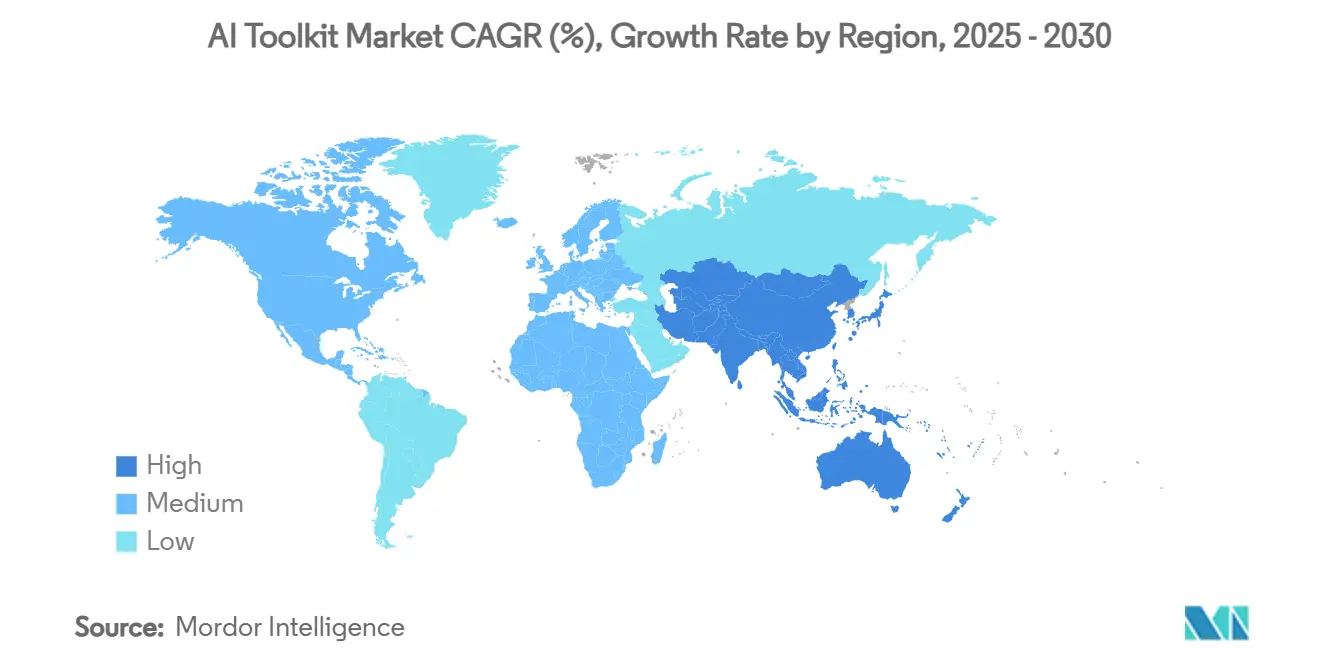
- By geography, North America commanded 32.43% share in 2024, whereas Asia-Pacific is forecast to post a 43.08% CAGR between 2025-2030.
Note: Market size and forecast figures in this report are generated using Mordor Intelligence’s proprietary estimation framework, updated with the latest available data and insights as of January 2026.
Global AI Toolkit Market Trends and Insights
Drivers Impact Analysis*
| Driver | (~) % Impact on CAGR Forecast | Geographic Relevance | Impact Timeline |
|---|---|---|---|
| Rapid enterprise adoption of generative-AI workloads | +8.2% | Global, with North America and Asia-Pacific leading | Short term (≤ 2 years) |
| Hyperscaler cloud AI services lowering entry barriers | +6.5% | Global, concentrated in regions with major cloud providers | Medium term (2-4 years) |
| Open-source frameworks accelerating developer ecosystems | +5.8% | Global, with stronger impact in emerging markets | Medium term (2-4 years) |
| Model-governance and explainability mandates (GxP/AI Act) | +4.3% | Europe, North America, with spillover to APAC | Long term (≥ 4 years) |
| Rise of domain-specific foundation models | +7.1% | Global, sector-specific concentrations | Medium term (2-4 years) |
| Subscription-based "toolkit-as-a-service" packaging | +5.9% | Global, particularly beneficial for SMEs | Short term (≤ 2 years) |
| Source: Mordor Intelligence | |||
Rapid Enterprise Adoption of Generative-AI Workloads
Generative-AI has crossed the experimentation threshold; 78% of enterprises now deploy live systems and 87% budget for further roll-outs within two years.[1]TCS, “Generative AI in Finance: Opening up a Sea of Possibilities,” tcs.com Manufacturers illustrate the pivot, with 93% initiating new AI projects in 2024 to pursue gains in throughput and quality rather than narrow cost cuts.[2]Siemens, “Manufacturing Intelligence: Exploring the Spectrum of AI Use Cases,” assets.new.siemens.com Telcos anticipate USD 11 billion annual revenue from agentic AI that optimizes network topology and predictive maintenance by 2025. Early adopters report 20–30% productivity lifts inside twelve months, creating a flywheel as internal success stories spur fresh investment.
Hyperscaler Cloud AI Services Lowering Entry Barriers
Google Cloud’s Hugging Face integration gives developers frictionless access to 350,000 models plus low-cost TPUs, stripping away historic budget and skills hurdles.[3]The Verge, “Google’s Hugging Face Deal Puts ‘Supercomputer’ Power Behind Open-Source AI,” theverge.com Standardized multi-agent toolkits such as Azure AI Foundry Agent Service reduce orchestration complexity, while open protocols like Model Context Protocol streamline cross-vendor integrations. Competitive pressure is driving unprecedented cloud diversification; ChatGPT now runs on Google, Oracle, CoreWeave, and Microsoft Azure footprints across five countries, enhancing latency resilience and pricing leverage.
Open-Source Frameworks Accelerating Developer Ecosystems
Meta’s open Llama 3.1 (405 billion parameters) delivers comparable accuracy at a fraction of proprietary model cost, and DeepSeek’s 685-billion-parameter release operates at 214-times lower cost than GPT-4, tilting ROI math decisively. Over a dozen agentic frameworks—AG2, CrewAI, LangChain, and others—have matured into enterprise-grade options, fostering rapid experimentation. Transparency initiatives such as the Model Openness Framework combat “open-washing,” adding trust signals essential for regulated sectors.
Rise of Domain-Specific Foundation Models
In pharmaceuticals, AI-assisted discovery is cutting clinical-trial timelines by 30% and slashing development spend 25% as AstraZeneca scales generative models across R&D. Financial institutions like JP Morgan adopt contextual marketing models projected to unlock USD 170 billion in new profit pools by 2028. Manufacturing gains range from 5%–20% labor-productivity uplifts, while cobots attain higher precision via AI-enhanced vision and planning.
Restraints Impact Analysis*
| Restraint | (~) % Impact on CAGR Forecast | Geographic Relevance | Impact Timeline |
|---|---|---|---|
| Shortage of advanced AI engineering talent | -4.7% | Global, acute in North America and Europe | Medium term (2-4 years) |
| Data-sovereignty and privacy regulations | -3.2% | Europe leading, expanding to APAC and Americas | Long term (≥ 4 years) |
| GPU supply-chain bottlenecks | -5.8% | Global, concentrated impact on high-performance computing | Short term (≤ 2 years) |
| Fragmentation across competing AI compute stacks | -2.9% | Global, particularly affecting multi-vendor environments | Medium term (2-4 years) |
| Source: Mordor Intelligence | |||
Shortage of Advanced AI Engineering Talent
Demand for multimodal model-ops, prompt-engineering, and ethical-AI specialists outstrips supply, with 60% of APAC firms planning to train local talent yet facing hiring gaps. Tech majors are reallocating headcount: Salesforce cut 1,000 roles while hiring AI-skilled sellers and freezing net new software-developer positions for 2025. SMEs struggle to match compensation, pushing them toward managed services and automated pipelines.
GPU Supply-Chain Bottlenecks
TSMC notes CoWoS packaging can’t meet demand until late-2025 despite USD 30–32 billion capex, prolonging hardware queues. NVIDIA channels 60% output to large cloud contracts, leaving smaller buyers facing 30-50% mark-ups and months-long lead times. High-bandwidth-memory shortages compound the crunch as SK Hynix capacity remains fully booked.
*Our forecasts treat driver/restraint impacts as directional, not additive. The impact forecasts reflect baseline growth, mix effects, and variable interactions.
Segment Analysis
By Deployment Model: Hybrid Architectures Drive Enterprise Adoption
Hybrid configurations are the fastest-rising approach, expanding at 40.31% CAGR as firms balance sovereignty with elastic compute. In 2024, cloud maintained 61.23% AI toolkit market share, but on-premises interest is resurging among US enterprises building internal GPU clusters to trim egress fees. Hybrid models allow sensitive datasets to stay on-site while burst workloads tap the cloud, improving compliance posture and disaster recovery.
Edge advances intensify the pivot. Forecasts place edge AI revenue at USD 49.6 billion by 2030, aligning with compact models able to run on existing hardware. SMEs value governance portals that rationalize multi-cloud estates, while large firms negotiate reserved-instance discounts that flatten long-term TCO. Overall, the AI toolkit market size tied to hybrid solutions is poised to triple by 2030, reshaping procurement priorities toward connectivity, observability, and model-lifecycle tooling.


By Component: Pre-trained Models Accelerate Market Transformation
Software libraries delivered 37.15% of the AI toolkit market size in 2024, but pre-trained models grow fastest at 41.62% CAGR as firms skip costly green-field training. Hugging Face’s 350,000-strong repository, valued at USD 4.5 billion, anchors this shift by offering immediately deployable checkpoints. SDK uptake is buoyed by mobile demand; AI-ready apps could reach USD 777.4 billion revenue by 2032.
Competitive dynamics revolve around platform breadth and cost-per-token. Anthropic’s Claude 3.5 Sonnet downloads leaped from 38,000 to 100,000 within three months, winning developer mindshare on speed and pricing. Consolidation continues—Snowflake paid USD 1 billion for Reka AI to fold multimodal assets into its data-cloud, echoing Databricks’ USD 1.3 billion MosaicML purchase. As frameworks mature, the AI toolkit market benefits from reduced integration friction and faster proof-of-concept cycles.
By Organization Size: SMEs Drive Adoption Acceleration
Large enterprises commanded 63.72% revenue in 2024 by integrating cross-departmental pipelines and building AI centers of excellence. However, SMEs exhibit the most aggressive 43.62% CAGR, aided by no-code studios and subscription bundles that drive 28% cost savings and 41% agility gains. Hybrid cloud appeals to this cohort for disaster recovery and compliance without CapEx burden.
Democratization continues as Microsoft Copilot Studio enables non-developers to craft agents, and managed services cushion talent shortages. Meanwhile, enterprises pursue deeper integrations and internal upskilling, reporting 20-30% productivity lifts in the first year. The organizational mix ensures a broad customer base, sustaining the AI toolkit market through varied budget cycles.
By End-User Industry: Healthcare Leads Growth Transformation
BFSI preserved top billing at 23.41% revenue in 2024 through fraud-detection suites that cut false positives 75% and chatbots that compress call-center wait-times. Yet healthcare and life sciences will grow 42.07% CAGR to 2030, propelled by AI-assisted molecule screening that trims USD 200 million from average drug-development budgets.
Manufacturing registers 93% project-initiation rates as predictive maintenance curbs unplanned downtime and cobots elevate throughput. Retail adoption is equally brisk: 78% of brands deploy personalization engines lifting conversion 15% and average order value 11%. Telecommunications foresee USD 11 billion incremental revenue via network-optimization agents by 2025. Collectively these verticals diversify the AI toolkit industry revenue base and de-risk vendor pipelines.
Geography Analysis
North America retained 32.43% AI toolkit market share in 2024 on the back of enterprise capex, the NIST AI Risk-Management Framework, and a dense startup ecosystem. Federal procurement aligns with commercial advances; the Pentagon’s USD 800 million multi-vendor LLM contracts deepen demand for secure, agentic workflows.
Asia-Pacific is the fastest riser, posting a 43.08% CAGR through 2030 as China’s USD 2.1 billion generative-AI outlay and Japan’s JPY 10 trillion (USD 69.5 billion) semiconductor plan feed domestic capacity. Regional players emphasize localized language models; 60% of APAC firms intend to deploy home-grown LLMs by 2025 to reflect cultural nuance. Government blueprints such as Singapore’s AI-Verify and India’s Digital India accelerator supply regulatory clarity and cloud credits that nurture domestic ecosystems.
Europe advances under the EU AI Act, generating pull-through for governance modules and explainability dashboards that vendors bundle into compliance toolkits. South America and the Middle East & Africa remain nascent but strategically important: the UAE targets AI-enabled GDP uplift by 2031, while Saudi Arabia’s Vision 2030 invests heavily in smart-city pilots. This multi-regional canvas ensures diversified revenue for the AI toolkit market and cushions suppliers against single-region slowdowns.

Competitive Landscape
Fragmentation persists, yet consolidation accelerates as hyperscalers, chipmakers, and model studios converge. No vendor exceeds a 15% revenue share, creating a moderately concentrated field anchored by alliances rather than outright dominance. Horizontal platform strategies from Google, Microsoft, and Meta integrate model hubs, automated ML, and governance, whereas specialists like Hugging Face and Databricks monetize depth in specific lifecycle stages.
Hardware partnerships are pivotal. Oracle’s USD 40 billion order for NVIDIA GPUs underwrites the Stargate data-center build, aligning compute supply with OpenAI’s ballooning inference demand. Google adopts NVIDIA Blackwell GPUs to court physics-based simulators and multimodal pipelines. Such moves blur lines between IaaS, PaaS, and model IP.
Patent activity intensifies. Tencent’s contrastive-learning patent advances LLM generalization, while Meta’s edge-optimized architecture promises on-device inference that widens TAM. Disruptors pursue open-source cost leadership: DeepSeek prices output at 214-times lower than GPT-4, pressuring incumbents’ margins and triggering tiered pricing models. Overall, ecosystem playbooks revolve around compute scale, model breadth, and compliance wrappers, shaping strategic roadmaps for the AI toolkit market.
AI Toolkit Industry Leaders
Google LLC
Microsoft Corporation
Meta Platforms Inc.
IBM Corporation
Amazon Web Services Inc.
- *Disclaimer: Major Players sorted in no particular order

Recent Industry Developments
- July 2025: Oracle committed USD 40 billion to NVIDIA chips for OpenAI’s Stargate data center, ensuring GPU supply while strengthening Oracle Cloud positioning in the AI toolkit market. The strategy secures long-term capacity and ties GPU availability to Oracle’s Fusion Applications roadmap.
- July 2025: The U.S. Department of Defense awarded four firms up to USD 200 million each to advance agentic AI workflows, signaling a commercial-first procurement stance that will standardize military requirements on enterprise toolkits.
- July 2025: OpenAI expanded hosting to Google Cloud, CoreWeave, and Oracle, diversifying beyond Microsoft Azure to mitigate single-vendor risk and enhance regional latency options.
- July 2025: Meta launched Superintelligence Labs to accelerate next-gen AI while open-sourcing Ernie 4.5, aiming to crowdsource innovation and lock in ecosystem loyalty.


Global AI Toolkit Market Report Scope
| Cloud-based |
| On-premise |
| Hybrid |
| Software Libraries and Frameworks |
| Pre-trained Models |
| SDKs and APIs |
| End-to-End Platforms |
| Large Enterprises |
| Small and Medium-sized Enterprises (SMEs) |
| Banking, Financial Services and Insurance (BFSI) |
| Healthcare and Life Sciences |
| Retail and E-commerce |
| Manufacturing |
| IT and Telecom |
| Government and Defense |
| Other End-user Industries |
| North America | United States | |
| Canada | ||
| Mexico | ||
| Europe | Germany | |
| United Kingdom | ||
| France | ||
| Italy | ||
| Spain | ||
| Russia | ||
| Rest of Europe | ||
| Asia-Pacific | China | |
| Japan | ||
| South Korea | ||
| India | ||
| Australia | ||
| Rest of Asia-Pacific | ||
| South America | Brazil | |
| Argentina | ||
| Chile | ||
| Colombia | ||
| Rest of South America | ||
| Middle East and Africa | Middle East | Saudi Arabia |
| United Arab Emirates | ||
| Turkey | ||
| Rest of Middle East | ||
| Africa | South Africa | |
| Nigeria | ||
| Kenya | ||
| Rest of Africa | ||
| By Deployment Model | Cloud-based | ||
| On-premise | |||
| Hybrid | |||
| By Component | Software Libraries and Frameworks | ||
| Pre-trained Models | |||
| SDKs and APIs | |||
| End-to-End Platforms | |||
| By Organization Size | Large Enterprises | ||
| Small and Medium-sized Enterprises (SMEs) | |||
| By End-User Industry | Banking, Financial Services and Insurance (BFSI) | ||
| Healthcare and Life Sciences | |||
| Retail and E-commerce | |||
| Manufacturing | |||
| IT and Telecom | |||
| Government and Defense | |||
| Other End-user Industries | |||
| By Geography | North America | United States | |
| Canada | |||
| Mexico | |||
| Europe | Germany | ||
| United Kingdom | |||
| France | |||
| Italy | |||
| Spain | |||
| Russia | |||
| Rest of Europe | |||
| Asia-Pacific | China | ||
| Japan | |||
| South Korea | |||
| India | |||
| Australia | |||
| Rest of Asia-Pacific | |||
| South America | Brazil | ||
| Argentina | |||
| Chile | |||
| Colombia | |||
| Rest of South America | |||
| Middle East and Africa | Middle East | Saudi Arabia | |
| United Arab Emirates | |||
| Turkey | |||
| Rest of Middle East | |||
| Africa | South Africa | ||
| Nigeria | |||
| Kenya | |||
| Rest of Africa | |||


Key Questions Answered in the Report
What is the projected value of the AI toolkit market by 2030?
The AI toolkit market is forecast to reach USD 158.73 billion by 2030, reflecting a 39.39% CAGR from 2025.
Which deployment approach is growing fastest?
Hybrid architectures post a 40.31% CAGR as firms combine on-premises control with cloud scalability.
Which vertical will add the most incremental demand through 2030?
Healthcare and life sciences lead with a 42.07% CAGR, fueled by AI-assisted drug discovery and diagnostics gains.
Why are SMEs adopting toolkits rapidly?
Subscription-based packages and no-code studios cut implementation costs 28% and boost agility 41%, driving 43.62% CAGR among SMEs.
How will GPU shortages influence toolkit roll-outs?
Persistent GPU bottlenecks, expected to ease only after 2025, may delay large-scale training projects and keep inference costs elevated.
Which region will contribute the highest growth rate?
Asia-Pacific records the fastest 43.08% CAGR, powered by substantial public and private AI investment in China, Japan, and India.
Page last updated on:


