Animal Model Market Size and Share
Market Overview
| Study Period | 2020 - 2031 |
|---|---|
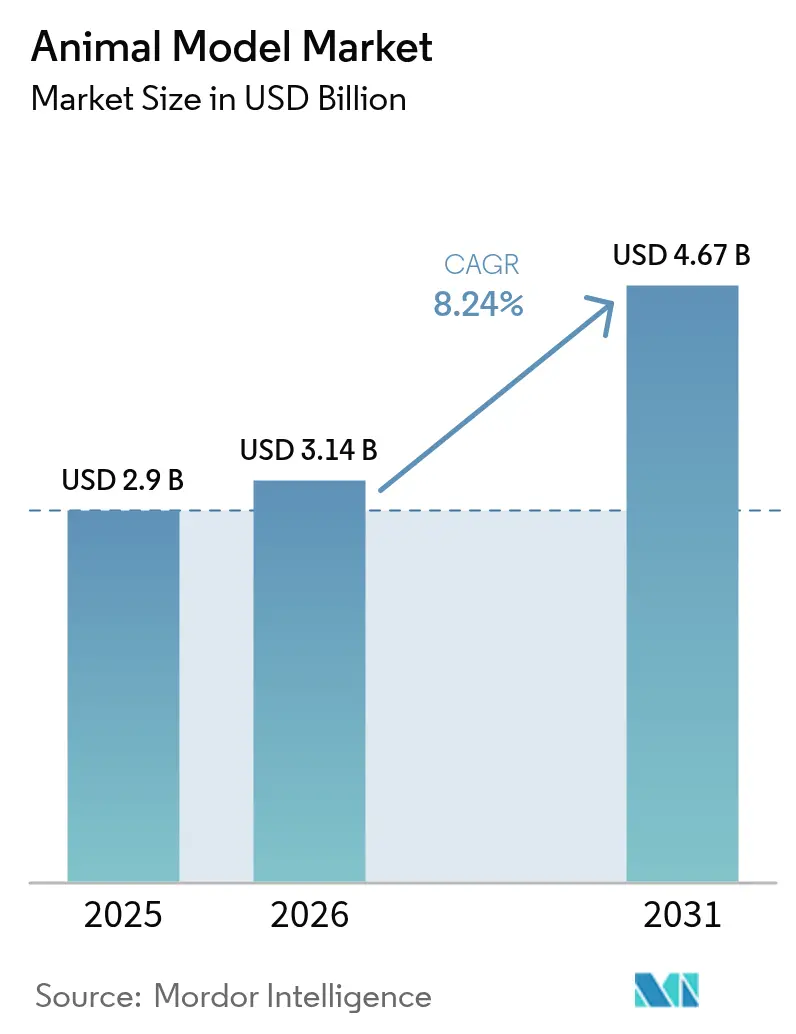
| Market Size (2026) | USD 3.14 Billion |
| Market Size (2031) | USD 4.67 Billion |
| Growth Rate (2026 - 2031) | 8.24% CAGR |
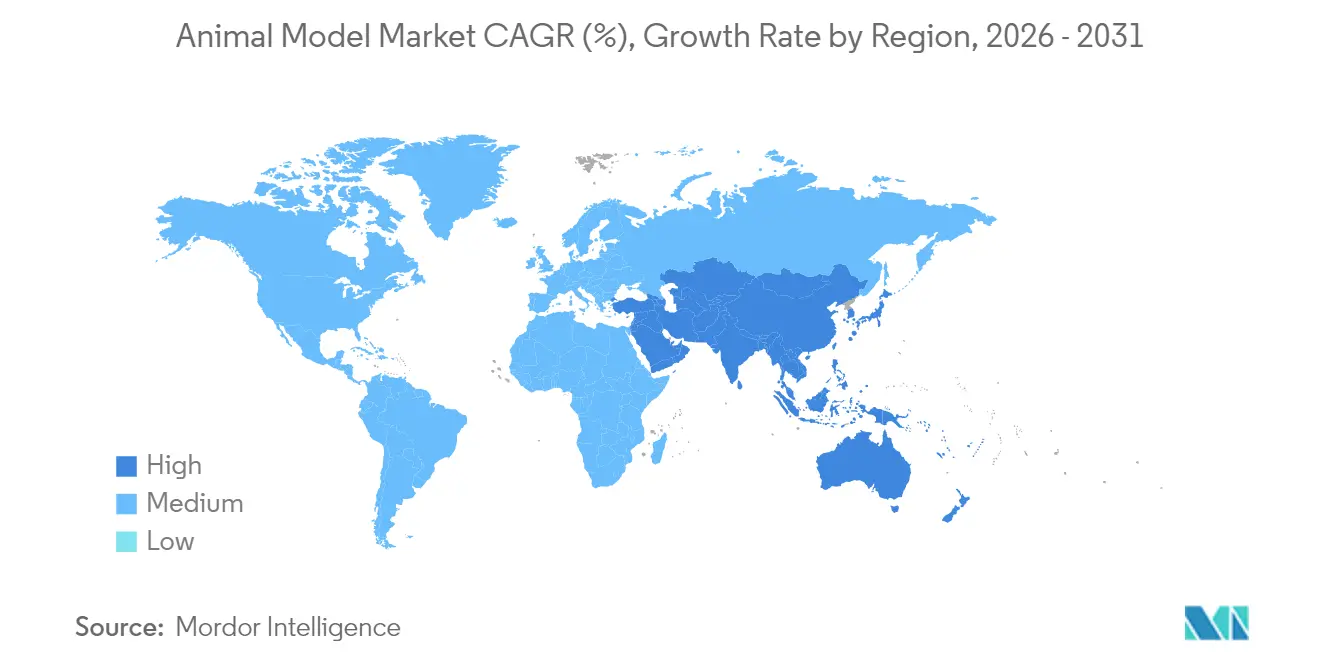
| Fastest Growing Market | Asia Pacific |
| Largest Market | North America |
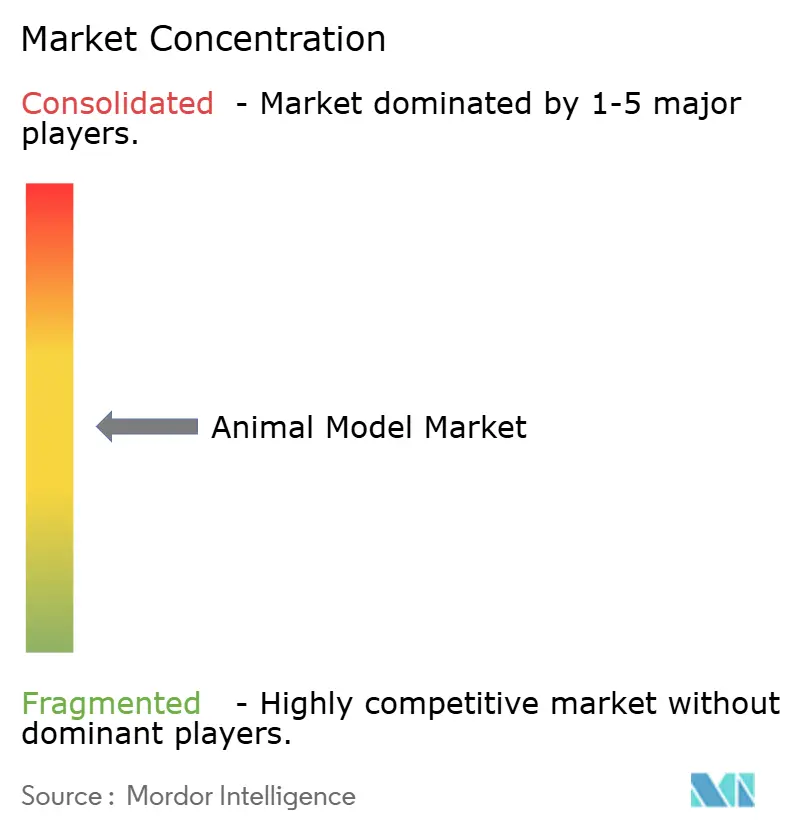
| Market Concentration | Medium |
Major Players *Disclaimer: Major Players sorted in no particular order Image © Mordor Intelligence. Reuse requires attribution under CC BY 4.0. | |
Animal Model Market Analysis by Mordor Intelligence
The animal model market size was valued at USD 2.90 billion in 2025 and estimated to grow from USD 3.14 billion in 2026 to reach USD 4.67 billion by 2031, at a CAGR of 8.24% during the forecast period (2026-2031). Expansion is fueled by post-pandemic research budgets, rapid diffusion of CRISPR-based engineering, and the enduring need for in-vivo evidence across oncology, infectious diseases, and precision medicine. At the same time, regulatory modernization is starting to loosen the historic reliance on animals, illustrated by the United States Food and Drug Administration’s April 2025 plan to withdraw monoclonal antibody animal-testing mandates within five years. Large providers are responding by piloting virtual control groups and AI-facilitated phenotyping while still scaling colonies for studies that lack validated substitutes. The animal model market now sits at a strategic crossroads where scientific necessity, ethical scrutiny, and digital innovation overlap, creating a landscape that rewards suppliers able to combine traditional breeding depth with next-generation analytics
Key Report Takeaways
- By animal type, mice captured 54.62% of the animal model market share in 2025, while fish models are projected to expand at a 10.04% CAGR through 2031.
- By service, breeding operations held 44.21% of the animal model market size in 2025; genetic testing services are on track for an 10.72% CAGR to 2031.
- By technology, CRISPR/Cas9 led with 38.05% revenue and is forecast to grow at 12.32% CAGR, reflecting its dominance in precision engineering workflows.
- By application, oncology accounted for 40.77% of 2025 revenue, whereas infectious-disease studies are poised for the fastest growth at 11.18% CAGR through 2031.
- By end-user, Pharmaceutical & Biopharmaceutical Companies held 47.68% of the animal model market size in 2025; Contract Research Organizations are on track for a 9.18% CAGR to 2031.
- By geography, North America commanded 46.25% of the animal model market share in 2025; Asia-Pacific is set to grow the fastest at 8.98% CAGR on the back of China’s capacity build-out.
Note: Market size and forecast figures in this report are generated using Mordor Intelligence’s proprietary estimation framework, updated with the latest available data and insights as of 2026.
Global Animal Model Market Trends and Insights
Drivers Impact Analysis*
| Driver | (~) % Impact on CAGR Forecast | Geographic Relevance | Impact Timeline |
|---|---|---|---|
| Increased adoption of CRISPR & other gene-editing tools | +2.1% | Global; strongest in North America & Asia-Pacific | Long term (≥ 4 years) |
| Rising use of animal models in virology & emerging infectious diseases | +1.8% | Global; concentrated in North America & Europe | Medium term (2-4 years) |
| Growing demand for humanized models in precision medicine | +1.7% | Global; strongest in developed markets | Long term (≥ 4 years) |
| Government R&D funding surge post-pandemic | +1.5% | North America & Europe | Short term (≤ 2 years) |
| AI-enabled high-throughput phenotyping accelerating adoption | +0.9% | North America & Europe | Medium term (2-4 years) |
| Micro-gravity disease models from space-biology programs | +0.4% | North America, Europe, select Asia-Pacific | Long term (≥ 4 years) |
| Source: Mordor Intelligence | |||
Increased Adoption of CRISPR & Other Gene-Editing Tools
CRISPR/Cas9 has cut classical model-generation timelines in half and trimmed per-project costs[1]Indiana University School of Medicine, “Genome Editing Core Pricing,” Indiana University School of Medicine, medicine.iu.edu by roughly 40%, making sophisticated knock-ins feasible for smaller research institutes that previously depended on commercial suppliers. Beyond simple indels, base- and prime-editing variants now deliver single-nucleotide precision without double-strand breaks, broadening use in metabolic, immunologic, and neurodegenerative investigations. Vendors such as Cyagen and GenOway have capitalized on the trend with standardized CRISPR pipelines and robust quality controls, allowing pharmaceutical clients to commission multi-gene constructs in parallel rather than sequentially. Demand for compound mutants is therefore scaling faster than classical colony-expansion capacity, prompting breeders to automate embryo handling, genotyping, and cryopreservation. As these efficiencies aggregate, the animal model market gains a durable growth engine that offsets margin pressure from regulatory alternatives.
Rising Use of Animal Models in Virology & Emerging Infectious Diseases
Since 2024, infectious-disease budgets have migrated from crisis response to long-term infrastructure, spurring record orders for humanized mouse strains and non-human primates engineered for viral receptors. The hACE2 mouse, pivotal during COVID-19, has become a template for rapid pathogen-specific line creation through CRISPR knock-ins. National Institutes of Health consortia now fund dedicated high-containment breeding sites, shifting procurement from ad-hoc imports to secure domestic pipelines. The strategic goal is to maintain on-shore capacity to model respiratory viruses, filoviruses, and flaviviruses without relying on global transportation corridors that can be disrupted by bio-security rules. For suppliers, this sustained virology focus means recurring demand for custom immunocompetent and immunodeficient backgrounds, supporting steady CAGR contribution across the forecast window.
Growing Demand for Humanized Models in Precision Medicine
Immunotherapy, gene therapy, and rare-disease pipelines increasingly require murine hosts that recapitulate human immune function, metabolic polymorphisms, or patient-specific mutations. The Jackson Laboratory’s expansion of its humanized mouse portfolio in China illustrates how regional hubs seek local access to sophisticated lines that meet global Good Laboratory Practice requirements. Pharmaceutical sponsors now specify panel studies[2]Claire Kowalick, “Scientists Create First Mouse Model With Complete Functional Human Immune System,” UT Health San Antonio, news.uthscsa.edu across multiple ethnic haplotypes or HLA backgrounds to anticipate variable therapeutic responses. Immune-humanized mice also underpin checkpoint-inhibitor and CAR-T validation, a segment whose compound annual growth already outpaces oncology spend overall. Although per-mouse pricing is several times higher than classical inbred lines, the translational value justifies the premium, anchoring a profitable niche for breeders that can guarantee genetic authenticity and pathogen-free status.
Government R&D Funding Surge Post-Pandemic
Emergency appropriations in 2024 evolved into line-item increases in 2025 budgets at agencies such as the NIH and USDA. These grants back both state-of-the-art vivaria upgrades and the parallel validation of non-animal methods, reflecting regulators’ dual objectives of incremental welfare improvement and long-term replacement. Facilities that secure federal contracts must now demonstrate redundant power systems, rigorous barrier protocols, and digital colony-management records, elevating baseline capital requirements but also locking in multi-year revenue streams once certified. Internationally, the Asian Federation of Laboratory Animal Science Associations has aligned import/export health standards to smooth cross-border study initiation, further widening the addressable customer pool for compliant suppliers.
Restraints Impact Analysis*
| Restraint | (~) % Impact on CAGR Forecast | Geographic Relevance | Impact Timeline |
|---|---|---|---|
| Rapid advances in organ-on-chip & 3D-organoid alternatives | -1.8% | North America & Europe | Long term (≥ 4 years) |
| Stringent regulations on ethical use of animals | -1.2% | Global; strictest in Europe | Medium term (2-4 years) |
| Shareholder ESG pressure to reduce animal testing | -0.9% | Developed markets | Medium term (2-4 years) |
| High cost & long lead-times for complex transgenic lines | -0.7% | Global | Short term (≤ 2 years) |
| Source: Mordor Intelligence | |||
Stringent Regulations on Ethical Use of Animals
European Directive 2010/63/EU tightened the ethical bar by requiring systematic replacement reviews, enhanced enrichment, and public disclosure of annual animal-use statistics[3]European Commission, “Animals in Science,” European Commission, environment.ec.europa.eu, all of which raise compliance costs. Laboratories must secure approvals from Institutional Animal Care and Use Committees that track every procedural refinement, adding months to project lead-times in certain jurisdictions. Pharmaceutical sponsors, wary of reputational risk, often mirror EU rules globally, compelling North-American and Asian sites to upgrade housing, analgesia, and endpoint monitoring. Smaller academic centers struggle to finance these upgrades, pushing more demand toward large-scale commercial providers that already meet high-welfare thresholds.
Rapid Advances in Organ-on-Chip & 3D-Organoid Alternatives
Multi-organ microfluidic platforms have now cleared specific toxicology-screening hurdles with the FDA, enabling early safety calls without live mammals. CN Bio’s Series B fund-raise underlines investor belief that human-relevant liver-kidney constructs can de-risk attrition for metabolic liabilities before candidate nomination. Cost-benefit analyses show that integrating organ-on-chip at lead-optimization can shrink overall pre-clinical budgets by double-digit percentages. While such systems cannot yet replicate full immune interplay or chronic multi-organ pathologies, they siphon demand away from routine acute-tox screens, trimming absolute study volumes for the animal model industry long-term.
*Our forecasts treat driver/restraint impacts as directional, not additive. The impact forecasts reflect baseline growth, mix effects, and variable interactions.
Segment Analysis
By Animal Type: Mice Dominance Faces Aquatic Challenge
Mice retained a 54.62% hold of the animal model market share in 2025, reflecting decades of accumulated genomic resources, standardized husbandry protocols, and well-validated behavioral assays. This dominance anchors predictable baseline demand across oncology, neuroscience, and metabolic disease. Yet the segment’s growth rate is now trailing the broader animal model market, signaling maturity in traditional murine workflows.
By contrast, zebrafish and other aquatic species are set to log a 10.04% CAGR to 2031. High-content imaging of transparent larvae, automation-friendly plate formats, and lower compound requirements drive cost efficiencies that resonate with high-throughput screening teams at pharmaceutical firms. As a result, the animal model market size for aquatic species is projected to climb swiftly, supported by institutional investment in automated embryo sorters and micro-CT imaging. Although regulatory familiarity with teleost outcomes is still building, early adopters cite clear toxicity-ranking parallels with mammalian studies, bolstering acceptance.


By Service: Genetic Testing Transforms Traditional Breeding
Breeding services accounted for 44.21% of the animal model market size in 2025, underlining their status as the logistical backbone of the animal model market. Volume demand stems from the sheer number of colonies needed to support oncology xenografts, safety pharmacology, and neurobehavioral pipelines. Nevertheless, growth has shifted toward value-added offerings, with genetic authentication registering an 10.72% CAGR as sponsors adopt mandatory single-nucleotide polymorphism panels to verify strain integrity.
The animal model market size for genetic-testing workflows benefits from the broader rollout of next-generation sequencing benches within vivaria, enabling same-day confirmation of CRISPR edits or genetic drift. Cryopreservation, rederivation, and quarantine services complete a life-cycle loop that reduces vivarium footprint at client sites while guaranteeing health status. These integrated service bundles strengthen stickiness because once embryos or sperm are banked, switching providers becomes operationally risky and time-consuming.
By Technology: CRISPR Consolidates Gene-Editing Leadership
CRISPR/Cas9 captured 38.05% of the animal model market share in 2025 and is forecast to post a 12.32% CAGR, cementing its role as the principal engineering engine inside the animal model market. Turnaround times measured in weeks instead of months allow therapeutics teams to iterate quickly on proof-of-concept hypotheses, supporting concurrent exploration of multiple alleles.
Alternative technologies retain niche value: embryonic stem-cell injection remains the method of choice for elaborate conditional constructs; nuclear transfer underpins large-animal cloning; and random-insertion microinjection still supports transgenics demanding high-expression. Base- and prime-editing modalities—functional extensions of CRISPR—will likely enter routine service by 2027, further broadening accessible genotype space and keeping technology-intensive projects inside the commercial supplier channel rather than shifting to academic core labs.
By Application: Infectious Diseases Research Accelerates
Oncology held 40.77% of the animal model market size in 2025, anchored by the complexity of tumor microenvironment studies that still defy full in-vitro reproduction. Even so, infectious-disease work is advancing at 11.18% CAGR as national security rhetoric frames pandemic preparedness as critical infrastructure.
This shift propels the animal model market size for virology above historical norms, energized by NIH programs funding pathogen-specific model development and biosafety-level-3 expansion. Sponsors increasingly require flexible colony platforms capable of rapid receptor knock-in once a novel virus emerges. The dual need for speed and bio-containment places a premium on providers with on-site genetic-engineering teams and ring-fenced high-barrier rooms.

By End-User: CROs Gain Ground on Pharmaceutical Companies
Pharmaceutical and biopharmaceutical companies held 47.68% of the animal model market share in 2025, reflecting their in-house discovery pipelines and regulatory submission obligations. However, cost-conscious portfolio leaders are migrating routine in-vivo work to specialist contract research organizations, fueling a 9.18% CAGR for CRO demand through 2031.
CROs differentiate by stacking vertical capabilities—breeding, CRISPR engineering, AI phenotyping, and regulatory dossier preparation—into single statements of work. This one-stop model streamlines sponsor oversight and consolidates vendor budgeting, making it attractive for mid-size biotechnology firms that lack internal vivaria. The dynamic reallocates margin from vivarium overhead toward high-value service layers, reinforcing competitive intensity but also embedding CROs more deeply within long-term preclinical strategies.
Geography Analysis
North America retained 46.25% of 2025 revenue, underpinned by a dense cluster of pharmaceutical headquarters, venture-funded biotech start-ups, and academic medical centers. The region’s 7.77% CAGR to 2031 rests on technology refresh cycles—automated cage-change robotics, digital colony-management, and AI-driven behavior analytics—rather than volume expansion. The FDA’s 2025 signal to sunset monoclonal antibody animal requirements has triggered parallel investment in virtual control-group software, allowing suppliers to diversify while shielding core revenue.
Europe follows with an 8.01% CAGR even under stringent welfare directives. Commercial breeders command premium pricing by offering genetically authenticated, welfare-optimized lines that pass EU inspections without additional client audits. Simultaneously, Europe leads global organ-on-chip validation, granting its suppliers export opportunities for alternative testing platforms; that dual capability positions EU firms at the intersection of current and future regulatory paradigms.
Asia-Pacific stands out as the fastest-growing territory at 8.98% CAGR, driven by China’s rapid expansion of laboratory-animal science programs. China now produces more than 19 million research animals annually, supported by a workforce exceeding 100,000 specialists across roughly 2,000 institutes. Regional leaders such as Japan’s RIKEN BioResource Center supply over 13,000 defined mouse strains with rigorous health-screening, aligning output with global Good Laboratory Practice standards. These developments raise the animal model market size for the region dramatically and are complemented by emerging spending in the Middle East, Africa, and South America, each logging high-single-digit CAGRs as nascent biotech sectors take hold.

Competitive Landscape
The animal model market displays moderate concentration. Charles River Laboratories, The Jackson Laboratory, and Taconic Biosciences anchor global capacity with vertically integrated offerings that start at breeding and extend to custom CRISPR design, regulatory consulting, and AI-assisted phenotyping. Charles River’s USD 292.5 million acquisition of Vigene Biosciences in 2024 deepened its viral-vector portfolio while keeping a foothold in traditional murine production.
Competition increasingly revolves around technology turn-around time and data quality. Providers that automate embryo transfer, integrate next-generation sequencing for genotype verification, and deliver cloud-based behavior analytics can shorten drug-discovery cycles, a value proposition that commands premium pricing even as unit numbers face gradual attrition from alternative technologies. The Jackson Laboratory’s tie-up with AbTherx combines proprietary mouse genetics with antibody discovery platforms, demonstrating how cross-fertilization between genetic depth and therapeutic application widens economic moats.
Disruptive pressure comes from organ-on-chip players like CN Bio, whose USD 21 million Series B will finance multi-organ microphysiological systems targeting drug-induced liver injury screens. AI-native behavioral-analysis startups promise objective, scalable endpoints that regulators can audit remotely. Traditional suppliers hedge by investing in hybrid offerings—virtual control-group datasets drawn from historic animal-study repositories—thereby monetizing decades of accumulated phenotypic information while supporting reduction goals.
Animal Model Industry Leaders
Charles River Laboratories International Inc.
GenOway
Labcorp UK Ltd
Taconic Biosciences, Inc.
The Jackson Laboratory
- *Disclaimer: Major Players sorted in no particular order

Recent Industry Developments
- June 2025: CN Bio introduced cross-species drug-induced-liver-injury services built on animal microphysiological systems to improve in-vitro to in-vivo extrapolation.
- May 2025: Charles River Laboratories and The Jackson Laboratory signed a cooperation agreement to streamline global distribution of murine models.
- March 2025: University of Zurich scientists unveiled a ‘flycodes’ method enabling simultaneous profiling of 25 antibodies within a single mouse, potentially shrinking animal usage by up to 100-fold.
- March 2025: Yale researchers generated CRISPR-Cas12a mouse lines capable of multiplexed gene editing, enhancing immune-response research efficiency.


Research Methodology Framework and Report Scope
Market Definitions and Key Coverage
Our study defines the animal model market as the value of live, research-grade non-human species, principally mice, rats, zebrafish, rabbits, dogs, and non-human primates, supplied for in-vivo biomedical, toxicological, and translational research. Revenues cover sales of animals, related breeding and cryopreservation services, quarantine and rederivation, plus genetic engineering fees that create disease-specific or humanized strains.
Scope Exclusions: Alternative in-vitro systems (organoids, 3-D cultures, organ-on-chip) and animal models procured solely for veterinary or educational demonstration are not counted.
Segmentation Overview
- By Animal Type
- Mice
- Rats
- Fish
- Birds
- Cattle
- Other Animals
- By Service
- Breeding
- Cryopreservation
- Rederivation & Quarantine
- Genetic Testing
- Other Services
- By Technology
- CRISPR/Cas9
- Embryonic Stem Cell Injection
- Nuclear Transfer
- Microinjection
- Other Technologies
- By Application
- Oncology
- Cardiovascular & Metabolic Disorders
- Neurology & Psychiatry
- Immunology & Infectious Diseases
- Toxicology & Safety Assessment
- Others
- By End-User
- Pharmaceutical & Biopharmaceutical Companies
- Contract Research Organizations (CROs)
- Academic & Research Institutes
- Other End-Users
- By Geography
- North America
- United States
- Canada
- Mexico
- Europe
- Germany
- United Kingdom
- France
- Italy
- Spain
- Rest of Europe
- Asia-Pacific
- China
- India
- Japan
- Australia
- South Korea
- Rest of Asia-Pacific
- Middle East and Africa
- GCC
- South Africa
- Rest of Middle East and Africa
- South America
- Brazil
- Argentina
- Rest of South America
- North America
Detailed Research Methodology and Data Validation
Primary Research
We interviewed vivarium managers, CRO procurement heads, preclinical directors in pharma-biotech firms, and regional regulators across North America, Europe, and Asia-Pacific. Discussions clarified average selling prices, strain utilization shifts toward CRISPR lines, and expected outsourcing ratios, enabling vital cross-checks against desk estimates.
Desk Research
Analysts collected foundational statistics from tier-1 public sources such as the National Institutes of Health, US FDA's Animal Rule dashboards, European Commission DG SANTE reports, OECD Test Guideline adoption files, and import-export datasets of the UN Comtrade system. Company 10-Ks, IPO filings, association portals (FELASA, AALAS), and peer-reviewed papers supplied volume clues and typical colony sizes. Select figures were supplemented by subscriptions to D&B Hoovers and Questel for financial splits and recent patent activity. The sources cited above illustrate, not exhaust, the secondary corpus consulted.
Market-Sizing & Forecasting
A top-down reconstruct that begins with country-level research animal usage reports, live animal trade manifests, and funding outlays establishes the demand pool, which is then validated with bottom-up supplier roll-ups and sampled ASP x volume checks.
Annual research animal consumption by species, Transgenic strain penetration rates, Average ASP differentials for immunodeficient and humanized lines, CRO outsourcing share of preclinical spend, Government and philanthropic R&D funding trends
Multivariate regression with scenario analysis projects the 2025-2030 trajectory; missing bottom-up datapoints are bridged using three-year moving averages from contiguous geographies.
Data Validation & Update Cycle
Outputs pass variance and outlier checks, followed by senior analyst review. Models refresh once a year, with interim revisions when material regulatory or zoonotic events shift demand. A final pre-publication sweep ensures clients receive the latest view.
Why Mordor's Animal Model Baseline Commands Reliability
Estimates published across firms rarely align because providers diverge on species coverage, service inclusions, ASP assumptions, and refresh cadence.
By selecting a full spectrum of species and by isolating revenue solely linked to biomedical use, Mordor Intelligence minimizes scope creep and delivers a transparent, reproducible baseline.
Benchmark comparison
| Market Size | Anonymized source | Primary gap driver |
|---|---|---|
| USD 2.90 Bn (2025) | Mordor Intelligence | - |
| USD 2.54 Bn (2024) | Global Consultancy A | Rodent-only scope; single-source ASP |
| USD 2.25 Bn (2023) | Industry Association B | Omits breeding and genetics services; two-year update lag |
| USD 2.48 Bn (2023) | Trade Journal C | Secondary averages without primary validation |
The comparison underscores that, by marrying up-to-date multi-species coverage with continuous primary cross-checks, our baseline offers stakeholders a balanced, decision-ready reference.


Key Questions Answered in the Report
How are recent regulatory shifts influencing demand for traditional animal testing?
Regulators are granting greater flexibility to use virtual control groups and validated in-vitro platforms, which is prompting research organizations to reserve live-animal studies for complex disease models where no alternative yet exists.
What is driving the growing popularity of zebrafish in early-stage drug discovery?
Transparent embryos and plate-based husbandry enable automated imaging and high-content screening, allowing scientists to evaluate hundreds of compounds rapidly while observing whole-organism biology.
Why is CRISPR now considered a standard tool rather than an emerging technology in this field?
Precise gene-editing protocols, falling per-edit costs, and widely available core-lab expertise have made CRISPR the default method for creating knock-in or knock-out lines across multiple species.
In what ways are contract research organizations reshaping the competitive landscape?
CROs combine breeding, advanced genetic engineering, and digital phenotyping in one service package, allowing sponsors to outsource entire in-vivo workflows instead of maintaining internal vivaria.
How are ethical and environmental, social, and governance (ESG) considerations impacting supplier strategies?
Investors and corporate boards increasingly favor vendors that demonstrate reduction and refinement of animal use, so leading suppliers are investing in AI-enabled behavior monitoring, enriched housing, and hybrid models that integrate organ-on-chip data.
What role do humanized models play in precision-medicine pipelines?
By incorporating human immune cells, metabolic enzymes, or patient-specific mutations, humanized models help researchers predict therapeutic responses more accurately and de-risk clinical trial designs.
Page last updated on:


