
Spay And Neuter Market Size and Share
Market Overview
| Study Period | 2020 - 2031 |
|---|---|
| Market Size (2026) | USD 2.83 Billion |
| Market Size (2031) | USD 3.54 Billion |
| Growth Rate (2026 - 2031) | 4.63 % |
| Fastest Growing Market | Asia-Pacific |
| Largest Market | North America |
| Market Concentration | Low |
Major Players
*Disclaimer: Major Players sorted in no particular order Image © Mordor Intelligence. Reuse requires attribution under CC BY 4.0. |
|
Spay And Neuter Market Analysis by Mordor Intelligence
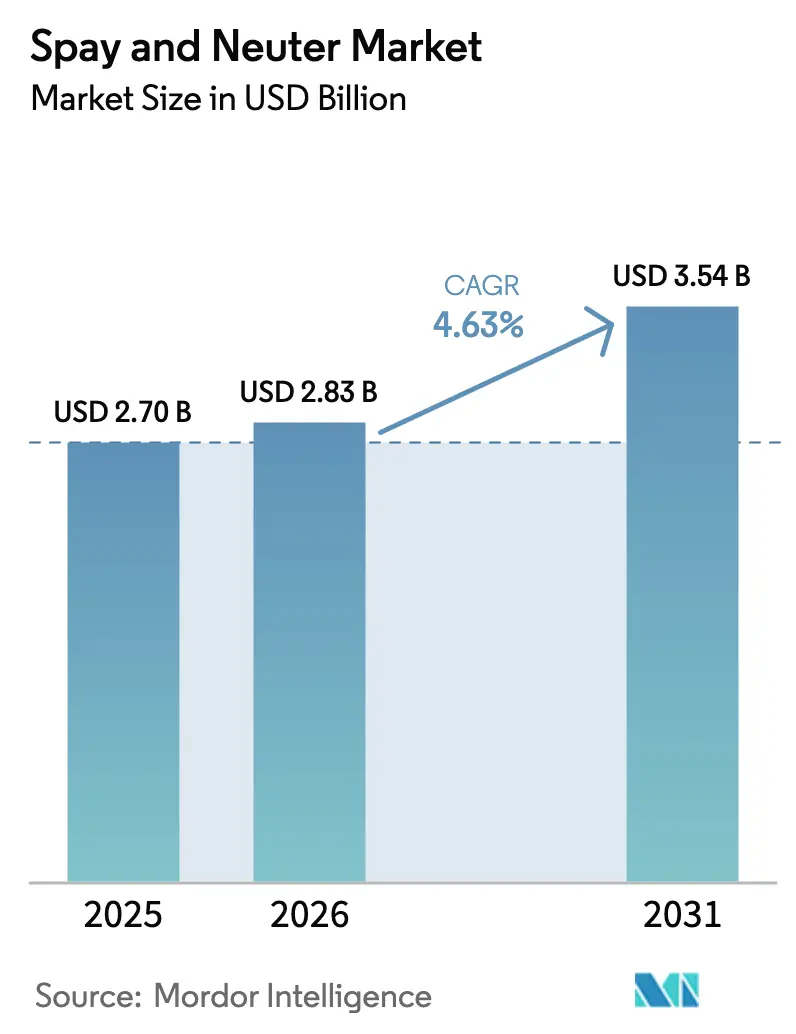
The spay and neuter market size in 2026 is estimated at USD 2.83 billion, growing from 2025 value of USD 2.70 billion with 2031 projections showing USD 3.54 billion, growing at 4.63% CAGR over 2026-2031. Robust demand for elective sterilization, the rise of premium preventive-care bundles, and early adoption of non-surgical products are set to keep the global spay and neuter market on a steady growth curve. Persistent pet-humanization trends have elevated sterilization from a population-control tactic to a core element of companion-animal wellness plans. Public and private subsidy programs, mandatory municipal ordinances, and large-scale NGO campaigns integrate affordable access with social responsibility, further sustaining procedure volumes. In parallel, corporate consolidation has increased pricing transparency and protocol standardization, while nascent non-surgical technologies promise to widen access in cost-sensitive regions.
Key Report Takeaways
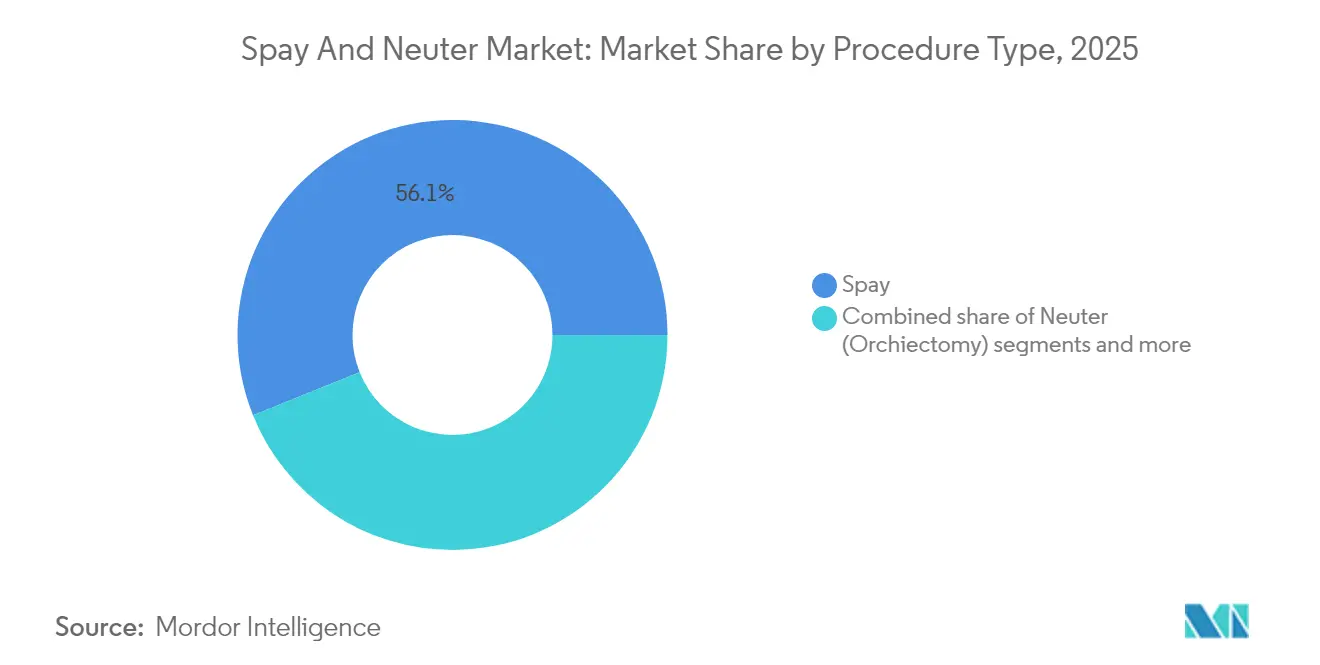
- By procedure type, spay operations commanded 56.08% of the spay and neuter market share in 2025; non-surgical sterilization is projected to expand at a 5.30% CAGR through 2031.
- By animal type, dogs led with a 64.62% revenue share of the spay and neuter market size in 2025, whereas cats are poised to record the fastest 6.05% CAGR to 2031.
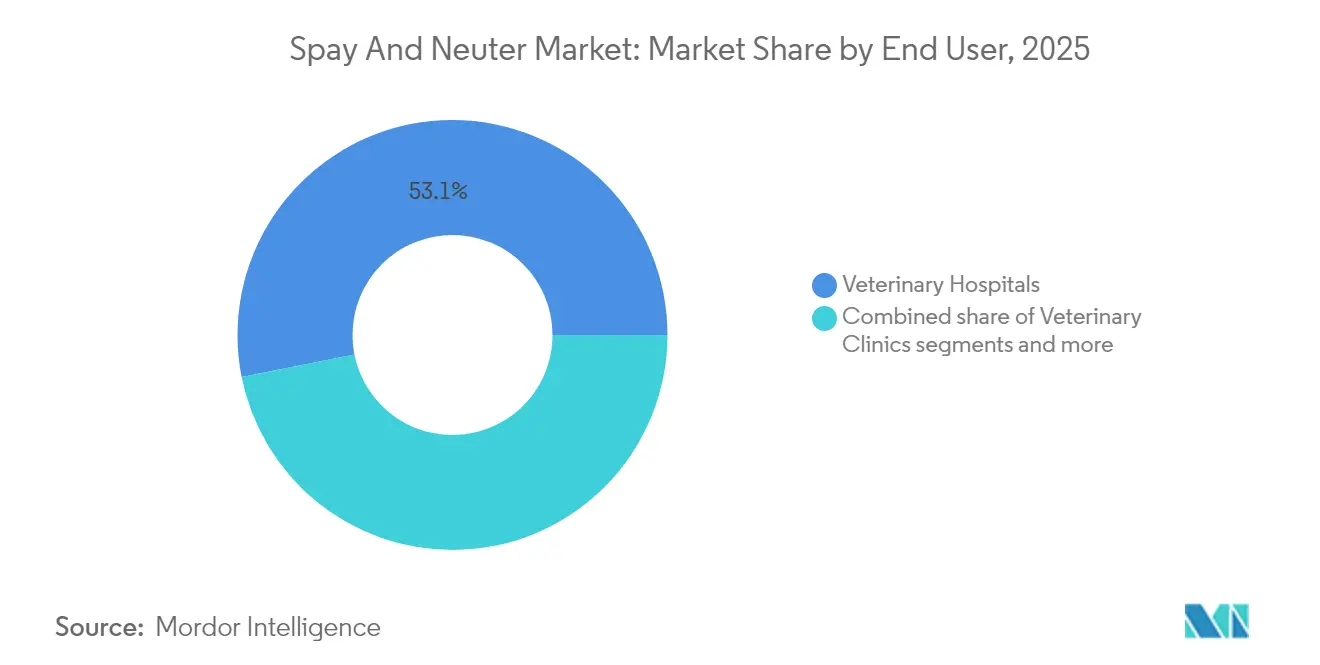
- By end user, veterinary hospitals held 53.12% share of the spay and neuter market size in 2025, while mobile/community programs are forecast to progress at 6.92% CAGR through 2031.
- By geography, North America dominated with a 41.74% spay and neuter market share in 2025; Asia-Pacific is expected to post the highest 7.86% CAGR to 2031.
Note: Market size and forecast figures in this report are generated using Mordor Intelligence’s proprietary estimation framework, updated with the latest available data and insights as of 2026.
Global Spay And Neuter Market Trends and Insights
Drivers Impact Analysis*
| Driver | (~) % Impact on CAGR Forecast | Geographic Relevance | Impact Timeline |
|---|---|---|---|
| Rising companion animal ownership & pet-humanization | +1.2% | Global; strongest in North America & Asia-Pacific | Medium term (2-4 years) |
| Government & NGO subsidized spay-neuter campaigns | +0.8% | North America core; expanding to Latin America | Short term (≤ 2 years) |
| Mandatory municipal sterilization ordinances | +0.6% | North America & Europe; emerging in APAC | Long term (≥ 4 years) |
| Rising veterinary healthcare expenditure | +1.0% | Global; led by developed markets | Medium term (2-4 years) |
| Breakthrough non-surgical sterilant pipelines | +0.4% | Global; regulatory approval dependent | Long term (≥ 4 years) |
| Corporate chain bundled low-cost surgery packages | +0.7% | North America & Europe; expanding globally | Short term (≤ 2 years) |
| Source: Mordor Intelligence | |||
Rising Companion Animal Ownership & Pet-Humanization
Youthful urban households are choosing pets over larger families, turning sterilization into a routine wellness milestone rather than a one-off public-health duty. China’s pet economy touched billions in 2024, with veterinary spending at 28%, while India’s dog population almost tripled over the last decade, pushing corporate entrants to scale multi-clinic networks. Higher disposable incomes drive owner willingness to select laparoscopic techniques, laser surgery, and longer-acting analgesics, raising average invoice values and lifting profitability across the spay and neuter market.
Government & NGO Subsidized Spay-Neuter Campaigns
Voucher programs, free-day clinics, and traveling surgical units have become critical volume drivers, particularly for low-income zip codes. Best Friends Animal Society's #SpayTogether initiative has deployed over USD 2 million in funding with the goal of supporting 50,000 spay/neuter surgeries across eight US states, while the organization directly performed 20,673 spay/neuter procedures in 2024[1]. These initiatives also generate predictable case loads that underpin capacity-expansion investments by private practices.
Mandatory Municipal Sterilization Ordinances
Thirty-two US states require shelter adoptions to be sterilized before release, while counties such as King County, Washington, impose differential licensing fees that double for intact animals. Such statutes embed a structural floor under annual procedure volumes. In Europe, similar mandates(applied in Germany, Spain, and parts of Italy) sustain clinic throughput and have encouraged mobile units to schedule recurring routes in suburban and rural districts.
Rising Veterinary Healthcare Expenditure
Average household spending on companion-animal medical care surpassed USD 1,732 in the United States during 2024, with sterilization now bundled into “silver” or “gold” wellness packages at corporate chains such as Banfield Pet Hospital. Value-based pricing and extended credit options have increased client uptake of pre-operative bloodwork, IV-fluid therapy, and post-operative analgesia, raising both ticket size and perceived quality. Similar dynamics play out in the United Kingdom and Australia, where pet-insurance riders reimburse elective surgeries, pushing premium procedure adoption and fortifying the spay and neuter market.
Restraints Impact Analysis*
| Restraint | (~) % Impact on CAGR Forecast | Geographic Relevance | Impact Timeline |
|---|---|---|---|
| Shortage of skilled veterinary surgeons (rural) | -0.9% | Global; acute in rural North America & Europe | Medium term (2-4 years) |
| Cultural & religious opposition to sterilization | -0.5% | Asia-Pacific, Middle East, selective global regions | Long term (≥ 4 years) |
| Post-operative complication concerns among owners | -0.3% | Global; higher in developing markets | Short term (≤ 2 years) |
| COVID-19 backlog delaying elective procedures | -0.4% | Global; recovery phase ongoing | Short term (≤ 2 years) |
| Source: Mordor Intelligence | |||
Shortage of Skilled Veterinary Surgeons (Rural)
Shelter surveys show 73% of facilities delaying surgeries because of veterinarian shortages, with 18,648 animals on waiting lists as of 2024. Economic disincentives and lifestyle preferences steer new graduates toward urban posts, creating “veterinary deserts” where travel distances inflate owner drop-off rates. Europe reports 78.5% of its rural areas under-served, compelling NGOs to deploy mobile teams and tele-mentoring to preserve procedure volumes[2]Source: NVA Communications, “EQT to Acquire VetPartners,” nva.com.
Cultural & Religious Opposition to Sterilization
Thailand’s semi-owned dog population posts sterilization rates below 20%, influenced by Buddhist beliefs framing neutering as interference with karma. In Nordic nations, a traditional view of intact dogs remains prevalent, while nuanced interpretations of Islamic jurisprudence influence attitudes across the Middle East. These sensibilities dampen uptake, forcing campaigns to focus on education and voluntary compliance.
*Our forecasts treat driver/restraint impacts as directional, not additive. The impact forecasts reflect baseline growth, mix effects, and variable interactions.
Segment Analysis
By Procedure Type: Surgical Dominance Faces Innovation Pressure
Spay surgeries represented 56.08% of the spay and neuter market size in 2025, reflecting higher pricing for ovariohysterectomies and longer theater time. Neuter procedures contribute steady volume but lower revenue per case, enabling high-throughput clinics to balance margins. Surgical protocols are standardized across corporate chains, allowing predictable inventory management and consistent quality in the spay and neuter market.
Non-surgical alternatives account for a small but rapidly growing share, propelled by Suprelorin implants that provide 6-12 months of reversible infertility with 99% efficacy in field trials. Pipeline innovations in immunocontraceptive vaccines promise single-visit solutions appealing to owners concerned about anesthesia risk. As these options scale, surgical dominance may erode, prompting practices to diversify service menus and retrain staff—yet the spay and neuter market is expected to keep surgical services at its core through 2031.



By Animal Type: Canine Leadership with Feline Growth Acceleration
Dogs held 64.62% of the overall revenue in 2025, reflecting larger body size, higher anesthesia dosages, and owner preference for bundled upgrades such as laser incision and extended pain control. Large-breed spays can cost 2.2× more than a feline ovariohysterectomy, anchoring margins for full-service hospitals and specialty chains.
Cats, however, are forecast to grow at 6.05% CAGR, buoyed by municipal TNR grants that underwrite high-volume sterilization days and by rising urban adoption rates of companion cats in Asia-Pacific cities. Enhanced trap designs, feral-friendly anesthesia protocols, and bulk-price suture packs collectively compress costs, keeping the spay and neuter market competitive for shelters and NGOs.
By End User: Hospital Dominance Challenged by Mobile Innovation
Veterinary hospitals commanded 53.12% of 2025 revenue, leveraging multi-disciplinary teams, advanced diagnostic suites, and in-house pharmacies to deliver integrated experiences within the spay and neuter industry. Corporate operators negotiate national drug contracts, deploy centralized HR, and run call-center scheduling that lifts utilization rates.
Mobile/community programs, expanding at a 6.92% CAGR, directly address access gaps. Best Friends’ Navajo Nation van, outfitted with two surgical tables and autoclave, performed 3,000 procedures in its inaugural year, cutting owner travel time by 80%. Municipalities and NGOs increasingly co-fund similar units, bringing the spay and neuter market to parking lots, grange halls, and tribal lands otherwise devoid of care.
Geography Analysis
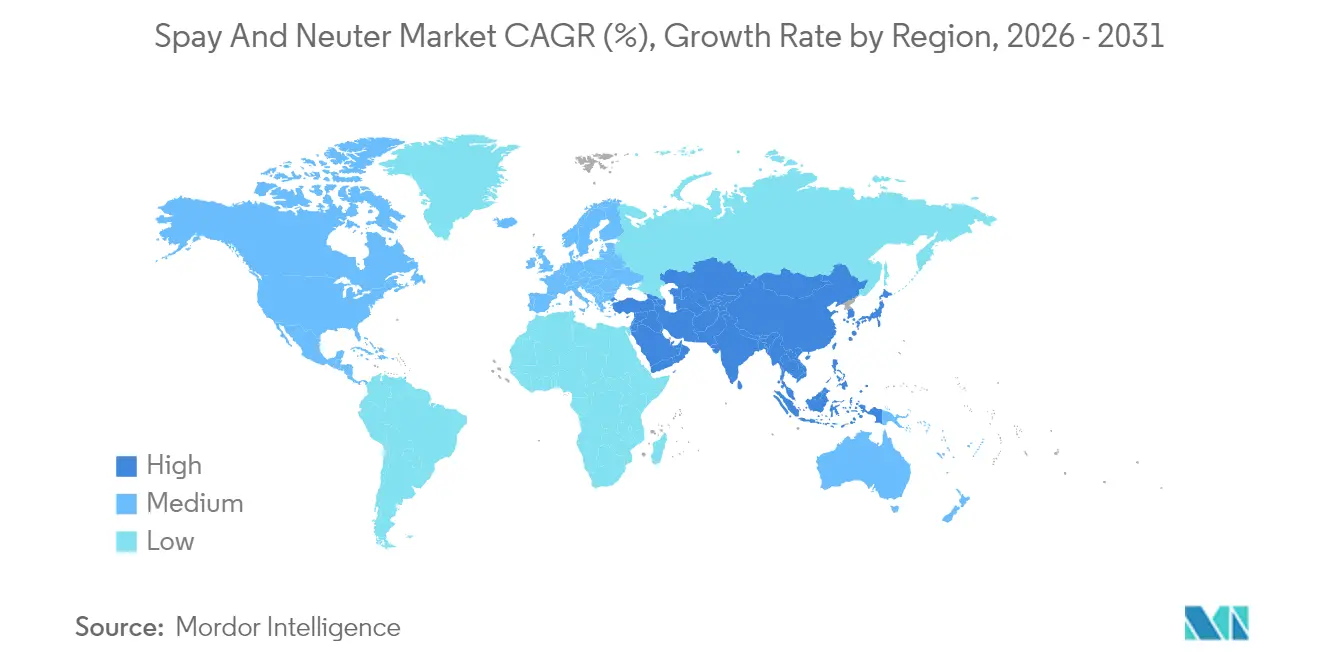
North America retained 41.74% of global revenue in 2025, fortified by uniform shelter-neuter requirements across 32 states and an extensive corporate clinic footprint. Mars Petcare’s 3,000-plus locations in Banfield and VCA networks have standardized post-operative pain protocols and broadened financing options, accelerating premium uptake. Public-private voucher schemes in Texas and California further buttress procedure volumes among price-sensitive demographics.
Asia-Pacific registers the highest 7.86% CAGR, attributed to rising middle-class ownership and government incentives to reduce stray populations. China’s veterinary-school enrollment has nearly doubled since 2020, yet supply lags demand, pushing procedure prices upward and sustaining strong profitability for early entrants. In India, Mars Inc.’s stake in Crown Veterinary Services channels capital into modern surgical suites and structured internships, elevating clinical standards and advancing the spay and neuter market.
Europe maintains mature uptake supported by embedded animal-welfare legislation, although procedure growth is incremental. Germany’s federal law requiring shelter sterilization pre-adoption stabilizes demand, while Spain’s “One Health” strategy bundles sterilization subsidies with rabies-vaccination campaigns, ensuring steady clinic throughput. Latin America and the Middle East/Africa show mixed progress; urban hubs such as São Paulo and Johannesburg implement voucher programs, yet rural penetration remains modest due to clinician shortages and cultural hesitancy.

Regulatory Landscape
Regulatory oversight for spay and neuter services sits across animal welfare statutes, municipal ordinances, and cross-border movement rules. In the United States, Indiana Code IC 15-20-4 mandates spay or neuter for animal care facilities under defined conditions, which ties shelter workflows to preventive care requirements. In Europe, the EU Commission Delegated Regulation (EU) 2026/131 sets animal health requirements for the non-commercial movement of pets, with transitional timelines ending on 21 April 2026.
EU Delegated Regulation (EU) 2020/692 also requires rabies vaccination and Echinococcus multilocularis treatment for dogs, cats, and ferrets entering the EU. Member states are encouraged to implement neutering programs and awareness-raising activities to address abandonment and uncontrolled reproduction, supporting municipal and NGO program funding that sustains sterilization volumes.
Value Chain Analysis
The spay and neuter value chain starts with demand generation through municipal and NGO campaigns, then moves to case acquisition and scheduling through call centers, online registration, vouchers, and appointment deposits. Clinical delivery covers pre-operative exam, anesthesia, surgery, and immediate recovery, with add-on services such as microchipping, vaccination, and take-home analgesia. High-volume providers typically depend on standardized protocols, efficient patient flow, and predictable sourcing of consumables such as sutures, sterile packs, anesthetics, and pain management to control per-procedure costs while maintaining throughput.
Service delivery models separate between full-service veterinary hospitals and mobile or community-based programs. Petco Vetco Total Care runs a dual model with Vetco Vaccination Clinics (mobile, express) and Vetco Total Care (in-store, full-service hospitals) for surgical procedures including spay and neuter. Nonprofit providers such as the Houston Humane Society also use appointment-based surgery systems, funding shelter operations through prepaid deposits and service revenue.
Competitive Landscape
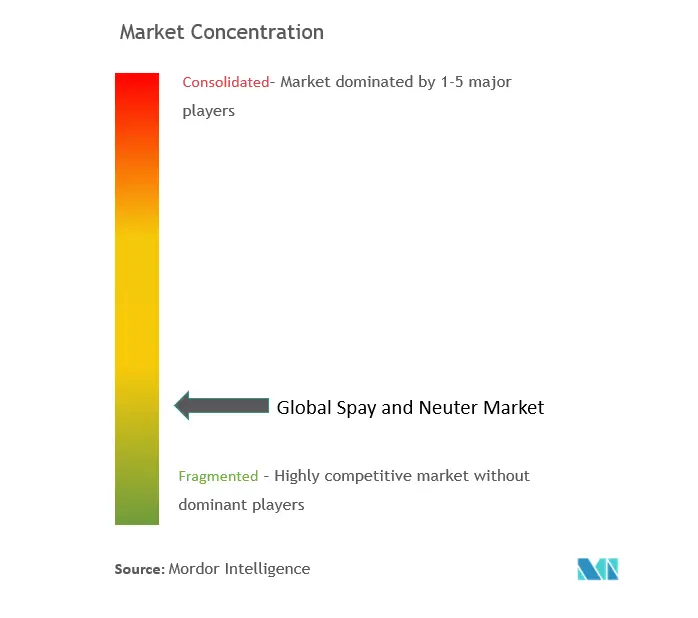
The spay and neuter market displays moderate concentration: the top five corporate chains control an estimated half of US companion-animal revenue.. Mission Veterinary Partners’ pending merger with Southern Veterinary Partners will create a 730-hospital entity, magnifying purchasing power and data-analytics reach. Mars Petcare retains the lead with roughly 45% share of US corporate outlets, integrating primary, specialty, and diagnostics across Banfield, BluePearl, and VCA platforms.
Private-equity ownership fuels roll-up activity across Europe and Oceania. EQT’s acquisition of VetPartners’ 267 clinics in Australia and New Zealand earmarks capital for imaging equipment and staff education, reinforcing competitive capabilities[2]Best Friends Animal Society. "Spay/Neuter Stimulus Funding." May 1, 2025. bestfriends.org . New entrants exploit geographic white spaces: nonprofit Emancipet grows via low-fee urban clinics, while tele-scheduling startups match part-time surgeons with rural shelters on surgery days, shaving backlog wait times. Pharmaceutical players are also active: Boehringer Ingelheim’s purchase of Saiba Animal Health signals intent to integrate therapeutic vaccines into broader wellness offerings, potentially opening cross-selling channels within hospital chains.
Spay And Neuter Industry Leaders
-
Companions Spay & Neuter
-
Petco Animal Supplies, Inc.
-
Naoi Animal Hospital
-
Houston Humane Society
-
East Valley Veterinary Clinics
- *Disclaimer: Major Players sorted in no particular order

Market Opportunities and Future Outlook
Campaign-driven access expansion supports spay and neuter capacity, including targeted efforts for stray cat populations. The Houston Humane Society Fix Felix program (April 2026) and Spay Day programs expand service capacity and reduce euthanasia pressure in urban markets. EU regulatory encouragement around responsible pet ownership awareness in 2026 also helps anchor opportunities for program-led sterilization across regions.
Private-nonprofit funding and policy alignment create practical scaling pathways. Best Friends Animal Society's SpayTogether has deployed over USD 2 million in funding to support about 50,000 spay and neuter surgeries across eight US states. Petco Love grants in 2026, including support for the Heaven Can Wait Animal Society in Southern Nevada and the Sacramento SPCA, further illustrate how high-volume spay and neuter capacity can be expanded in priority metro areas.
Recent Industry Developments
- July 2026: Houston Humane Society launched a promotional July Clinic Special offering a 10% discount on routine spay/neuter procedures to incentivize volume at its veterinary clinic. The initiative increases short-term procedure throughput and access to care in a major US market, potentially shaping regional demand dynamics.
- June 2026: Petco Love announced a $15,000 grant investment for the Heaven Can Wait Animal Society to increase access to veterinary services in Southern Nevada as part of a $1.2M national initiative for spay/neuter clinics. The capacity expansion strengthens private-nonprofit collaboration to scale services in high-demand areas.
- February 2026: Petco Love granted $15,000 to the Sacramento SPCA to support high-volume spay and neuter services at the Zoe K. McCrea Animal Health Center. The funding boosts throughput and affordability in a key urban area, influencing service availability and pricing pressures.


Research Methodology Framework and Report Scope
Market Definition and Coverage
For this study, the spay and neuter market is defined as revenues generated from surgical sterilization procedures and closely related clinical services delivered to companion and selected community animals, across veterinary hospitals, clinics, and shelter programs, reported in USD value terms.
Scope exclusions: We exclude routine wellness items not tied to sterilization (such as vaccinations, general grooming, and non-procedure pet services) unless they are bundled and priced as part of the sterilization visit.
Segmentation Overview
-
By Procedure Type
- Spay (Ovariohysterectomy)
- Neuter (Orchiectomy)
- Non-surgical Sterilization
-
By Animal Type
- Dogs
- Cats
- Other Companion Animals
-
By End User
- Veterinary Hospitals
- Veterinary Clinics
- Animal Shelters & NGOs
- Mobile / Community Programs
-
By Geography
-
North America
- United States
- Canada
- Mexico
-
South America
- Brazil
- Argentina
- Rest of South America
-
Europe
- Germany
- United Kingdom
- France
- Italy
- Spain
- Russia
- Rest of Europe
-
APAC
- China
- India
- Japan
- South Korea
- Australia
- Rest of APAC
-
Middle East and Africa
- GCC
- South Africa
- Rest of Middle East and Africa
-
North America
Data Sources, Market Sizing, and Validation
Desk Research
Desk research was used to set the market boundary, build the first demand pool, and align our model with measurable real-world signals. We referenced public and official sources such as the AVMA for practice and workforce context, the USDA for animal health and population related statistics, CDC rabies and bite surveillance for public health drivers, and FAO country livestock and companion-animal adjacent indicators where relevant. We also reviewed peer-reviewed veterinary journals to understand procedure protocols and anesthesia use patterns that can influence average pricing.
On the supply and pricing side, we used sources such as company filings, investor presentations, shelter and municipal program pages, and reputable press to track clinic expansion, nonprofit sterilization campaigns, and pricing policies. Where needed, paid subscriptions for company financials, patent databases, and shipment-level trade views were used to cross-check commercialization signals and input assumptions. The desk sources listed here are illustrative, and many other public references were also used for data capture, validation, and clarification.
Primary Interviews and Surveys
Primary work focused on validating procedure volumes, regional price points, and how clinics allocate sterilization within broader preventive care packages. We spoke with a mix of veterinary clinicians, practice administrators, shelter program managers, and distributors so the gaps from desk research could be narrowed and then rechecked across major demand regions. For global consistency, pricing logic and utilization assumptions were stress-tested in follow-ups when early responses created wide spreads in implied revenue per procedure.
Distribution of primary research fieldwork respondents
| Company type | Respondent position | Region |
|---|---|---|
| Top tier: 30% | CXOs: 12% | APAC: 41% |
| Mid tier: 49% | Functional/Unit leaders: 32% | EMEA: 35% |
| Smaller Players: 21% | Managers: 56% | Americas: 24% |
Market-Sizing & Forecasting
Sizing starts with a top-down demand pool build that reconstructs the addressable procedure base from pet population signals, sterilization prevalence, clinic and shelter throughput, and the share of animals that are medically eligible in a typical year. Those totals are translated into value using blended average selling price inputs that reflect observed price bands by geography and care setting, before the results are split into procedure and end-user buckets. To keep the estimates grounded, we corroborate them with selective bottom-up checks, including sampled clinic price menus, shelter program budgets, and limited supplier and channel conversations that indicate procedure intensity and utilization.
Key inputs used in the model include pet ownership and adoption momentum, local sterilization mandates and subsidy schemes, veterinary capacity indicators (appointment availability and staffing), anesthesia and consumables cost pressure that influences pricing, and the mix shift between private clinics and high volume spay and neuter programs. For forecasting, scenario analysis was used because procedure demand is sensitive to household spending, municipal funding cycles, and capacity constraints, which can move together in some years. Where bottom-up detail is missing for smaller markets, we fill gaps using proxy prevalence and price bands from comparable countries and then re-test them with regional experts.
Data Validation & Update Cycle
We run multi-step checks so the final market value matches what clinics and programs can realistically deliver in a year. Outputs are compared with independent signals like reported clinic caseload pressure, shelter intake and adoption trends, and observed pricing movement for common procedure bundles, and any outliers are reviewed until the drivers are clearly explained. Before sign-off, another analyst reviews assumptions, conversions, and logic consistency across regions, and follow-up calls are triggered when responses diverge from the model beyond acceptable ranges.
The report is refreshed annually, and interim updates are made when material events occur, such as policy changes, major funding announcements, or sharp shifts in veterinary capacity. Right before delivery, we perform a fresh pass on key inputs so clients receive the most current view available at the time of purchase.
Mordor Intelligence's Spay and Neuter Market Sizing Compared With Other Published Estimates
Published market values for spay and neuter do not always match because the counted revenue pool can shift with small scope choices, and then the pricing and currency timing choices magnify the gap. Even when two studies agree on procedure counts, differences in what is treated as a paid procedure versus a subsidized program visit can change the final total.
In practice, the biggest splits usually come from how average selling prices are built and refreshed, how exchange rates are applied for multi-country rollups, and whether shelter campaigns are valued at billed rates or at program reimbursement levels. By keeping price points on a current-year basis and re-validating them through follow-up checks before finalizing the USD conversion, the refresh cadence and currency timing keep the estimate aligned with real clinic pricing behavior, a choice applied by Mordor Intelligence.
Benchmark comparison
| Source | Market Size | Gaps in Research Methodology |
|---|---|---|
| Mordor Intelligence | USD 2.83 B (2026) | |
| Industry Association A | USD 2.35 B (2026) | Often values shelter and municipal sterilization at reimbursed or subsidized rates only, and can undercount private clinic bundle pricing, which pulls down the blended ASP. |
| Global Consultancy B | USD 3.10 B (2026) | Commonly extends scope to include broader perioperative visit revenue and follow-up care, and may apply uniform price escalation across regions, which inflates implied revenue per procedure. |
The spread in the table is mainly explained by how programs are priced and which parts of the clinical visit are included in the revenue pool. When the model keeps procedure volumes tied to realistic capacity, and then applies refreshed price bands with consistent USD conversion steps, the resulting figure stays traceable and repeatable for planning use cases.


Key Questions Answered in the Report
What is the global value of the spay and neuter market in 2026?
The spay and neuter market size is valued at USD 2.83 billion in 2026 and is projected to reach USD 3.54 billion by 2031.
Which region holds the largest share of the spay and neuter market?
North America leads with 41.74% market share due to mature legislation and dense clinic networks.
Which procedure type grows the fastest through 2031?
Non-surgical sterilization registers the highest 5.30% CAGR, driven by implants and pipeline vaccines.
Why is Asia-Pacific the fastest-growing regional market?
Rapid pet-ownership growth, rising disposable income, and new veterinary investments propel a 7.86% CAGR through 2031.
Page last updated on:


 Your data is secure and never sold or shared.


