Amphibious ATV Market Size and Share
Market Overview
| Study Period | 2019 - 2030 |
|---|---|
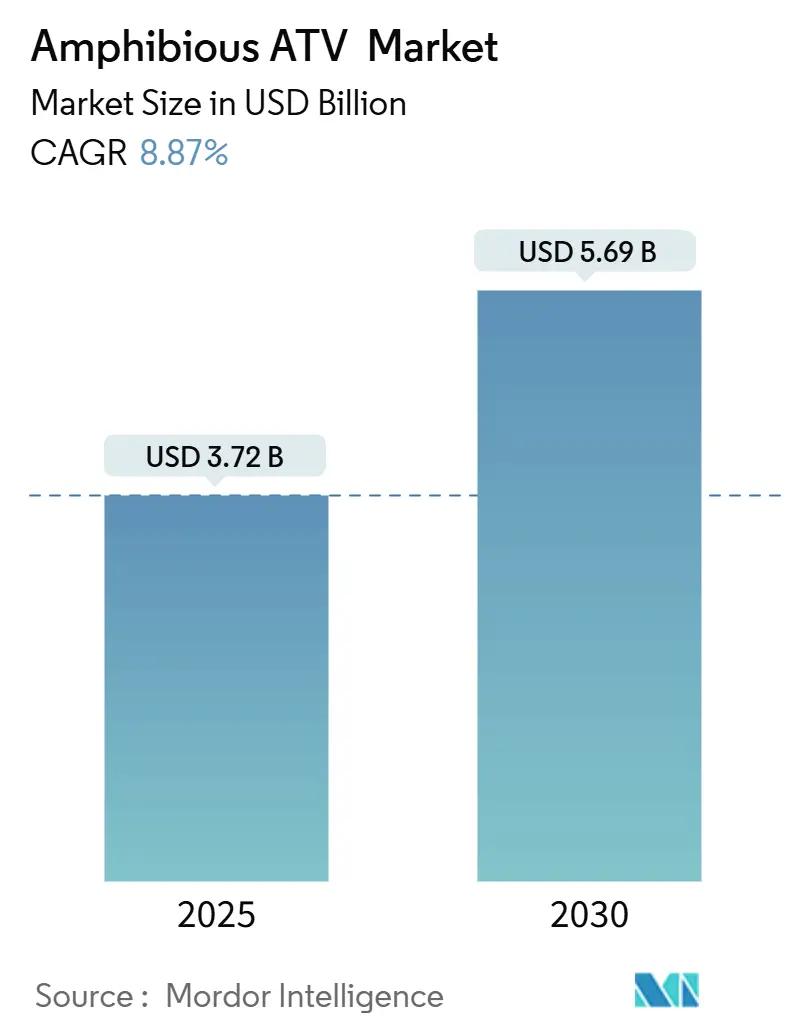
| Market Size (2025) | USD 3.72 Billion |
| Market Size (2030) | USD 5.69 Billion |
| Growth Rate (2025 - 2030) | 8.87% CAGR |
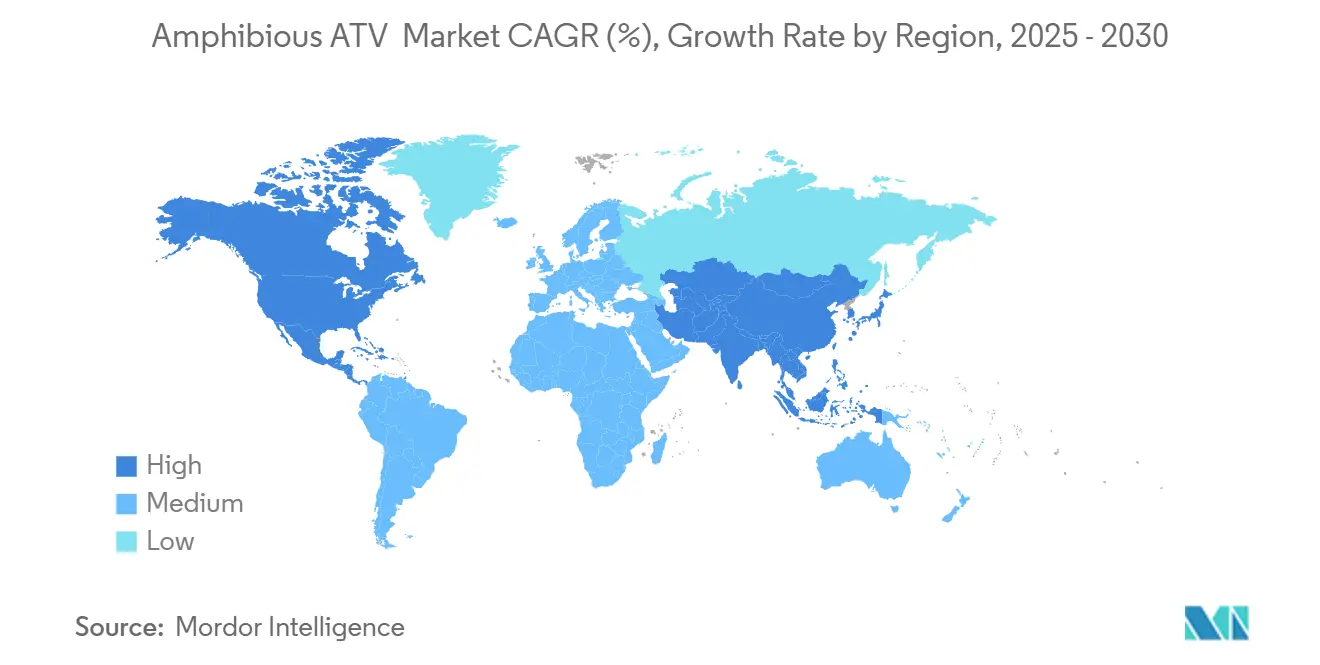
| Fastest Growing Market | Asia Pacific |
| Largest Market | North America |
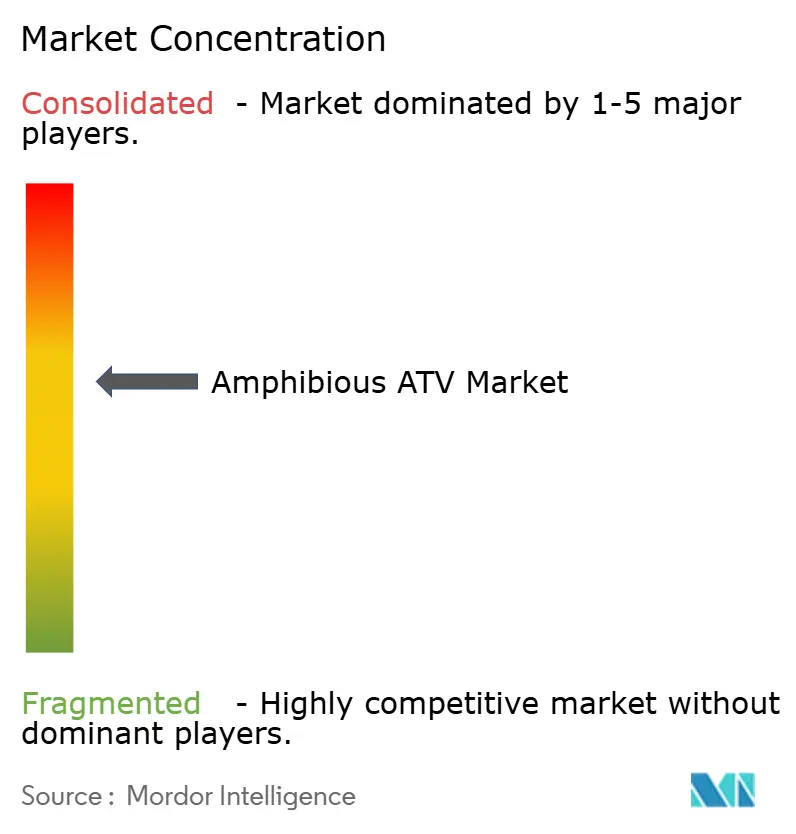
| Market Concentration | Medium |
Major Players *Disclaimer: Major Players sorted in no particular order Image © Mordor Intelligence. Reuse requires attribution under CC BY 4.0. | |
Amphibious ATV Market Analysis by Mordor Intelligence
The amphibious ATV market size stands at USD 3.72 billion in 2025 and is projected to reach USD 5.69 billion by 2030, reflecting an 8.87% CAGR during the forecast period. Robust demand flows from post-pandemic recreation spending, accelerated defense modernization, and climate-driven infrastructure adaptation. Military programs in the United States, China, and NATO nations continue to replace aging assets with next-generation platforms featuring higher payloads, digital architectures, and improved survivability. Recreational buyers gravitate toward multi-purpose machines that can tow, haul, and navigate wetlands without separate watercraft, while institutional customers increasingly mandate amphibious capabilities for high-water emergency response. Electrification, quieter drivetrains, and autonomous navigation systems emerge as key differentiators as environmental regulations tighten and noise-sensitive missions expand. Moderate competitive intensity persists as incumbents protect niche know-how and new entrants chase white-space opportunities in electric and unmanned variants.
Key Report Takeaways
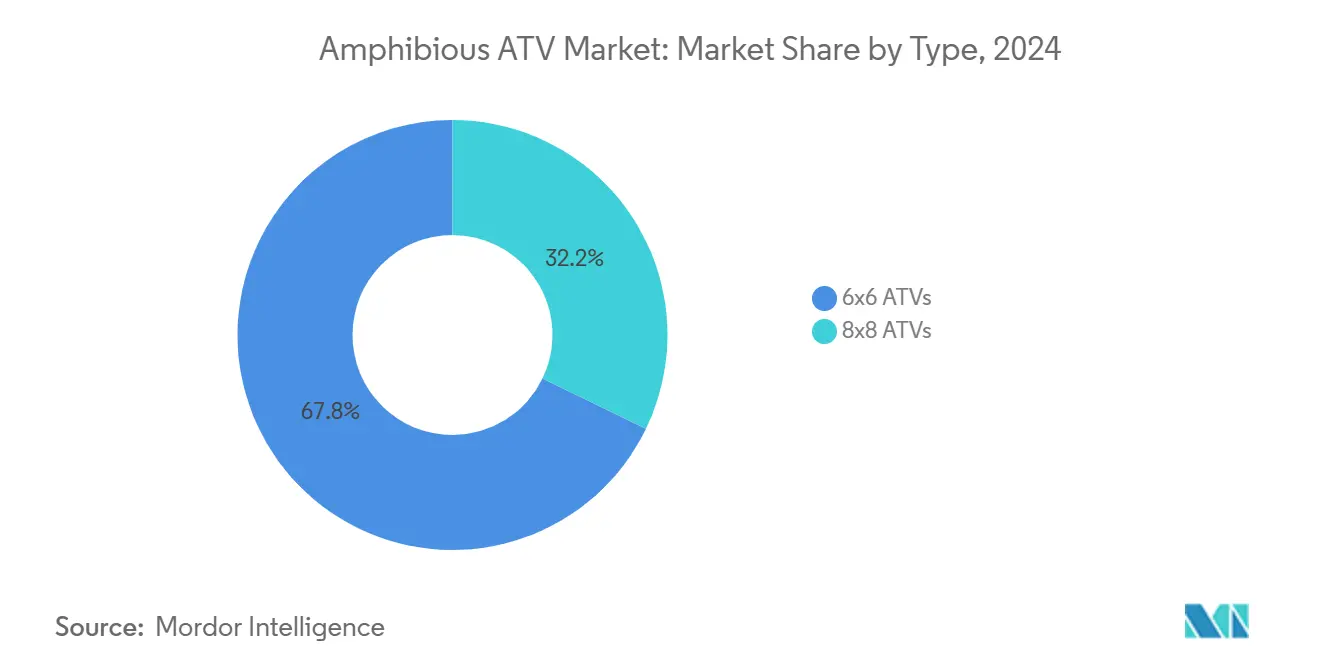
- By vehicle configuration, 6×6 models held 67.82% of the amphibious all-terrain vehicle market share in 2024, and 8×8 models are forecast to expand at a 9.52% CAGR through 2030.
- By application, sports & leisure accounted for 42.24% of the amphibious all-terrain vehicle market size in 2024, and military & defense is projected to record the fastest 9.78% CAGR to 2030.
- By end user, individual consumers captured 47.62% of the amphibious all-terrain vehicle market share in 2024, and government procurement is set to grow at a 9.82% CAGR through 2030.
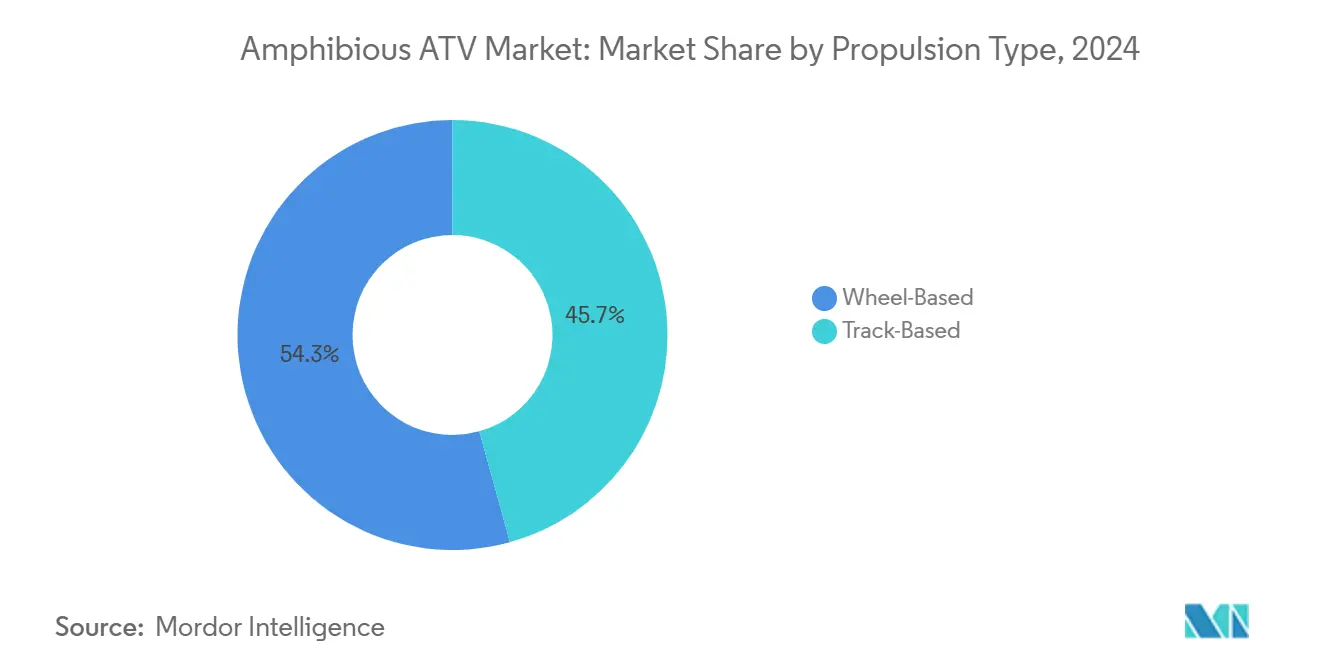
- By propulsion type, wheel-based systems held a 54.31% of the amphibious all-terrain vehicle market share in 2024, and track-based systems are poised to post a 9.65% CAGR through 2030.
- By distribution channel, OEM sales commanded 76.36% of the amphibious all-terrain vehicle market share in 2024, and aftermarket upgrades will expand at a 9.72% CAGR to 2030.
- By geography, North America generated 55.18% of the amphibious all-terrain vehicle market share in 2024, and Asia-Pacific is advancing at a 10.98% CAGR through 2030.
Global Amphibious ATV Market Trends and Insights
Drivers Impact Analysis*
| Driver | (~) % Impact on CAGR Forecast | Geographic Relevance | Impact Timeline |
|---|---|---|---|
| Recreational Off-Road Boom Post-COVID | +2.1% | North America, Europe | Medium term (2-4 years) |
| Electrification and Low-Noise Propulsion | +1.8% | EU, North America (early adoption); global potential | Long term (≥ 4 years) |
| Climate-Driven Flood-Rescue Procurement | +1.6% | Flood-prone regions worldwide | Short term (≤ 2 years) |
| Precision-Agriculture Demand in Soft Soils | +1.3% | North America, Europe, Asia-Pacific farming regions | Medium term (2-4 years) |
| Defense Need for Silent Scout Units | +1.2% | NATO members, Asia-Pacific militaries | Long term (≥ 4 years) |
| Tourism Operators Adding “Land-To-Water” Rides | +0.9% | Global coastal tourism hubs | Medium term (2-4 years) |
| Source: Mordor Intelligence | |||
Recreational Off-road Boom Post-COVID
Outdoor participation surged after travel restrictions eased, creating durable demand for versatile machines to cross wetlands, sandbars, and shallow rivers without trailers. Manufacturers broadened line-ups with comfort seating, Bluetooth displays, and simplified joystick steering to attract new hobbyists. North American dealers report higher repeat purchases as families upgrade from conventional ATVs to amphibious alternatives that extend riding seasons into early spring and late autumn while also serving light utility chores. Retail financing programs with extended tenors lowered barriers to entry, and social media exposure reinforced the value proposition of owning a “go-anywhere” vehicle.
Electrification and Low-noise Propulsion Demand
Battery-electric drivetrains offer near-silent operation, minimal maintenance, and zero local emissions in protected wetlands and eco-tourism zones. Early commercial launches like the WaterCar-EV feature marinized battery packs and sealed hub motors for complete amphibious duty cycles. Militaries accelerate testing of hybrid and pure-electric prototypes for reconnaissance missions where acoustic and thermal signatures must remain low. Supply-chain synergies with off-highway construction equipment enlarge volume potential for high-power battery modules, driving down costs and encouraging broader civilian adoption.
Climate-Driven Flood-Rescue Procurement
Record-breaking storms and urban flooding incidents heightened awareness of mobility gaps in conventional emergency fleets. Agencies now specify amphibious all-terrain platforms capable of operating in 1.3 m water depth, carrying rescue stretchers, and exporting power to critical infrastructure. The U.S. Army’s hydrogen-fuel-cell H2Rescue truck demonstrates how extended range and exportable electricity support disaster relief for multiple days without resupply[1]“H2Rescue Demonstrator Vehicle,”, U.S. Army, army.mil. Municipal utilities and pipeline operators follow suit, citing asset protection mandates under resilience regulations.
Precision-Agriculture Demand in Soft Soils
Wetland farming and rice cultivation require ultra-low ground pressure vehicles to avoid compaction. Amphibious chassis fitted with AI-enabled spray booms and multispectral cameras deliver yield gains by navigating flooded paddies that strand wheeled tractors. Kubota’s KATR concept, awarded at CES 2025, showcases articulated legs that level work platforms on uneven terrain, positioning amphibious architecture as a pillar of next-generation field robotics[2]“KATR Concept Wins CES 2025 Innovation Award,”, Kubota Corporation, kubota.com. Machinery exemptions under the U.S. Clean Water Act ease adoption for routine farm tasks, provided wetland conversion thresholds are not breached.
Restraints Impact Analysis*
| Restraint | (~) % Impact on CAGR Forecast | Geographic Relevance | Impact Timeline |
|---|---|---|---|
| High Purchase and Maintenance Cost Vs. 4×4 ATVs | -1.9% | Price-sensitive emerging markets | Short term (≤ 2 years) |
| Limited Dealer and Service Networks | -1.4% | Rural areas worldwide | Medium term (2-4 years) |
| Environmental Regulations On Wet-Land Intrusion | -1.1% | North America & EU, expanding to APAC | Long term (≥ 4 years) |
| Operator-Licensing/Safety Restrictions | -0.8% | Global, varying by jurisdiction | Medium term (2-4 years) |
| Source: Mordor Intelligence | |||
High Purchase and Maintenance Cost vs. 4×4 ATVs
Amphibious models contain sealed hulls, dual steering modes, and corrosion-resistant drivetrains that elevate material and assembly expense. Low annual volumes restrict economies of scale, keeping unit prices beyond the reach of many first-time buyers. Saltwater exposure accelerates wear, forcing owners to schedule frequent bearing inspections and hull flushing. Institutional buyers mitigate total cost through fleet service contracts, yet retail customers in emerging economies often default to lower-priced 4×4 machines for similar land-only tasks.
Limited Dealer and Service Networks
Specialized parts inventory, hull-pressure test rigs, and amphibious-rated technicians remain concentrated at factory-authorized centers. Riders in remote regions face longer downtimes, higher transport fees, and limited warranty coverage if they venture beyond certified partners. OEMs respond by launching mobile service trailers and online technician programs, but coverage gaps still hamper volume growth in Latin America, Africa, and Southeast Asia.
*Our forecasts treat driver/restraint impacts as directional, not additive. The impact forecasts reflect baseline growth, mix effects, and variable interactions.
Segment Analysis
By Type: Versatility Keeps 6×6 Dominant While 8×8 Gains Payload Appeal
The 6×6 format captured 67.82% share of the amphibious all-terrain vehicle market in 2024, owing to its balance of maneuverability, towing strength, and garage-friendly footprint. Leading OEMs market 6-wheelers with modular racks, roof canopies, and plug-and-play rescue kits, making the configuration a staple for recreation, light utility, and entry-level government fleets. Rapid tie-down capability enables easy transport in pickup beds or tactical aircraft, further widening user reach.
8×8 platforms pursue heavy industrial and defense missions where 4,000 lb payloads, independent wheel-turbine propulsion, and remote weapon stations become essential. Although representing a smaller base, the segment’s 9.52% CAGR reflects accelerating orders from pipeline companies, telecom operators, and militaries requiring higher buoyancy and redundancy for risk-intensive deployments. Manufacturers integrate central tire inflation, winches, and open-architecture electronics to ensure future upgrade paths. These enhancements place the 8×8 variant on track to narrow the unit-volume gap over the forecast horizon.


By Application: Leisure Leads Today; Defense Surges Next
Sports & leisure held a 42.24% share of the amphibious all-terrain vehicle market in 2024 as families, anglers, and overlanding enthusiasts sought machines that blend off-road thrills with water access. Instagram-ready content featuring beach landings and marshland expeditions multiplied brand visibility. Rental outfits in national parks and lake districts expand fleets to meet holiday peaks, reinforcing recurring demand for mid-range 6×6 units.
Defense procurement is forecast to climb at a 9.78% CAGR through 2030, and momentum has been gained from amphibious brigade doctrines and littoral maneuver strategies. New contracts for 30 mm-turreted combat vehicles, autonomous cargo carriers, and Arctic mobility programs validate long-term budgets. Commercial work applications—utilities, mining, and construction—also rely on amphibious assets to inspect pipelines, install fiber, and haul supplies across swampy rights-of-way, anchoring a diversified revenue stream for OEMs.
By End User: Consumers Underpin Volume, Governments Spur Growth
Individual buyers accounted for a 47.62% share of the amphibious all-terrain vehicle market in 2024, valuing adventure and property-maintenance capability in one vehicle. Social clubs and informal racing events further catalyze aftermarket accessory demand. Government users—fire departments, coastal guards, and defense ministries—drive the fastest 9.82% CAGR through 2030, as climate adaptation funds unlock budgets for high-water rescue and remote asset surveillance. Commercial operators sit between these poles, investing in fleet telematics and safety upgrades to comply with occupational standards and insurance mandates.
By Propulsion Type: Wheels Offer Efficiency; Tracks Win in Extremes
Wheel-propelled vehicles retained a 54.31% share of the amphibious all-terrain vehicle market in 2024, thanks to higher top speeds, road legality in certain states, and simplified maintenance. Operators favor wheels when missions require frequent transitions between asphalt and marshland. Track-based systems, growing at 9.65% CAGR through 2030, dominate Arctic, mining, and peatland projects where ultra-loa w ground pressure prevents sinkage. The Canadian assembly of tracked ExtremV units for Arctic troopers exemplifies state-backed procurement of high-flotation vehicles with 17 kPa ground pressure and 100% grade capability.
By Distribution Channel: OEMs Remain Primary Touchpoint
Original-equipment channels delivered 76.36% share of the amphibious all-terrain vehicle market in 2024, reflecting buyer preference for factory-specified amphibious sealing, warranty coverage, and compliance documentation. Dealer consolidation and factory-run experience centers strengthen OEM grip. The aftermarket, projected at 9.72% CAGR through 2030, gains tailwinds from an expanding installed base that seeks lighting upgrades, roof conversions, and tele-operated retrofit kits. Certification hurdles for hull integrity continue to favor OEM involvement in high-complexity modifications.
Geography Analysis
North America commanded a 55.18% share of the amphibious all-terrain vehicle market in 2024, underpinned by broad recreational participation, robust defense allocations, and favorable financing structures. Federal and provincial resilience programs fund fleet purchases for flood-prone zones, while private landowners invest in ride-and-work hybrids that offset utility vehicle fleet costs. Canada’s Arctic mobility initiative, seeking up to 170 tracked platforms, illustrates institutional demand breadth[3]“Domestic Arctic Mobility Enhancement Program,”, Canadian Department of National Defence, canada.ca. The region’s mature dealer network and transparent registration processes further ease adoption.
Asia-Pacific, expanding at a 10.98% CAGR through 2030, benefits from rising disposable income, extensive coastal populations, and significant defense modernization. China trials uncrewed turret infantry fighting vehicles and India showcases indigenous amphibious haulers for logistics corridors. Agricultural mechanization across Southeast Asia accelerates sales of low-impact 6×6 units for rice paddies and irrigation maintenance. Government subsidies for mechanized farming in Vietnam and Indonesia augment volumes.
Europe exhibits steady growth anchored by stringent environmental regulations that elevate demand for electrified drivetrains. EU Regulation 168/2013 delineates approval pathways for L-category special-use vehicles, guiding OEM design choices. NATO exercises in the High North amplify orders for cold-weather capable assets, while adventure tourism in Scandinavia and the Adriatic adds consumer pull. South America, the Middle East & Africa remain nascent but increasingly active, leveraging amphibious fleets for oil-field logistics, mining exploration, and disaster relief in delta regions.

Competitive Landscape
The market shows moderate concentration, with roughly a dozen firms sharing core technologies in hull design, water-jet propulsion, and gear-train sealing. Long-time specialists such as Argo, Sherp International, and Gibbs Sports Amphibians defend brand equity through incremental innovations—digital cockpits, ergonomic cab enclosures, and integrated winches—while cultivating military variants in parallel. Strategic alliances, such as Textron Systems partnering with Kodiak Robotics for autonomous stacks, aim to fast-track the commercialization of unmanned amphibious carriers.
White-space entrants exploit gaps in silent propulsion and AI navigation. Electric start-ups collaborate with battery suppliers to certify marinized packs, while software firms leverage multi-sensor fusion to map unstructured terrain for obstacle avoidance. Regulatory know-how on dual-use export controls and wetland permitting emerges as a non-price competitive weapon, enabling seasoned firms to win tenders where newcomers lack compliance track records.
Amphibious ATV Industry Leaders
AGRO
Recreatives Industries, Inc. (MAX)
Gibbs Amphibians Ltd.
Mudd-Ox Inc.
WaterCar Inc
- *Disclaimer: Major Players sorted in no particular order

Recent Industry Developments
- August 2025: Leonardo closed a EUR 1.7 billion (USD 1.99 billion) takeover of Iveco Defense Vehicles, positioning the group as a land-systems prime contractor. This acquisition is expected to strengthen Leonardo's presence in the amphibious ATV market by enhancing its product portfolio and expanding its capabilities in land defense systems.
- February 2025: BAE Systems showcased its Amphibious Combat Vehicle (ACV) at the International Defence Exhibition and Conference (IDEX) 2025 in the United Arab Emirates (UAE).


Global Amphibious ATV Market Report Scope
| 6x6 ATVs |
| 8x8 ATVs |
| Sports and Leisure |
| Agriculture Industry |
| Outdoor Work |
| Military and Defense |
| Commercial Enterprises |
| Governmental Bodies |
| Individual Consumers |
| Wheel-Based |
| Track-Based |
| Original Equipment Manufacturer (OEM) |
| Aftermarket |
| North America | United States |
| Canada | |
| Rest of North America | |
| South America | Brazil |
| Argentina | |
| Rest of South America | |
| Europe | United Kingdom |
| Germany | |
| Spain | |
| Italy | |
| France | |
| Russia | |
| Rest of Europe | |
| Asia-Pacific | India |
| China | |
| Japan | |
| South Korea | |
| Rest of Asia-Pacific | |
| Middle East and Africa | United Arab Emirates |
| Saudi Arabia | |
| Turkey | |
| Egypt | |
| South Africa | |
| Rest of Middle East and Africa |
| By Type | 6x6 ATVs | |
| 8x8 ATVs | ||
| By Application | Sports and Leisure | |
| Agriculture Industry | ||
| Outdoor Work | ||
| Military and Defense | ||
| By End User | Commercial Enterprises | |
| Governmental Bodies | ||
| Individual Consumers | ||
| By Propulsion Type | Wheel-Based | |
| Track-Based | ||
| By Distribution Channel | Original Equipment Manufacturer (OEM) | |
| Aftermarket | ||
| By Geography | North America | United States |
| Canada | ||
| Rest of North America | ||
| South America | Brazil | |
| Argentina | ||
| Rest of South America | ||
| Europe | United Kingdom | |
| Germany | ||
| Spain | ||
| Italy | ||
| France | ||
| Russia | ||
| Rest of Europe | ||
| Asia-Pacific | India | |
| China | ||
| Japan | ||
| South Korea | ||
| Rest of Asia-Pacific | ||
| Middle East and Africa | United Arab Emirates | |
| Saudi Arabia | ||
| Turkey | ||
| Egypt | ||
| South Africa | ||
| Rest of Middle East and Africa | ||


Key Questions Answered in the Report
How fast is demand for amphibious off-road vehicles growing through 2030?
Global revenue is forecast to rise from USD 3.72 billion in 2025 to USD 5.69 billion by 2030, equating to an 8.87% CAGR.
Which configuration holds the largest customer base?
6×6 models captured 67.82% of 2024 unit sales thanks to their maneuverability and mid-range pricing.
Where is regional growth most pronounced?
Asia-Pacific leads with a 10.98% CAGR on the back of defense upgrades, agricultural mechanization, and rising recreational spending.
How are electric drivetrains influencing future designs?
Zero-noise propulsion improves tactical stealth and meets tightening emission rules, making battery-electric variants a prime R&D priority for both civilian and military buyers.
What limits adoption in emerging markets?
High upfront prices and sparse dealer networks lengthen payback periods and complicate maintenance, slowing uptake outside established regions.
Page last updated on:


