Electric Three-Wheeler Market Size and Share
Market Overview
| Study Period | 2020 - 2031 |
|---|---|
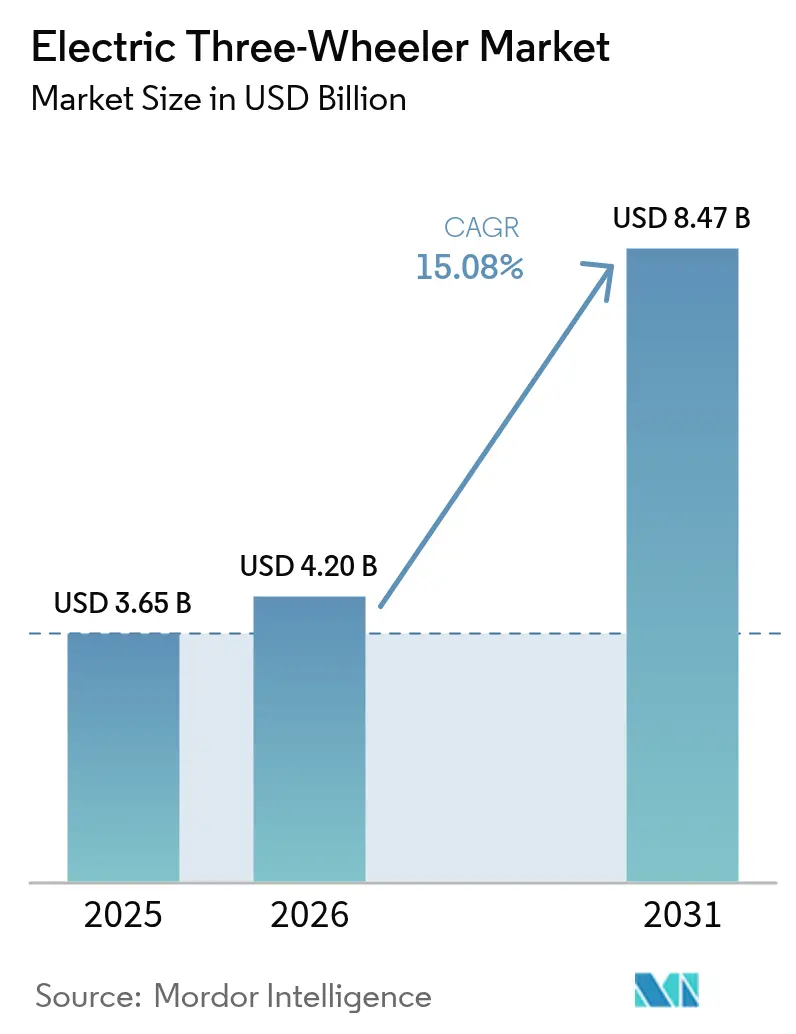
| Market Size (2026) | USD 4.20 Billion |
| Market Size (2031) | USD 8.47 Billion |
| Growth Rate (2026 - 2031) | 15.08% CAGR |
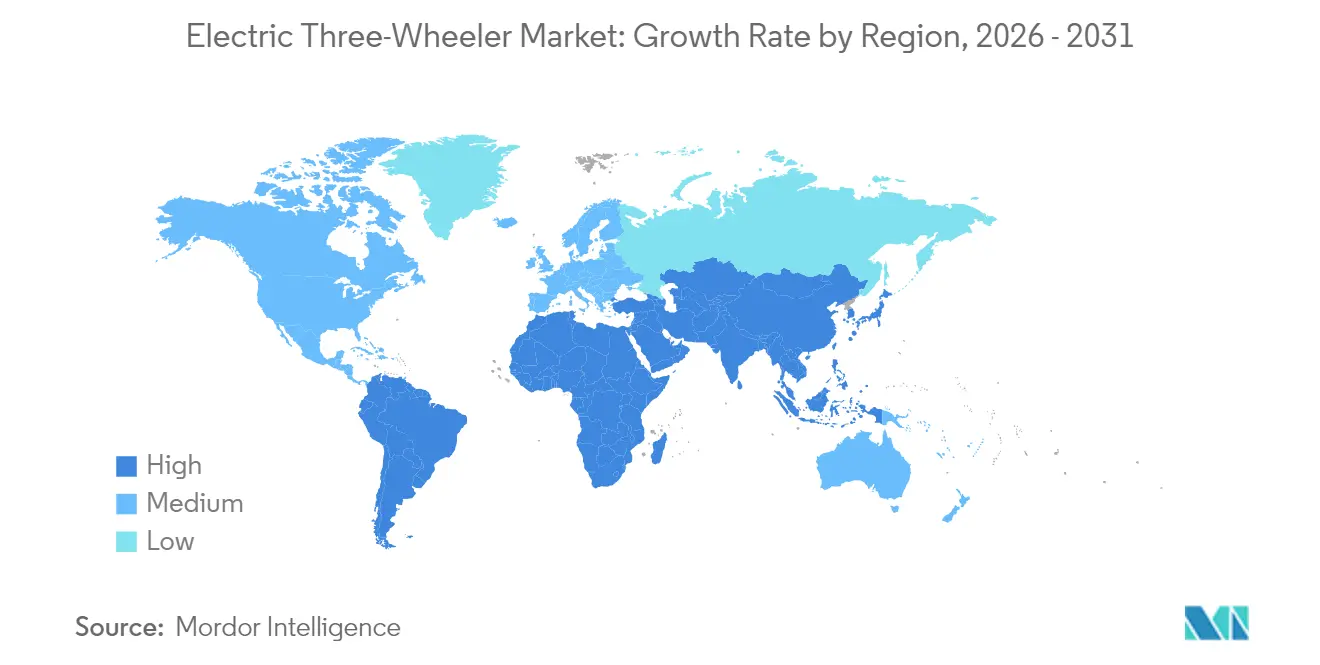
| Fastest Growing Market | Middle East and Africa |
| Largest Market | Asia Pacific |
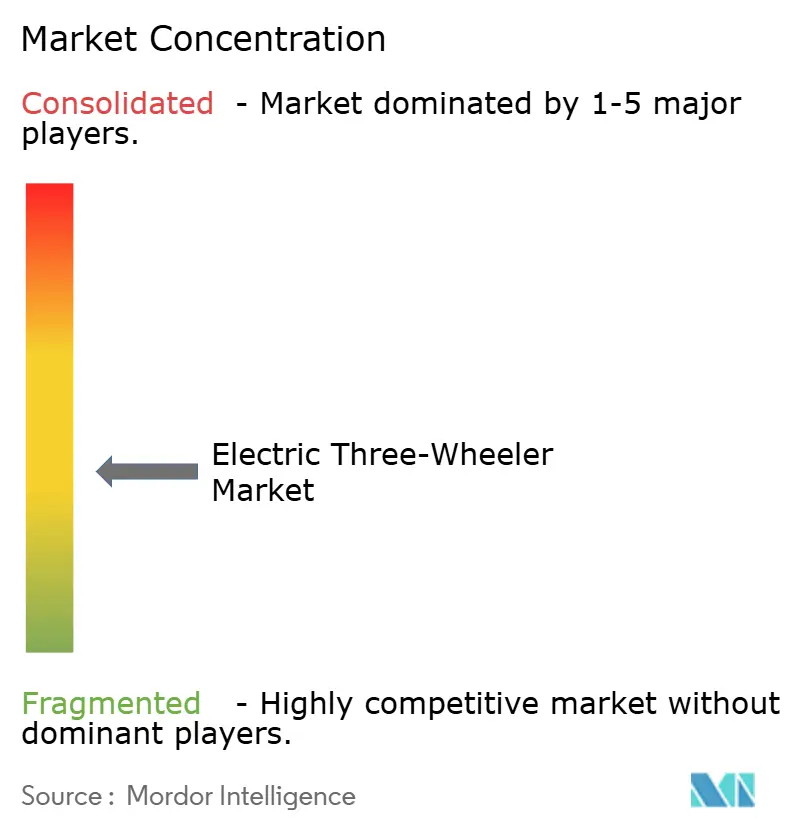
| Market Concentration | Medium |
Major Players *Disclaimer: Major Players sorted in no particular order Image © Mordor Intelligence. Reuse requires attribution under CC BY 4.0. | |
Electric Three-Wheeler Market Analysis by Mordor Intelligence
The electric three-wheeler market size was valued at USD 3.65 billion in 2025 and estimated to grow from USD 4.2 billion in 2026 to reach USD 8.47 billion by 2031, at a CAGR of 15.08% during the forecast period (2026-2031). Rapid policy convergence, breakthrough total-cost-of-ownership parity, and a deepening pool of financing mechanisms are pulling demand forward in both passenger and goods carrier use cases. India’s PM E-DRIVE and the proposed FAME-III programme, the United States Inflation Reduction Act commercial credits, and the EU Fit-for-55 package together sharpen the pricing edge that already exists in high-utilisation fleets. On the supply side, lithium-ion pack prices fell 12% year-over-year in 2024, narrowing the cost delta with lead-acid systems and accelerating the technology transition. Infrastructure innovation also plays a defining role: as of October 2025, Battery Smart, an Indian battery swapping network, has completed 50 million battery swaps at its 1,400 stations, reducing downtime for commercial drivers from hours to mere minutes.
Key Report Takeaways
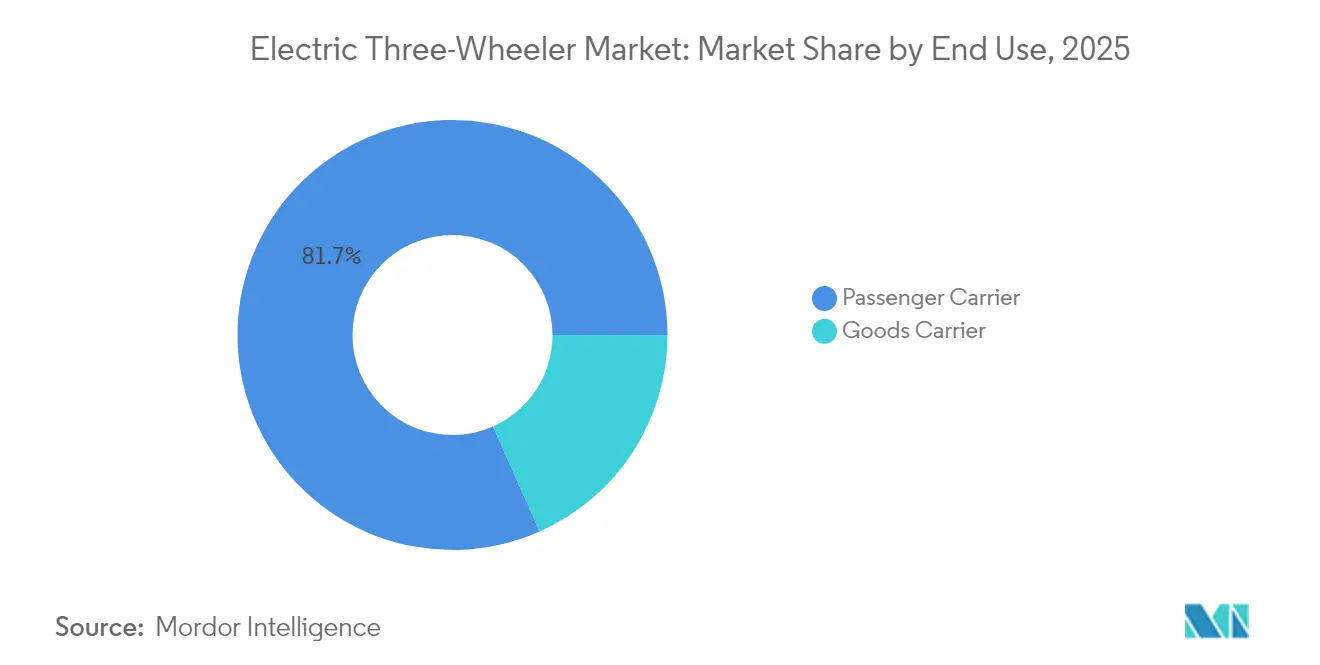
- By end use, passenger carriers dominated with 81.65% revenue share in 2025 in the Electric Three-Wheeler Market, while goods carriers are projected to expand at an 18.60% CAGR through 2031.
- By battery type, lead-acid systems held 63.90% of the electric three-wheeler market share in 2025; lithium-ion packs are set to grow at 20.75% CAGR.
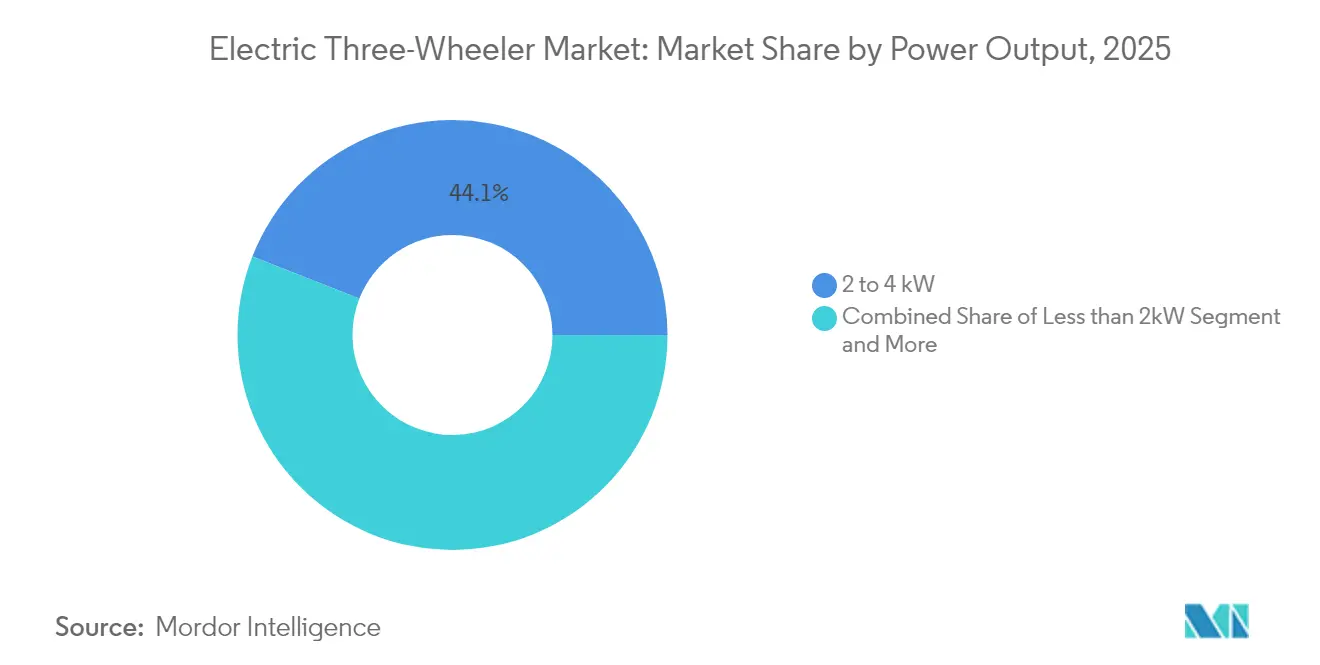
- By power output, the 2–4 kW segment accounted for 44.05% of the electric three-wheeler market size in 2025, whereas 4–6 kW models lead growth at 15.98% CAGR.
- By charging model, fixed plug-in charging controlled 87.80% share in 2025 in the Electric Three-Wheeler Market, but battery swapping will climb with a 23.95% CAGR.
- By geography, Asia-Pacific captured 72.10% share in 2025, while the Middle East & Africa region is advancing at 19.55% CAGR.
Note: Market size and forecast figures in this report are generated using Mordor Intelligence’s proprietary estimation framework, updated with the latest available data and insights as of 2026.
Global Electric Three-Wheeler Market Trends and Insights
Drivers Impact Analysis*
| Driver | (~) % Impact on CAGR Forecast | Geographic Relevance | Impact Timeline |
|---|---|---|---|
| Extended Purchase Incentives | +4.2% | India, US, EU | Medium term (2-4 years) |
| E-Commerce Last-Mile Boom | +3.8% | APAC, North America | Short term (≤ 2 years) |
| Rapid TCO Parity | +3.1% | India, Southeast Asia | Medium term (2-4 years) |
| Rising Li-Ion Energy Density and Price Fall | +2.4% | Global | Long term (≥ 4 years) |
| Fin-Tech Micro-Leasing Platforms | +1.8% | India, SEA, Africa | Medium term (2-4 years) |
| Battery-Swap Corridor Buildouts | +1.2% | India, China, Thailand | Long term (≥ 4 years) |
| Source: Mordor Intelligence | |||
Extended Purchase Incentives Drive Market Acceleration
Coordinated subsidy regimes cut acquisition costs sharply. India earmarked INR 4,100 crore (USD 492 million) for electric three-wheelers under the FAME-III proposal, with phased reductions designed to prevent abrupt demand cliffs. Similar momentum builds in the US and EU, creating predictable policy horizons that support factory capacity investment. Historical evidence shows a multiplier of up to 10 times on sales during earlier incentive rounds. The resulting certainty lowers financing costs and steadies the electric three-wheeler market across regions.
E-commerce Last-mile Transformation Reshapes Demand Patterns
Surging parcel volumes are driving logistics operators to shift from two-wheelers to higher-payload three-wheelers in the Electric Three-Wheeler Market. Commercial users realise operating costs up to 2.5x lower than internal-combustion alternatives, directly boosting driver income in emerging markets. Western retailers are also testing electric quadricycles, signalling spill-over into non-Asian cities, while swap-ready batteries further enhance asset utilisation by cutting downtime to under two minutes.
Rapid TCO Parity Achievement Accelerates Adoption
Sub-30-month payback periods now prevail in India and Southeast Asia, even for lead-acid variants. Lithium-ion models widen the advantage to 15% over combustion peers, thanks to savings of INR 300–400 (USD 3.60–4.80) on daily energy spend. The economics favour high-mileage fleets, driving bulk procurement by ride-sharing and parcel-delivery firms.
Rising Li-ion Energy Density Enables Performance Breakthroughs
CATL’s pricing roadmap to USD 56 per kWh pulls battery pack costs below 20% of total vehicle build in the Electric Three-Wheeler Market. Vehicles such as Montra Electric’s Super Auto achieve a 203 km certified range, eliminating range anxiety in intra-city loops, while standardised safety tests under UN ECE R100 protocols further reinforce buyer confidence.
Restraints Impact Analysis*
| Restraint | (~) % Impact on CAGR Forecast | Geographic Relevance | Impact Timeline |
|---|---|---|---|
| Sparse Dedicated 3-W Charging Infrastructure | -2.8% | India, Africa, South America | Short term (≤ 2 years) |
| Li-Ion Price Volatility | -1.9% | Global | Medium term (2-4 years) |
| Fragmented Retrofit and Homologation Rules | -1.4% | Global, jurisdiction-specific | Long term (≥ 4 years) |
| Heightened Safety-Recalls | -0.8% | India, China | Medium term (2-4 years) |
| Source: Mordor Intelligence | |||
Sparse Dedicated 3-W Charging Infrastructure
India operates 11,000 public chargers, barely 1% of the 1.3 million units required by 2030 in the Electric Three-Wheeler Market. Fault rates exceeding 17% dent user trust, and “charging deserts” appear even in mature regions such as Great Britain. Swap hubs provide a partial remedy, yet scale-up depends on standardisation and concessional capital flows.
Li-ion Price Volatility Creates Working-Capital queeze
Lithium prices collapsed by over 80% in 2024, and nickel by 40%, squeezing miners and upending battery input contracts. Smaller OEMs struggle to hold inventory without exhausting credit lines, prompting calls for INR 25 billion credit-guarantee pools in India. Volatility also distorts long-term sourcing plans, delaying platform refresh cycles and restraining the wider electric three-wheeler market.
*Our forecasts treat driver/restraint impacts as directional, not additive. The impact forecasts reflect baseline growth, mix effects, and variable interactions.
Segment Analysis
By End Use: Commercial Applications Drive Growth Transformation
Passenger carriers commanded 81.65% of the electric three-wheeler market in 2025, underpinned by an entrenched shared-mobility culture in South-Asian megacities. Yet, goods carriers generate the fastest expansion at an 18.60% CAGR, reflecting the boom in last-mile logistics. The electric three-wheeler market size attributable to goods movement will thus widen rapidly through 2031.
Higher utilisation rates amplify total-cost-of-ownership benefits, encouraging fleet operators to adopt finance-plus-swap bundles that slash downtime. Rider earnings in markets such as Kenya already exceed combustion equivalents, confirming the commercial appeal. Passenger services will still post steady unit volumes, although competitive pressure from ride-hailing apps tempers their growth trajectory.


By Battery Type: Technology Transition Accelerates Despite Lead-Acid Dominance
Lead-acid packs held a 63.90% share in 2025 thanks to their low entry cost, but lithium-ion systems will outpace with a 20.75% CAGR to 2031. The electric three-wheeler market share of lithium-ion batteries rises as price declines intersect with rising energy-density benchmarks. CATL's battery cost reduction from USD 110 per kWh in mid-2023 to USD 56 by mid-2024 represents a fundamental shift in technology economics that accelerates lithium-ion adoption.
LFP chemistries, offering safer thermal characteristics, gain traction in municipal and courier fleets seeking predictable duty cycles. Premium passenger operators favour high-energy nickel-rich packs that extend range above 200 km, as demonstrated by Montra Super Auto’s 203 km rating.
By Power Output: Mid-Range Segment Dominates Commercial Applications
The 2–4 kW band captured 44.05% of the electric three-wheeler market in 2025, providing an optimal cost-to-performance mix for urban duties. Units in the 4–6 kW range will grow fastest, delivering the torque needed for heavier payloads and hilly routes at a 15.98% CAGR.
Standardisation patterns follow incumbents: Bajaj Auto’s FY 2024 output of 463,413 three-wheelers shapes supply-chain norms. Design focus, therefore, shifts from peak power to sustained efficiency inside these two power windows.
By Charging Model: Battery Swapping Emerges as a High-Growth Alternative
Fixed plug-in charging still accounts for 87.80% of the installed base, but swapping networks will post 23.95% CAGR driven by commercial applications requiring minimal downtime and infrastructure development targeting high-utilization corridors in secondary cities. Honda’s e: Swap roll-out targets 500 stations across three Indian metros by March 2026.
Swap business models shifts battery ownership from vehicle operators to infrastructure providers, reducing upfront costs and eliminating battery degradation risks that particularly concern commercial users with high daily utilization. However, cross-OEM standardisation remains a hurdle, limiting expansion to allied manufacturer ecosystems in recent times.
Geography Analysis
Asia-Pacific dominated the electric three-wheeler market with a 72.10% share in 2025. India alone sold 580,000 units in 2023, a 65% year-over-year surge on the back of FAME-II grants. Chinese suppliers, buoyed by domestic EV oversupply, channel surplus capacity into Southeast Asia, including a USD 150 million Indonesian plant by Yadea. Thailand’s target of 1,450 swap stations supporting 650,000 two-wheelers by 2030 underscores state-backed infrastructure momentum.
The Middle East and Africa is the fastest-growing region at 19.55% CAGR. The UAE’s penetration jumped from 0.7% in 2021 to 13% in 2023 amid 2050 net-zero goals. African markets adopt two- and three-wheelers as primary income generators; Rwanda leverages solar-powered swap hubs to overcome grid bottlenecks. Europe and North America record more measured uptake. Micro-EV imports face rising tariffs, potentially doubling prices for models such as the Eli ZERO in United States fleets. Nevertheless, urban freight initiatives and low-speed zones open niches for compact three-wheelers, sustaining 11.41% CAGR in North America.

Competitive Landscape
Market concentration remains low, with Mahindra Electric Mobility, YC Electric Vehicle, and Saera Electric Auto holding a majority of the market share. This leaves space for regional specialists and newcomers to scale. Hero MotoCorp staked INR 900 crore (USD 108 million) on Altigreen Propulsion Labs to fast-track entry. Bajaj Auto, meanwhile, plans five new models and 40,000-unit monthly capacity by March 2025.
Infrastructure partnerships form a second competitive battleground. Battery Smart’s network scale confers significant switching costs, giving affiliated OEMs a distribution edge. On the regulatory front, the US FMVSS 305a safety standard, effective February 2025, favours manufacturers with robust documentation, nudging the share toward technically sophisticated players.
Macquarie’s USD 1.5 billion leasing platform, underwritten by a USD 200 million Green Climate Fund tranche, supplies bundled vehicles, batteries, and financing in India. Such an ecosystem integrates asset ownership, energy supply, and credit underwriting, key differentiators in a capital-intensive yet fragmented electric three-wheeler market.
Electric Three-Wheeler Industry Leaders
Mahindra Electric Mobility Ltd
YC Electric Vehicle Pvt Ltd
Bajaj Auto Ltd
Piaggio & C. SpA
Chongqing Zongshen Vehicle Co Ltd
- *Disclaimer: Major Players sorted in no particular order

Recent Industry Developments
- December 2024: Bajaj Auto announced a new electric three-wheeler brand with five models and 40,000-unit monthly capacity by Mar 2025.
- November 2024: Honda Power Pack Energy India set out a 500-station e: Swap rollout across Bengaluru, Delhi, and Mumbai by Mar 2026.
- November 2024: Mahindra unveiled BE 6e and XEV 9e electric SUVs, marking a deeper investment in its EV architecture.


Global Electric Three-Wheeler Market Report Scope
Electric three-wheelers market covers the latest trends and technological developments, demand by the end-use, battery type and geography.Along with a detailed study on major players in the electric three wheeler market, about their innovations, strategies, etc. are also covered in the report.
| Passenger Carrier |
| Goods Carrier |
| Lithium-ion |
| Lead Acid |
| Less than 2 kW |
| 2 - 4 kW |
| 4 - 6 kW |
| Above 6 kW |
| Fixed (Plug-in) Charging |
| Battery Swapping |
| North America | United States | |
| Canada | ||
| Rest of North America | ||
| South America | Brazil | |
| Argentina | ||
| Rest of South America | ||
| Europe | Germany | |
| United Kingdom | ||
| France | ||
| Italy | ||
| Spain | ||
| Russia | ||
| Rest of Europe | ||
| Asia-Pacific | China | |
| India | ||
| Japan | ||
| South Korea | ||
| ASEAN (Indonesia, Thailand, Vietnam, Philippines, Malaysia) | ||
| Rest of Asia-Pacific | ||
| Middle East & Africa | Middle East | GCC (Saudi Arabia, UAE, Qatar, Oman, Kuwait, Bahrain) |
| Turkey | ||
| Rest of Middle East | ||
| Africa | South Africa | |
| Nigeria | ||
| Kenya | ||
| Rest of Africa | ||
| By End Use | Passenger Carrier | ||
| Goods Carrier | |||
| By Battery Type | Lithium-ion | ||
| Lead Acid | |||
| By Power Output (kW) | Less than 2 kW | ||
| 2 - 4 kW | |||
| 4 - 6 kW | |||
| Above 6 kW | |||
| By Charging Model | Fixed (Plug-in) Charging | ||
| Battery Swapping | |||
| By Geography | North America | United States | |
| Canada | |||
| Rest of North America | |||
| South America | Brazil | ||
| Argentina | |||
| Rest of South America | |||
| Europe | Germany | ||
| United Kingdom | |||
| France | |||
| Italy | |||
| Spain | |||
| Russia | |||
| Rest of Europe | |||
| Asia-Pacific | China | ||
| India | |||
| Japan | |||
| South Korea | |||
| ASEAN (Indonesia, Thailand, Vietnam, Philippines, Malaysia) | |||
| Rest of Asia-Pacific | |||
| Middle East & Africa | Middle East | GCC (Saudi Arabia, UAE, Qatar, Oman, Kuwait, Bahrain) | |
| Turkey | |||
| Rest of Middle East | |||
| Africa | South Africa | ||
| Nigeria | |||
| Kenya | |||
| Rest of Africa | |||


Key Questions Answered in the Report
What is the value of the electric three-wheeler market today and how fast is it growing?
The market is worth USD 4.2 billion in 2026 and is projected to rise to USD 8.47 billion by 2031 at a 15.08% CAGR.
Which region currently leads the electric three-wheeler market and which is expanding the fastest?
Asia-Pacific holds 72.10% of global revenue in 2025, while the Middle East & Africa is the fastest-growing region at a 19.55% CAGR through 2031.
What are the top factors driving market adoption?
Extended purchase incentives, booming e-commerce last-mile demand and rapid total-cost-of-ownership parity each add more than 3 percentage points to forecast CAGR, making electric three-wheelers financially attractive for fleet operators.
What infrastructure or supply-chain issues could slow growth?
A shortage of dedicated three-wheeler chargers—India has just 11,000 against a 1.3 million need—and volatile lithium prices that strain working capital together shave nearly 5 percentage points off potential CAGR.
How does battery swapping influence fleet economics?
Swapping cuts downtime to under two minutes and shifts battery ownership off the operator’s balance sheet; India’s Battery Smart has already recorded 50 million swaps across 1,400 stations, underscoring the model’s scalability
Page last updated on:


