Australia Two-Wheeler Market Size and Share
Market Overview
| Study Period | 2019 - 2031 |
|---|---|
| Forecast Data Period | 2026 - 2031 |
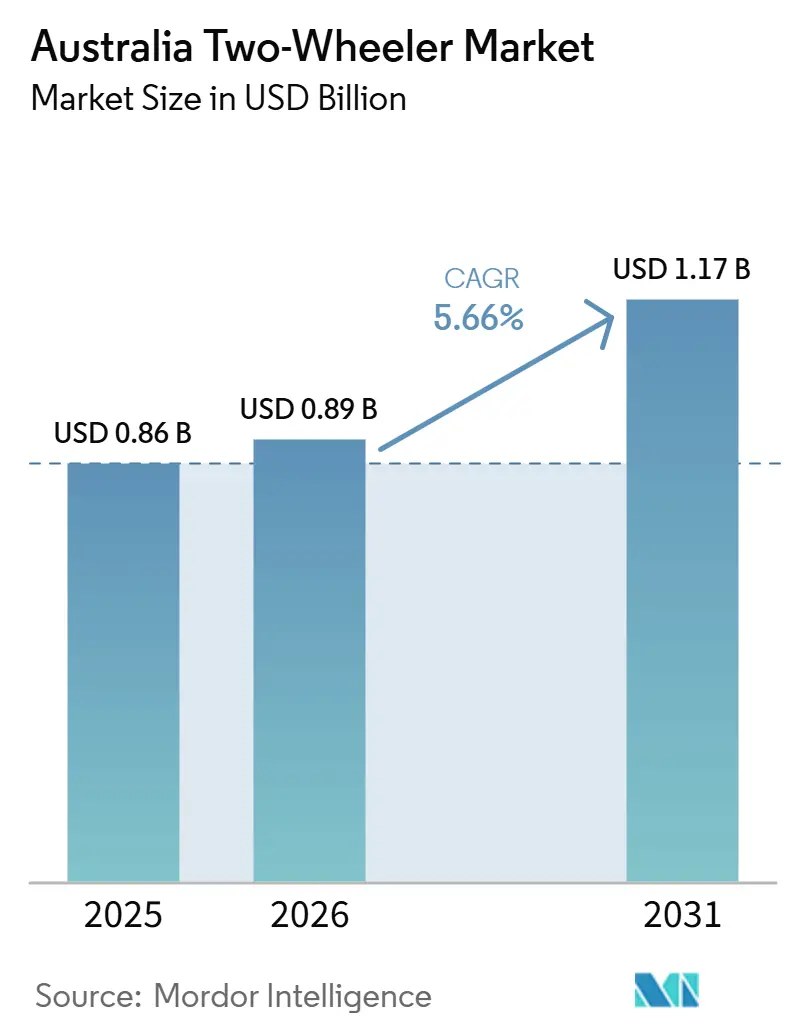
| Base Year Market Size (2025) | USD 0.86 Billion |
| Market Size (2026) | USD 0.89 Billion |
| Market Size (2031) | USD 1.17 Billion |
| Growth Rate (2026 - 2031) | 5.66% CAGR |
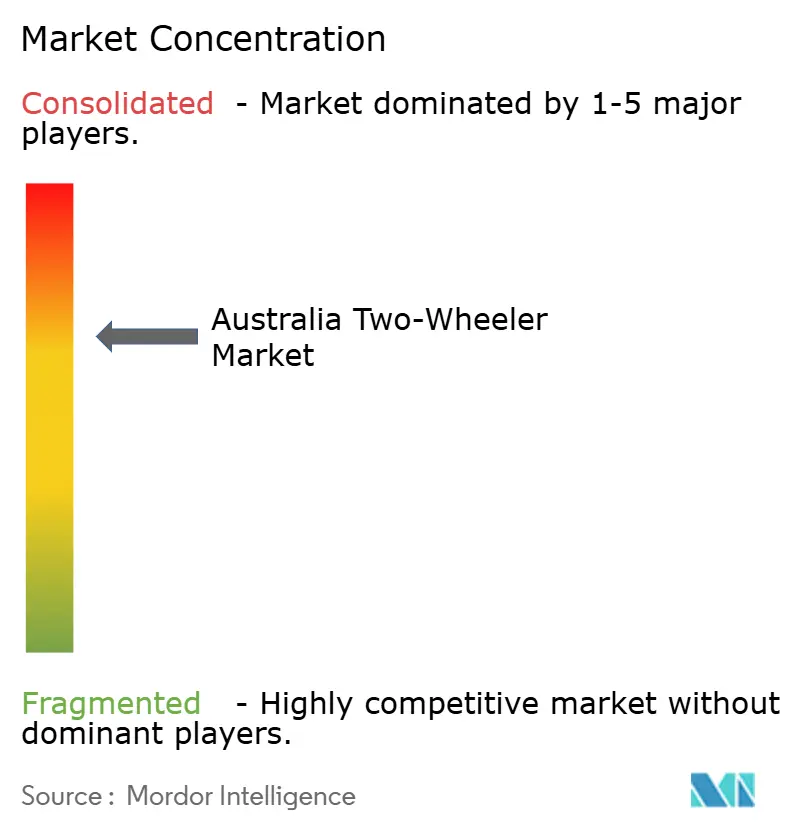
| Market Concentration | Medium |
Major Players *Disclaimer: Major Players sorted in no particular order Image © Mordor Intelligence. Reuse requires attribution under CC BY 4.0. | |
Australia Two-Wheeler Market Analysis by Mordor Intelligence
The Australian two-wheeler market size is expected to grow from USD 0.86 billion in 2025 to USD 0.89 billion in 2026, and is forecast to reach USD 1.17 billion by 2031, at a 5.66% CAGR over 2026-2031. Purchases are accelerating as urban commuters seek affordable, space-saving mobility, while recreational riders fuel demand for adventure and off-road models. Government fuel-efficiency rules enacted in 2025 and state-level electric-vehicle (EV) rebates are nudging manufacturers to balance internal-combustion-engine (ICE) dominance with an expanding electric portfolio. Dealer consolidation and rising e-commerce penetration are reshaping go-to-market strategies, and technology such as Honda’s semi-automatic E-Clutch is lowering the skill barrier for first-time buyers. At the same time, licensing hurdles, high insurance costs for riders under 25, and price competition from budget utes temper growth, creating a dynamic yet moderately concentrated competitive field.
Key Report Takeaways
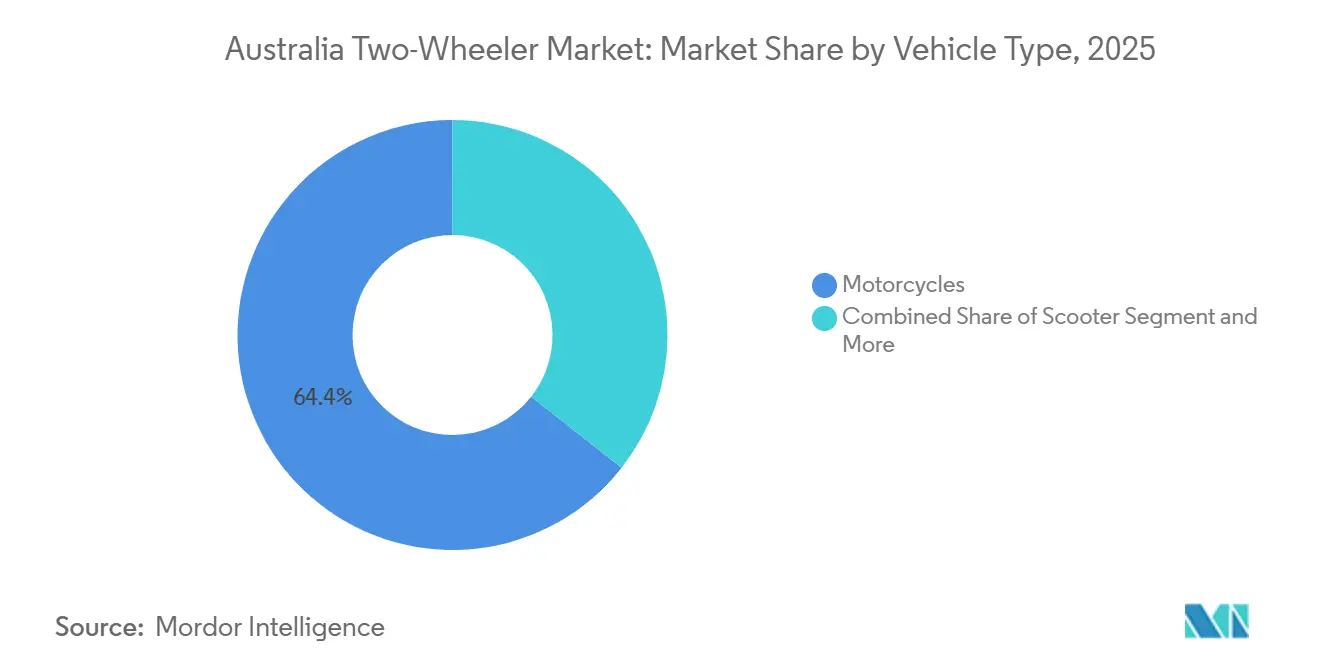
- By vehicle type, motorcycles captured 64.38% of the Australian two-wheeler market share in 2025 and are projected to advance at a 6.51% CAGR through 2031.
- By technology, ICE platforms held a 92.15% share in 2025, while electric two-wheelers represented the fastest-growing cohort with a 12.48% CAGR.
- By transmission, manual models retained 65.33% share, but automatic and continuously variable units are rising at 8.55% CAGR as commuters favor clutch-free riding.
- By fuel type, petrol variants commanded an 88.12% share, whereas electric offerings led growth with a 11.36% CAGR on the back of state rebates and fleet electrification.
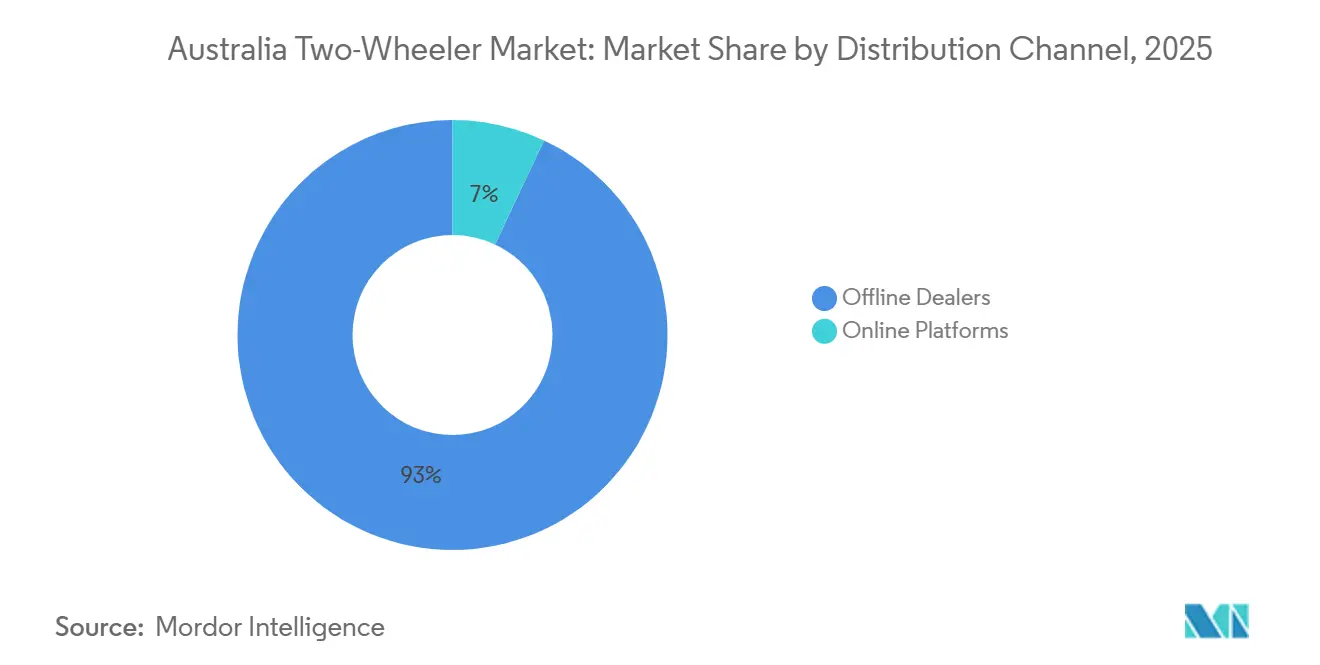
- By distribution channel, offline dealers accounted for 93.04% of 2025 sales, yet online channels are set to grow at a 9.12% CAGR by 2031.
- By end user, personal ownership accounted for 88.62% of demand in 2025, while commercial and fleet customers are expanding at a 7.24% CAGR, spurred by last-mile electrification programs at Australia Post.
- By region, ACT and New South Wales accounted for 33.45% of 2025 unit sales, whereas Western Australia is projected to post the fastest growth at a 7.68% CAGR through 2031.
Note: Market size and forecast figures in this report are generated using Mordor Intelligence’s proprietary estimation framework, updated with the latest available data and insights as of January 2026.
Australia Two-Wheeler Market Trends and Insights
Drivers Impact Analysis*
| Driver | (~) % Impact on CAGR Forecast | Geographic Relevance | Impact Timeline |
|---|---|---|---|
| Urban Congestion and Parking Scarcity | +0.8% | ACT, NSW, Victoria, Queensland metros | Medium term (2-4 years) |
| Fuel Prices and Cost-Sensitive Commuters | +0.6% | National, strongest in regional Queensland and WA | Short term (≤ 2 years) |
| Recreational Off-Road Motorcycling | +0.5% | NT, SA, WA | Long term (≥ 4 years) |
| Rebates for EV Two-Wheelers | +0.4% | ACT, Queensland, Tasmania | Medium term (2-4 years) |
| Fleet Electrification for Last-Mile Delivery | +0.3% | ACT, NSW, Victoria metros | Medium term (2-4 years) |
| Subscription / Bike-as-a-Service Models | +0.2% | ACT, NSW, Victoria urban cores | Long term (≥ 4 years) |
| Source: Mordor Intelligence | |||
Rising Urban Congestion and Parking Scarcity
Sydney, Melbourne, and Brisbane are experiencing heavier traffic and fewer curb-side spaces, prompting commuters to adopt motorcycles and scooters that occupy one-third the footprint of a passenger car [1]“Transport Outlook 2024,” OECD, oecd.org. As parking fees in the CBD remain high, the allure of scooters intensifies. By 2025, scooter registrations are expected to grow, even as overall deliveries face challenges. Additionally, two-wheelers are poised to benefit from upcoming road-user charging schemes, which will impose penalties on heavier vehicles. With the rise of hybrid work patterns, there's a growing preference for flexible, point-to-point trips, further establishing the Australian two-wheeler market as a viable alternative to public transit.
Escalating Fuel Prices and Cost-Sensitive Commuters
Even after an excise cut implemented in 2026, petrol price fluctuations remain a significant concern for households[2]“Petrol Monitoring Update April 2026,” Australian Competition and Consumer Commission, accc.gov.au. Motorcycles, which are more fuel-efficient than light cars, offer notable annual savings on fuel costs. Furthermore, the OECD's push for increased fuel taxes would amplify these cost benefits for two-wheeler users. As a result, families in Queensland and Western Australia are increasingly opting to replace their second car with a two-wheeler.
Recreational off-Road Motorcycling Culture
In the Northern Territory, South Australia, and Western Australia, off-road touring has become a staple leisure activity. By 2025, Yamaha's Tenere 700, WR450F, and YZ series had established a strong presence in the category. Events like the RideADV Flinders Six Day Navigation Ride highlight participants' enthusiasm and willingness to spend. Manufacturers, including KTM, have rolled out their entire 2026 off-road lineups, underscoring their dedication to this lucrative niche.
Government Rebates for EV Two-Wheelers
In Australia, two-wheeler incentive programs vary by state, but their impact is significant. The ACT offers interest-free loans and waives registration fees. In contrast, Queensland provides a modest rebate for scooters. Tasmania's funding ran out in 2025, and New South Wales doesn't include motorcycles in its incentives, which has discouraged OEMs from launching state-specific models. As a result, EV adoption is concentrated in Canberra and Brisbane, influencing the broader Australian two-wheeler market.
Restraints Impact Analysis*
| Restraint | (~) % Impact on CAGR Forecast | Geographic Relevance | Impact Timeline |
|---|---|---|---|
| Licensing and Safety Regulations | -0.7% | National, toughest in Victoria and NSW | Long term (≥ 4 years) |
| Pricing of Micro-Cars and Utes | -0.5% | National, sharpest in regional areas | Medium term (2-4 years) |
| Insurance Premiums for Young Riders | -0.4% | National, peak in NSW and Victoria | Medium term (2-4 years) |
| Battery-Pack Supply Bottlenecks | -0.3% | National, EV segment specific | Long term (≥ 4 years) |
| Source: Mordor Intelligence | |||
Stringent Rider Licensing and Safety Regulations
In Australia, graduated schemes stretch the path to an unrestricted license over several years. They enforce a strict zero-blood-alcohol-content rule and limit power-to-weight ratios. Riders under a certain age are required to complete mandatory training courses and pay higher insurance excesses. As a result, first-year ownership costs are significantly high. These stringent measures stand in stark contrast to the lenient rules governing unlicensed e-scooters, diverting potential entrants away from the Australian two-wheeler market.
Competitive Pricing of Micro-Cars & Utes
In 2026, MG introduced its U9 ute, designed to align with the overall costs associated with larger motorcycles. During the same period, federal efficiency standards began enforcing stricter penalties on OEMs for exceeding CO₂ emission targets. These regulatory changes have significantly influenced the adoption of fuel-efficient light vehicles, gradually diminishing the appeal and market value of two-wheelers, reshaping consumer preferences, and industry dynamics.
*Our forecasts treat driver/restraint impacts as directional, not additive. The impact forecasts reflect baseline growth, mix effects, and variable interactions.
Segment Analysis
By Vehicle Type: Motorcycles Sustain Versatility Advantage
Motorcycles secured 64.38% of the Australian two-wheeler market share in 2025 and are on track for 6.51% CAGR through 2031, due to broad use cases spanning urban commuting, highway touring, and weekend trail riding. Yamaha's dominance in the adventure, motocross, and street bike categories highlights its appeal to both novice and premium riders. This growth is further fueled by Western Australia's off-road culture, where premium adventure bikes significantly enhance dealer margins.
In 2025, scooters, though occupying a smaller segment, outpaced the broader market. This surge was driven by office workers in Sydney and Melbourne who favored features such as automatic transmissions, under-seat storage, and lower seat heights. While mopeds cater to a niche audience, they have found favor among delivery couriers seeking options that don't require a license. Honda's 2026 launch of the E-Clutch, enabling clutch-less shifting on conventional motorcycles, is set to broaden the appeal of the Australian two-wheeler market, drawing in a more comfort-oriented demographic.


By Technology: ICE Dominates, Electric Accelerates
In 2025, internal-combustion formats dominated sales, accounting for 92.15%. Commuter machines largely drove this in the 100-125 cc and 126-180 cc categories, which consume 3 L/100 km. Meanwhile, electric models are on the rise, boasting a 12.48% CAGR. This growth is fueled by ACT loans and Queensland rebates, which help reduce the cost gap between electric and internal-combustion models. While charging infrastructure is primarily urban, hindering regional adoption, the electric scooter segment in Australia's two-wheeler market is expanding, especially as courier fleets experiment with subscription bundles.
The 4-15 kW power range suits daily city commutes of 80-150 km. Zero Motorcycles, targeting enthusiasts ready to invest in high-performance models, operates above 15 kW, though its shipment volumes remain limited. The growth of internal combustion engines (ICE) will depend on compliance with the New Vehicle Efficiency Standard, pushing OEMs towards cleaner engines, even as battery prices continue to decline.
By Transmission: Manuals Hold, Automatics Rise
Manual transmissions still owned 65.33% of deliveries in 2025 because riders prize clutch control for performance and off-road precision. However, automatic and continuously variable units are growing at a 8.55% CAGR, driven by scooters and Honda’s semi-automatic E-Clutch, which eliminates left-hand fatigue in stop-start traffic[3]“CB500 & CB750 E-Clutch Press Kit 2026,” Honda Australia, honda.com.au. As electric powertrains inherently operate in single-speed, they normalize clutch-free riding and accelerate the adoption of automatic shifting in the Australian two-wheeler market for urban commuters.
Learner rules unintentionally shelter manuals because training courses emphasize clutch skills, yet provisional riders often migrate to automatics once licensed. Replacement CVT belts add cost, but perceived ease outweighs maintenance downsides for city buyers.
By Fuel Type: Petrol Dominance, Electric Upswing
In 2025, petrol-driven bikes held an 88.12% market share, supported by their extensive refueling network and lower upfront costs. Even with potential OECD-recommended tax hikes, their cost advantage over cars in terms of annual running expenses remains significant. The affordability and convenience of petrol bikes continue to drive their dominance, particularly in areas with underdeveloped alternative-fuel infrastructure.
Electric two-wheelers are projected to grow at an 11.36% CAGR through 2031, driven by advancements in battery technology and corporate efforts to reduce emissions. With battery costs nearing USD 100/kWh, electric two-wheelers are becoming more affordable for individual and fleet use. While safety concerns over lithium battery incidents may lead to stricter import regulations, most consumers’ daily range needs, typically under 50 km, align well with electric two-wheeler capabilities. This trend is steadily pushing the Australian two-wheeler market toward electrification.
By Distribution Channel: Stores Still Rule, Digital Scales
Offline dealers (Brick-and-mortar outlets) accounted for 93.04% of 2025 transactions because riders insist on test rides, trade-in valuations, and financing assistance. MotorCycle Holdings’ 55-location network illustrates the scale advantages it gained after buying Peter Stevens and Harley Heaven's assets in 2025 [4]“Half-Year Results 2026,” MotorCycle Holdings, motorcycleholdings.com.au. Simultaneously, online revenue is rising at 9.12% CAGR as shoppers research, reserve, and finance bikes digitally before collection, mirroring broader retail migration within the Australian two-wheeler market.
Pure-play web sales face registration and insurance hurdles that require physical touchpoints. Yet, direct-to-consumer electric brands like Fonzarelli save on overhead by combining virtual storefronts with pop-up test-ride hubs.
By End User: Personal Leads, Fleet Gaining Traction
Personal buyers accounted for 88.62% of 2025 volumes, driven by enthusiasts and commuters seeking adventure, styling, or fuel savings. Nevertheless, fleet and commercial customers are expanding at 7.24% CAGR as parcel couriers and food-delivery apps electrify to curb operating costs. Subscription bundles that bundle maintenance and battery replacement into a steady monthly fee enhance fleet cash flow, widening the Australian two-wheeler industry’s customer base.
In the Australian two-wheeler market, personal riders show a strong preference for high-displacement tourers from brands like Harley-Davidson, BMW, and Ducati, often making significant investments in these models, excluding gear. On the other hand, commercial operators lean towards low-maintenance 125-cc scooters, valuing their robust residuals, highlighting the contrasting priorities in specifications.
Geography Analysis
ACT and New South Wales combined delivered 33.45% of 2025 sales, buoyed by dense populations and consolidated dealer networks. Interest-free EV loans in Canberra offset price premiums, yet Sydney’s exclusion of bikes from state EV incentives restrains electric launches. Dealer consolidation continues as Motorcycle Holdings added Penrith, Tempe, and Sydney sites in 2025, cementing channel depth in the nation’s largest state.
Victoria and Tasmania contribute smaller shares but exhibit divergent dynamics. Melbourne’s residents sustain commuter demand, whereas strict learner rules and zero BAC limits dampen license uptake among under-25s. Tasmania’s tourism sector underpins motorcycle rentals, compensating for modest resident volumes.
Western Australia is set to record the highest regional CAGR of 7.68% through 2031, driven by well-paid mining workers, limited public transport, and a deep off-road culture. Dealer groups expanding into Perth and Kalgoorlie expect above-average unit margins on premium adventure models. Northern Territory and South Australia round out the landscape with vast unpaved terrains that favor Yamaha and KTM off-road bikes, while Queensland’s EV scooter rebate sustains Brisbane and Gold Coast deliveries.
Competitive Landscape
In 2025, Yamaha maintained its dominance across the adventure, motocross, and other segments. Honda followed in second place, differentiating itself with its E-Clutch technology, designed for learners hesitant about traditional manual bikes. Kawasaki sustained its momentum with the introduction of the Z500 and Vulcan S models, both compliant with LAMS regulations. At the same time, Chinese brands such as CFMoto, Kymco, and SYM expanded their presence in the value and electric niches through exclusive distribution agreements with Motorcycle Holdings, further diversifying the competitive landscape.
Dealer groups are consolidating to strengthen their purchasing power and enhance their digital reach. MotorCycle Holdings, which held a notable market share in the first half of 2026, exemplifies the advantages of nationwide parts logistics and a robust omnichannel marketing strategy. This consolidation trend is reshaping market dynamics, enabling larger dealer groups to better cater to consumer demand while optimizing operational efficiency. The growing focus on digital platforms and streamlined supply chains is becoming a critical factor in maintaining market competitiveness.
Premium OEMs are also broadening their portfolios to capture higher-spending hobbyists. Ducati entered the motocross segment in 2026, marking a significant expansion of its offerings. Indian Motorcycle, under new ownership, is focusing on enhancing dealer collaboration to strengthen its market position. These strategic moves reflect premium brands' ongoing efforts to adapt to evolving consumer preferences. Additionally, advancements in technology, shifting policies, and changing rider demographics are continuously redefining the competitive boundaries of the Australian two-wheeler market, creating opportunities and challenges for market participants.
Australia Two-Wheeler Industry Leaders
Yamaha Motor Co., Ltd.
Honda Motor Co., Ltd.
Kawasaki Heavy Industries, Ltd.
KTM AG
Suzuki Motor Corporation
- *Disclaimer: Major Players sorted in no particular order

Recent Industry Developments
- February 2026: Ducati added Brisan Motorcycles (Newcastle) and TeamMoto Blacktown to its Australian network to improve service coverage.
- November 2025: Honda unveiled its 2026 lineup, featuring the CB1000GT sports tourer and wider E-Clutch deployment across the CB500 and CB750 ranges.
- September 2025: Zero Motorcycles partnered with Australian Electric Motor Co. to manage sales and service after Peter Stevens’ restructuring.
- February 2025: New Zealand’s FTN Motion confirmed a March Australian debut for its Streetdog electric motorcycle, with over 40 of 50 units pre-ordered.


Australia Two-Wheeler Market Report Scope
The scope includes segmentation by vehicle type (scooters, mopeds, and motorcycles), technology (ICE by engine capacity, and electric by motor power), transmission (manual, and automatic/CVT), fuel type (petrol, electric, and CNG/LPG), distribution channel (offline dealers and online platforms), and end user (personal and commercial/fleet). The analysis also covers regional-level segmentation, including ACT and NSW, Victoria and Tasmania, Queensland, the Northern Territory, South Australia, and Western Australia. Market size and growth forecasts are presented by value (USD) and volume (units).
| Scooters |
| Mopeds |
| Motorcycles |
| Internal Combustion Engine (ICE) | By Engine Capacity | Below 100 cc |
| 100 - 125 cc | ||
| 126 - 180 cc | ||
| 181 - 250 cc | ||
| 251 - 500 cc | ||
| 501 - 800 cc | ||
| 801 - 1600 cc | ||
| Above 1600 cc | ||
| Electric | By Motor Power (kW) | Below 4 kW |
| 4 - 7 kW | ||
| 7 - 15 kW | ||
| Above 15 kW | ||
| Manual |
| Automatic / CVT |
| Petrol |
| Electric |
| CNG / LPG |
| Offline Dealers |
| Online Platforms |
| Personal |
| Commercial / Fleet |
| ACT and New South Wales |
| Victoria and Tasmania |
| Queensland |
| Northern Territory and South Australia |
| Western Australia |
| By Vehicle Type | Scooters | ||
| Mopeds | |||
| Motorcycles | |||
| By Technology | Internal Combustion Engine (ICE) | By Engine Capacity | Below 100 cc |
| 100 - 125 cc | |||
| 126 - 180 cc | |||
| 181 - 250 cc | |||
| 251 - 500 cc | |||
| 501 - 800 cc | |||
| 801 - 1600 cc | |||
| Above 1600 cc | |||
| Electric | By Motor Power (kW) | Below 4 kW | |
| 4 - 7 kW | |||
| 7 - 15 kW | |||
| Above 15 kW | |||
| By Transmission | Manual | ||
| Automatic / CVT | |||
| By Fuel Type | Petrol | ||
| Electric | |||
| CNG / LPG | |||
| By Distribution Channel | Offline Dealers | ||
| Online Platforms | |||
| By End User | Personal | ||
| Commercial / Fleet | |||
| By Region (States and Territories) | ACT and New South Wales | ||
| Victoria and Tasmania | |||
| Queensland | |||
| Northern Territory and South Australia | |||
| Western Australia | |||


Key Questions Answered in the Report
How large will the Australian two-wheeler market be by 2031?
It is projected to reach USD 1.17 billion, reflecting a 5.66% CAGR from 2026 to 2031.
Which segment grows fastest in technology?
Electric two-wheelers are advancing at 12.48% CAGR as state rebates and fleet mandates gain traction.
Why are motorcycles popular in Western Australia?
Mining incomes, vast off-road terrain, and limited public transport drive a 7.68% regional CAGR in Western Australia through 2031.
What is Honda’s E-Clutch, and why does it matter?
It automates clutch actuation, easing urban stop-go riding and boosting the automatic-transmission uptake forecast at 8.55% CAGR.
Page last updated on:


