Airborne Radars Market Size and Share
Market Overview
| Study Period | 2019 - 2030 |
|---|---|
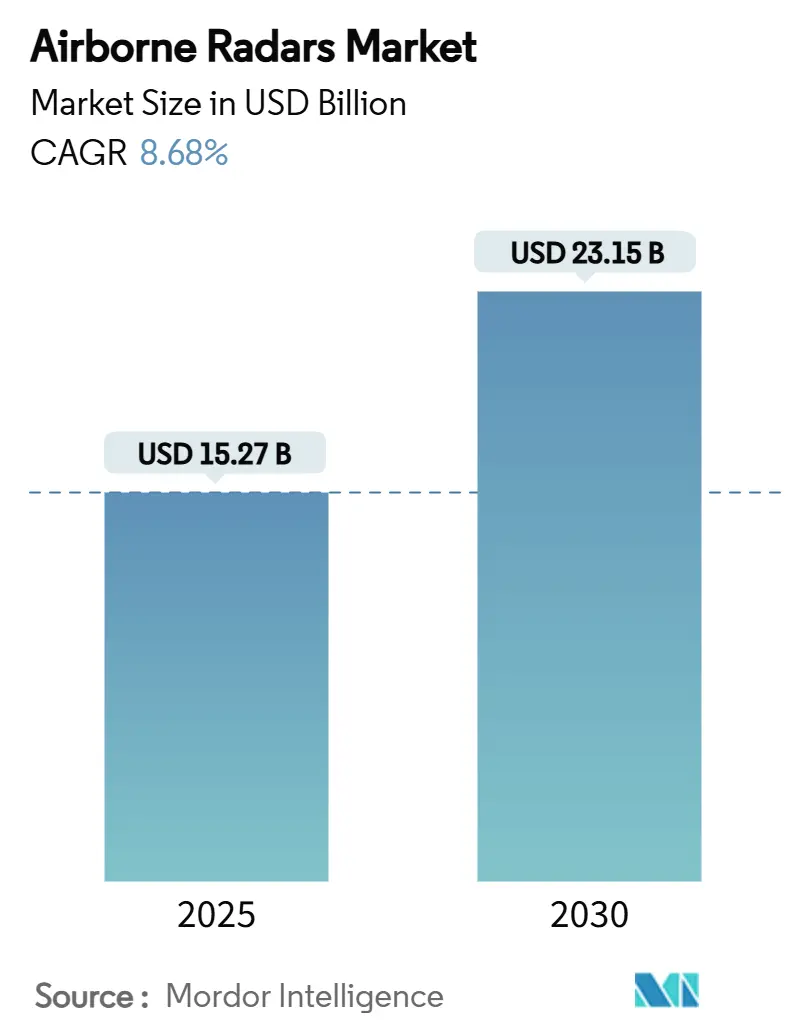
| Market Size (2025) | USD 15.27 Billion |
| Market Size (2030) | USD 23.15 Billion |
| Growth Rate (2025 - 2030) | 8.68% CAGR |
| Fastest Growing Market | Asia Pacific |
| Largest Market | North America |
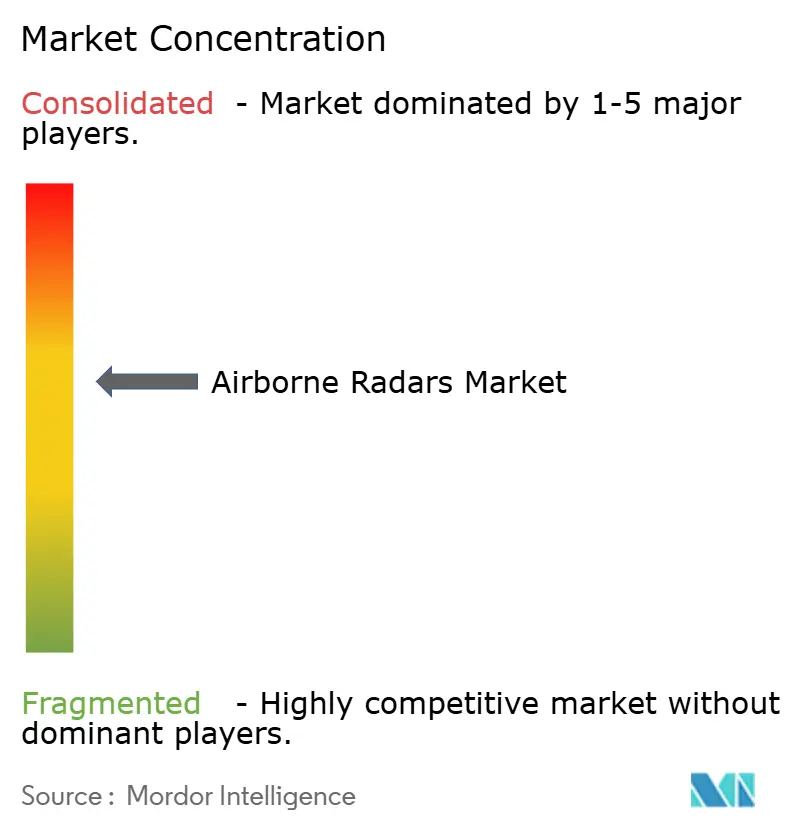
| Market Concentration | Medium |
Major Players *Disclaimer: Major Players sorted in no particular order Image © Mordor Intelligence. Reuse requires attribution under CC BY 4.0. | |
Airborne Radars Market Analysis by Mordor Intelligence
The airborne radars market size stands at USD 15.27 billion in 2025 and is forecasted to touch USD 23.15 billion by 2030, advancing at an 8.68% CAGR. This momentum is powered by defense modernization programs, strong commercial fleet expansion, and breakthroughs in Active Electronically Scanned Array (AESA) technology, which keep procurement pipelines active in military and civil aviation. Fixed-wing platforms, particularly airliners and large transports, remain primary revenue drivers, yet unmanned aerial vehicles (UAVs) accelerate demand for lighter, software-defined sensors. On the supply side, Northrop Grumman, Raytheon, and Lockheed Martin raise R&D outlays for Gallium Nitride (GaN) components to boost range while cutting maintenance workload. Spectrum congestion and high integration costs temper short-term adoption in emerging markets. Asia-Pacific’s re-armament cycle, headlined by Japanese and South Korean procurements, underpins the long-term growth runway for the airborne radars market.
Key Report Takeaways
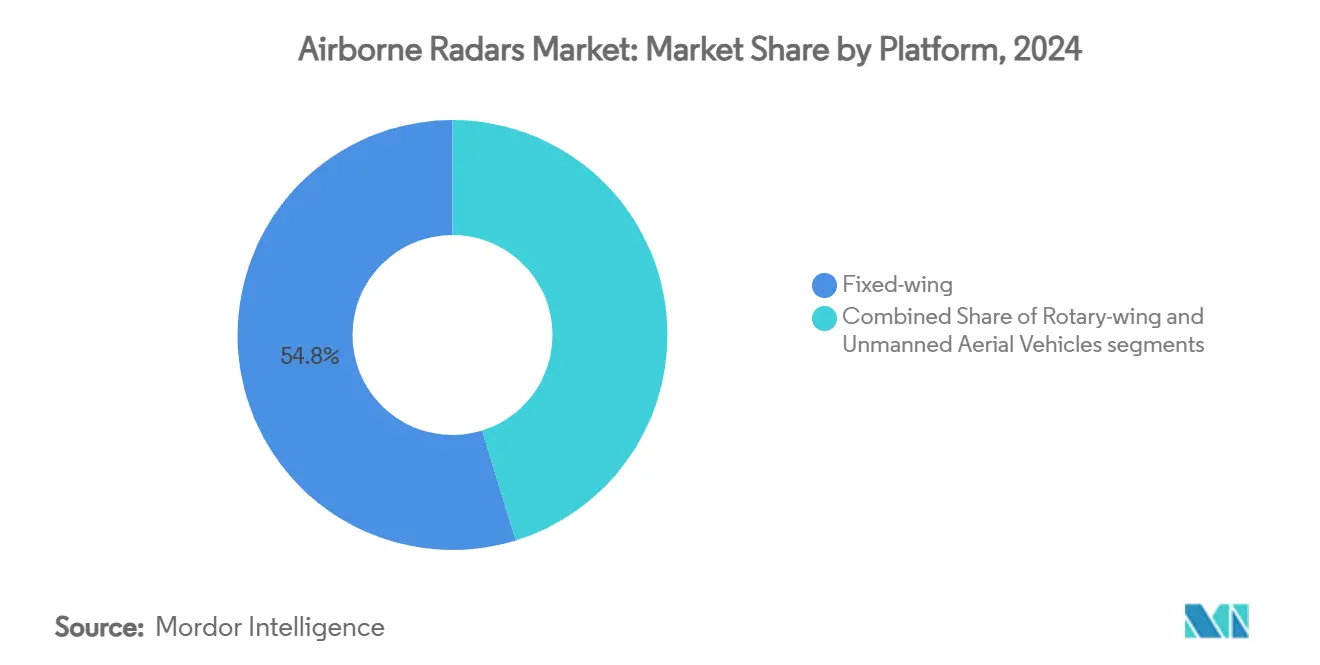
- By platform, fixed-wing aircraft led with 54.78% revenue share in 2024; UAVs are projected to expand at an 11.22% CAGR through 2030.
- By frequency band, S-band systems held 39.45% of the airborne radars market share in 2024, while multi-band solutions show the fastest 10.29% CAGR to 2030.
- By technology, AESA captured 48.21% of the airborne radars market size in 2024; Passive Electronically Scanned Array (PESA) technology records a 9.56% CAGR over the forecast period.
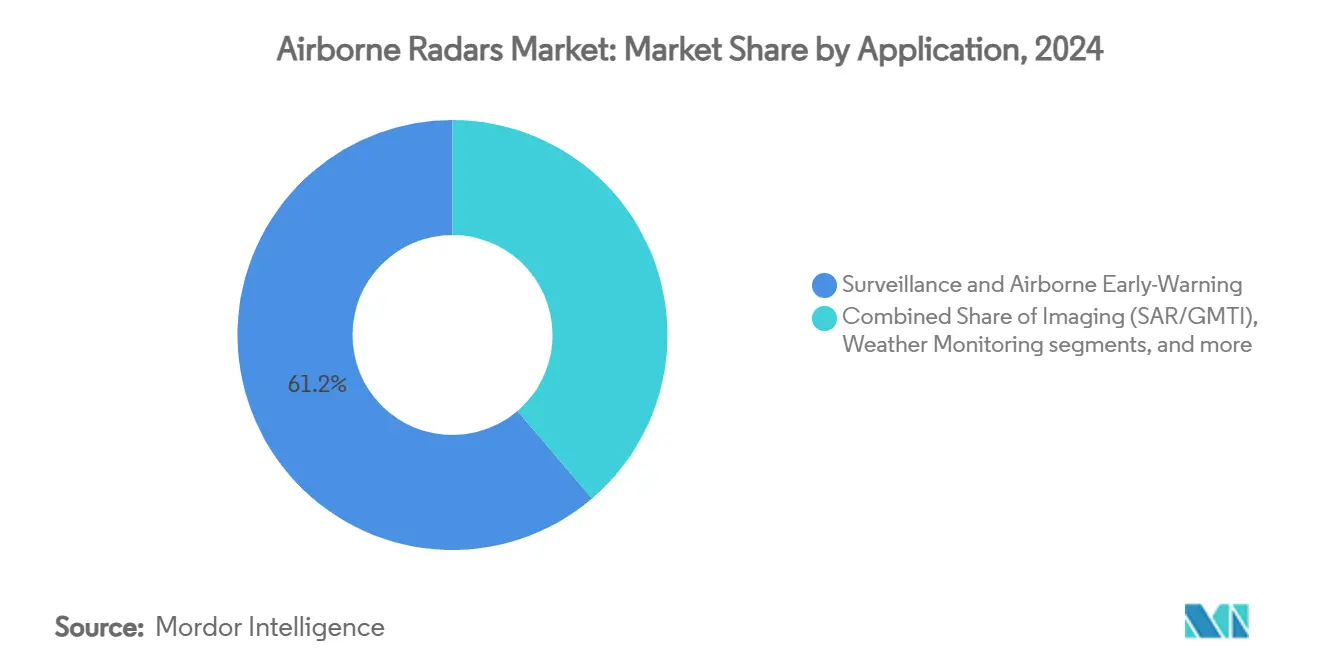
- By application, surveillance and airborne early warning accounted for 61.24% of 2024 revenue; imaging modalities grew at a 10.98% CAGR to 2030.
- By end user, commercial aviation maintained a 54.23% share in 2024, and the military program advanced at an 11.75% CAGR through 2030.
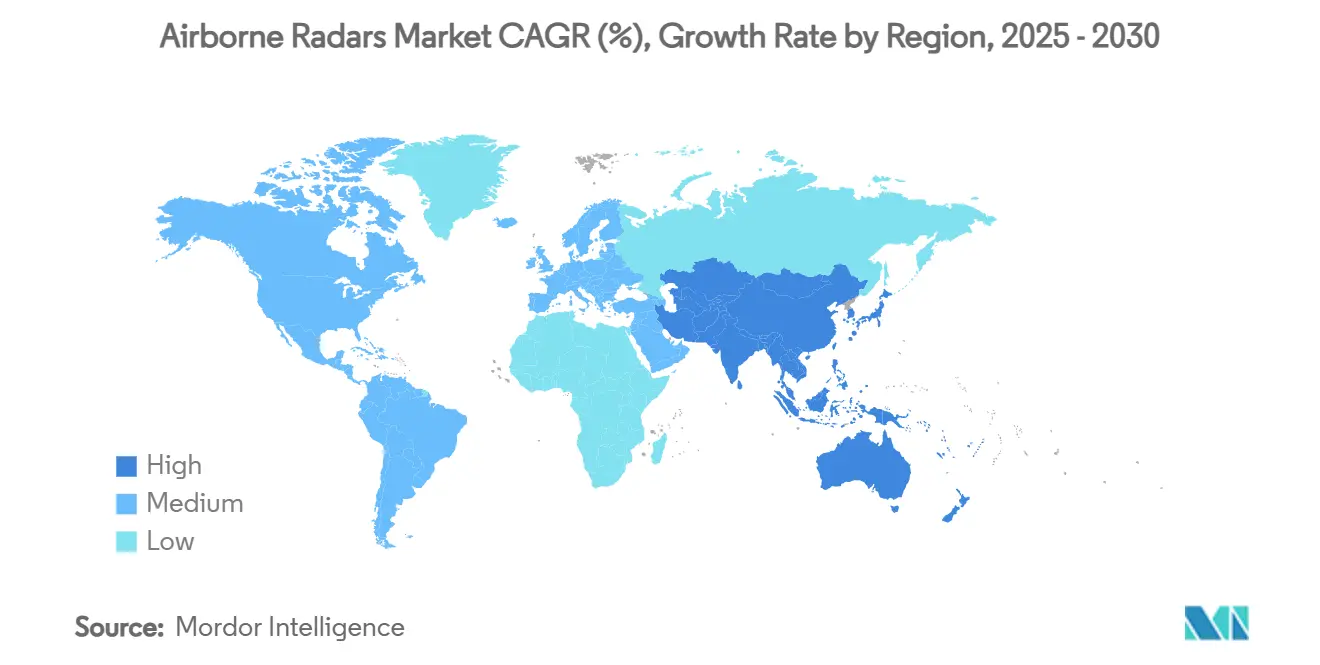
- By geography, North America commanded a 39.33% share in 2024, whereas Asia-Pacific clocked the highest 8.23% CAGR to 2030.
Global Airborne Radars Market Trends and Insights
Drivers Impact Analysis*
| Driver | (~) % Impact on CAGR Forecast | Geographic Relevance | Impact Timeline |
|---|---|---|---|
| Rising procurement of next-generation fighter and surveillance aircraft fleets | +1.8% | North America, Europe, Asia-Pacific | Medium term (2-4 years) |
| Increasing adoption of AESA radars for enhanced situational awareness | +1.5% | Developed markets worldwide | Short term (≤ 2 years) |
| Growth in commercial air-traffic driving demand for weather and collision-avoidance radars | +1.2% | Asia-Pacific, North America | Long term (≥ 4 years) |
| Military retrofit and modernization of legacy airborne platforms | +1.0% | North America, Europe, select Asia-Pacific | Medium term (2-4 years) |
| Modular software-defined open architectures enabling cross-platform portability | +0.8% | Advanced militaries worldwide | Long term (≥ 4 years) |
| Integration of AI-enabled sensor-fusion suites creating new upgrade cycles | +0.7% | North America, Europe, tech-driven Asia-Pacific | Long term (≥ 4 years) |
| Source: Mordor Intelligence | |||
Rising Procurement of Next-Generation Fighter and Surveillance Aircraft Fleets
Defense ministries accelerate fifth-generation fighter and AEW platform acquisitions, prompting heightened demand for advanced airborne radar suites. The US Air Force earmarks USD 90 million in FY 2026 to upgrade F-22 Raptors with dynamic Synthetic Aperture Radar capabilities that counter Chinese and Russian threats. Italy and Spain reinforce European air power by selecting Eurofighter Typhoons equipped with Captor-E AESA sensors, ensuring interoperability across NATO fleets. Sweden’s order for the Lockheed Martin TPY-4 radar illustrates how Nordic states prioritize long-range detection to bolster Baltic security.[1]Lockheed Martin, “Sweden Selects the Lockheed Martin TPY-4 Radar to Enhance Regional Deterrence and Defense Capabilities,” news.lockheedmartin.com Governments increasingly embed domestic production clauses in contracts to safeguard supply chains, reshaping vendor partnerships. These modernization drives amplify the airborne radars market as legacy platforms undergo radar retrofits to match new-build performance.
Increasing Adoption of AESA Radars for Enhanced Situational Awareness
AESA technology has transitioned from a premium option to a baseline requirement across modern combat aircraft. Northrop Grumman’s AN/APG-85 for the F-35 elevates detection range and electronic-attack resilience without compromising the jet’s low observable profile.[2]SAE Media Group, “Next-Generation Radar for the F-35 Lightning II,” techbriefs.com GaN amplifiers increase power density, allowing lighter arrays with broader bandwidth. Turkey’s ASELSAN completed its first F-16 flight test with an indigenous AESA set, signaling a shift in supplier dynamics and underlining how new entrants capitalize on domestic demand. Modular line-replaceable units shorten upgrade cycles, letting air forces insert incremental software releases that maintain overmatch in rapidly evolving threat environments.
Growth in Commercial Air-Traffic Driving Demand for Weather and Collision-Avoidance Radars
Airline capacity recovery and new routes intensify the need for next-generation weather and predictive windshear radars. The FAA upgrades surface-movement surveillance under its Non-Cooperative Surveillance Radar program to support heavier traffic flows and mitigate runway incursions. Honeywell’s RDR-7000 adoption by Brazil’s OMNI Air Taxi cuts helipad approach minima and reduces unexpected diversions, raising operational efficiency.[3]Honeywell Aerospace, “Honeywell Weather Radar System Selected By OMNI Air Taxi For Major Fleet Upgrade,” aerospace.honeywell.com Passive radar initiatives such as HENSOLDT’s Twinvis aim for certification by 2026, offering civil operators lower ownership costs and tolerance to spectrum congestion. As global passenger volumes climb, these initiatives reinforce commercial aviation’s stake in the airborne radars market. Rising low-cost-carrier fleets in Asia-Pacific further enlarge the installed base, reinforcing commercial aviation’s position as the largest end-user segment.
Military Retrofit and Modernization of Legacy Airborne Platforms
Budget pressure steers many services toward radar upgrade programs that extend platform life. The US Air Force ordered additional APG-83 systems for F-16s under a USD 1.6 billion umbrella contract, aligning older jets with modern threat libraries. General Atomics enhances Gray Eagle drones with EagleEye AESA to double surveillance radius and support Multi-Domain Operations. The UK integrates the ECRS Mk 2 radar into Typhoon aircraft under a GBP 2.35 billion (USD 3.15 billion) technology package, proving retrofit projects can generate multi-billion-dollar demand. Modular, backward-compatible designs position suppliers to secure follow-on business as air forces prioritize incremental capability over fleet replacement. Retrofit kits usually feature common power, cooling, and data interfaces that reduce installation downtime and allow simultaneous upgrades to mission computers, extending platform relevance well into the 2030s.
Restraints Impact Analysis*
| Restraint | (~) % Impact on CAGR Forecast | Geographic Relevance | Impact Timeline |
|---|---|---|---|
| High development and integration costs of advanced radar systems | -1.2% | Global, especially emerging markets | Medium term (2-4 years) |
| Spectrum congestion and regulatory hurdles in key frequency bands | -0.8% | Densely populated regions worldwide | Long term (≥ 4 years) |
| Supply-chain constraints for GaN semiconductor components | -1.0% | Western manufacturers | Short term (≤ 2 years) |
| ML-enabled electronic-warfare deception increasing radar vulnerability | -0.6% | Contested environments globally | Long term (≥ 4 years) |
| Source: Mordor Intelligence | |||
High Development and Integration Costs of Advanced Radar Systems
Next-generation arrays often exceed USD 125 million per unit, as illustrated by the US Army’s Lower Tier Air & Missile Defense Sensor, prohibiting acquisition for many emerging economies.[4]Defense Express, “Patriot’s New Radar Costs USD 130 Million Apiece, First Units Soon to Arrive in US Forces,” defence-ua.com Extensive flight testing, environmental qualification, and cybersecurity accreditation stretch delivery schedules and tie up capital for years. Regulatory investigations into large defense mergers, such as the Federal Trade Commission’s action against Lockheed Martin’s proposed Aerojet Rocketdyne purchase, restrict opportunities to share R&D expenses across broader corporate portfolios. Smaller vendors struggle to secure financing for long lead-time programs, which narrows competition and can inflate prices further. Budget uncertainties, therefore, delay or scale down orders, slowing the overall market growth rate.
Spectrum Congestion and Regulatory Hurdles in Key Frequency Bands
Mobile-telecom rollouts and satellite broadband constellations are encroaching on traditional radar allocations, prompting regulators to impose stricter emissions masks that require costly redesigns. Airlines in the US faced temporary 5G-related altitude restrictions that highlighted the vulnerability of existing radar altimeters to adjacent-band interference. National spectrum agencies in Europe and Asia-Pacific now demand extensive compatibility testing before granting operating licenses, extending program timelines by months. Some defense buyers shift toward passive or frequency-agile radars, but certification paths for these newer technologies remain uncharted. The additional compliance burden discourages smaller civil operators from early adoption and reduces near-term demand.
*Our forecasts treat driver/restraint impacts as directional, not additive. The impact forecasts reflect baseline growth, mix effects, and variable interactions.
Segment Analysis
By Platform: UAVs Drive Transformation
UAVs register the fastest 11.22% CAGR, propelled by defense initiatives that value attritable surveillance and strike options. In 2024, fixed-wing aircraft held 54.78% of the airborne radars market share due to their large installed base in commercial fleets. The airborne radars market size for UAV sensors is forecasted to almost double by 2030 as militaries fund counter-UAS and autonomous ISR programs. EagleEye AESA integration on the Gray Eagle 25 M doubles detection range while retaining the airframe’s payload envelope, illustrating technology trickle-down from manned fighters.[5]General Atomics Aeronautical Systems, “GA-ASI Adding AESA Antenna to EagleEye Radar,” ga-asi.com Rotary-wing platforms remain vital for SAR, offshore oil, and medical evacuation, yet rotor-disk blockage challenges drive requirements for compact, electronically steered arrays. AI-assisted beam management adapts to blade masking, improving low-altitude maritime surveillance. Interoperability across manned-unmanned teams encourages common radar data standards, supporting joint operations and spurring cross-platform orders in the airborne radars market.
Cross-domain operations also spur demand for swarming drones that serve as forward radar pickets, extending the sensor perimeter for strike packages. The US Department of Defense allocated USD 10.1 billion toward counter-UAS programs, indirectly boosting radar purchases for blue-force drones and detection networks. Civil authorities adopt small UAVs with lightweight weather radars to inspect turbulence corridors along busy approach paths, broadening non-military revenue streams. As endurance improves through hydrogen fuel-cell experiments, sensors migrate toward higher power aperture, sealing UAVs as enduring growth engines for the airborne radars market.


By Frequency Band: Multi-Band Solutions Gain Momentum
S-Band radars provided 39.45% revenue in 2024, favored for balanced range and weather resilience. Multi-band solutions, however, are set to grow 10.29% annually as operators seek versatility in congested electromagnetic environments. Software-defined back-ends let crews switch between X-Band for fine imaging and L-Band for foliage penetration without hardware changeovers. Thales’ digital Ground Fire illustrates this shift, integrating AI scheduling that merges fire-control and long-range surveillance in one array. Estonia’s procurement of passive sensors complements active S-Band assets, creating layered coverage that resists jamming.
Ku/Ka-Band finds niche utility in high-resolution mapping and missile seeker support, yet atmospheric attenuation limits broad adoption. Frequency-agile architecture mitigates this constraint by dynamically lowering waveform bandwidth under heavy rain. Civil priorities differ: carriers value C-Band suppression to avoid 5G interference near major airports. Eventual coexistence hinges on International Telecommunication Union spectrum reforms, another factor guiding investment in multi-band, re-tunable radar sets within the airborne radars market.
By Technology: AESA Dominance Accelerates
AESA accounted for 48.21% of 2024 revenues and widened its lead as GaN prices decline. Passive ESA systems post a 9.56% CAGR by offering many AESA benefits at a price point palatable to budget-constrained customers. AESA’s tile-based construction eases field repair and modular upgrades, aligning with defense ministries’ push for open-system approaches. Northrop Grumman’s AN/APG-85 extends dynamic range while maintaining F-35 low-observability, amplifying performance benchmarks. Turkey’s ASELSAN ride showcases how domestic champions leverage government demand to gain export traction.
Mechanically scanned arrays fade except in cost-sensitive secondary roles such as civil air-traffic control back-ups. However, refurbished mechanical sets occasionally reappear in humanitarian aviation where full AESA capability proves excessive. Supplier differentiation shifts toward software ecospheres: companies bundle AI waveforms, cyber-hardening, and predictive maintenance analytics, adding stickiness that drives recurring revenue for the airborne radars market.
By Application: Imaging Systems Surge
Surveillance and AEW remain dominant, holding 61.24% of 2024 revenue. Imaging modes, chiefly SAR and GMTI, expand at a 10.98% CAGR as strategic competition demands precise geolocation in A2/AD zones. Israel Aerospace Industries delivered a multi-mode sensor that merges wide-area search with high-resolution strip mapping in one package, optimizing payload budgets. Weather radars secure airline interest through predictive windshear and turbulence avoidance. Navigation and collision-avoidance systems receive renewed funding as regulators confront the integration of unmanned traffic in controlled airspace. The airborne radars market size for imaging is further supported by disaster-response applications that rely on through-cloud earth observation during hurricanes.
AI classifiers shorten tasking-to-intelligence timelines, converting raw phase history into actionable maps within minutes. This improvement attracts subscription-based services where operators buy processed imagery rather than owning hardware, creating parallel revenue models for radar OEMs. Multi-mission sensors that toggle between maritime surveillance and ground imaging under software control maximize sortie utility and underpin strong upgrade demand.
By End User: Military Growth Accelerates
Commercial airlines controlled 54.23% of 2024 revenue, yet military buyers boost overall value through premium, multi-function sensor orders. Military demand climbs 11.75% annually as air forces integrate networked AEW, target-tracking, and electronic-warfare modes in one array. The US Air Force’s 3DELRR program funnels USD 472 million into 19 TPY-4 radars, exemplifying big-ticket orders that propel the airborne radars market size. General aviation grows from the expanding business jet fleet, adopting lighter AESA altimeters to satisfy ICAO performance-based navigation mandates.
Defense ministries champion interoperable architectures that share track files across coalition partners, encouraging common technical baselines and locking in recurring software support deals. Commercial operators focus on lifecycle economy, valuing predictive maintenance and low-drag radome designs that curb fuel burn. Diverging priorities generate segmented product lines, yet shared GaN supply concerns harmonize lobbying efforts across civil and military stakeholders.
Geography Analysis
North America stays at the top with 39.33% 2024 revenue, underpinned by Pentagon funding, FAA modernization, and expansive airline fleets. Multi-year procurement contracts such as SPY-6 and dual-use weather surveillance projects secure predictable demand for domestic GaN foundries, forging tight vendor-government collaboration. Canada’s USD 4 billion Arctic over-the-horizon radar deal with Australia underscores continental focus on northern sovereignty and beyond-line-of-sight coverage.
Asia-Pacific posts the strongest 8.23% CAGR as China’s assertiveness stimulates counter-air investments by neighbors. Japan’s sale of FPS-3ME radars to the Philippines, valued at PHP 5.5 billion (USD 96.8 million), showcases regional technology transfer that builds local sustainment capacity. South Korea tasks Hanwha Systems with multifunction L-SAM II radar development, advancing indigenous capability, and reducing import reliance. Commercially, carriers such as IndiGo and China Southern invest in advanced weather radars to mitigate monsoon-induced delays, further enlarging the airborne radars market.
Europe maintains healthy orders through NATO standardization, although budget dispersion across 30 member states introduces cyclical variability. Sweden’s TPY-4 selection and Estonia’s EUR 1 billion (USD 1.16 billion) communications and radar spend illustrate a commitment to integrated air-defense networks. Passive radar trials attract EU funding for urban air mobility surveillance, highlighting innovation despite fiscal constraints. Middle East and Africa trend upward on counter-drone urgency; however, petro-state dependence and political risk temper long-term forecasts. Latin America remains a niche but sees sporadic orders for weather and maritime patrol radars tied to disaster-relief missions.

Competitive Landscape
The airborne radars market features a moderate concentration as legacy integrators consolidate share while nimble startups erode select niches. Northrop Grumman Corporation, RTX Corporation, and Lockheed Martin Corporation benefit from scale economies, classified algorithm libraries, and vertically integrated GaN fabs. Raytheon’s USD 647 million SPY-6 lot award signals Navy confidence in scalable, common-module radar families. Lockheed’s delivery of the first TPY-4 radar illustrates rapid prototype-to-production transitions that sustain customer trust.
Emerging competitors such as Anduril leverage venture funding and agile software stacks to field counter-UAS radars that pair with autonomous command-and-control suites. Mercury Systems and CEA Technologies carve sub-system niches by supplying miniaturized RF modules and multi-mission phased-array panels. Market rivalry shifts from pure hardware comparison toward total solution value encompassing AI, open-architecture compliance, and sovereign supply commitments. Supplier success increasingly hinges on supply-chain resilience; firms with domestic GaN production and digital twin support gain selection preference among risk-averse ministries.
OEMs pursue strategic alliances and technology-sharing programs to circumvent export restrictions and accelerate market entry. Thales’ Indonesian partnership for Ground Master 403 radars transfers manufacturing know-how, fostering local industry while securing regional support contracts. High entry barriers persist due to stringent performance validation, yet civil-military dual-use applications create windows for commercial electronics players. Software-centric differentiation, AI-enabled adaptability, and compliance with open-system mandates dictate competitive positioning through 2030 within the airborne radars market.
Airborne Radars Industry Leaders
Northrop Grumman Corporation
RTX Corporation
Lockheed Martin Corporation
Thales Group
Saab AB
- *Disclaimer: Major Players sorted in no particular order

Recent Industry Developments
- May 2025: Raytheon, an RTX business, completed the first flight test of its Phantom Strike radar on its Multi-Program Testbed aircraft in Ontario, California. The radar system tracked multiple airborne targets and mapped terrain accurately.
- May 2025: Thales has introduced TRAC SIGMA, a new multi-mission Primary Surveillance Radar system that integrates approach and long-range air surveillance capabilities for civil and military air traffic control operations.
- September 2024: The European Common Radar System Mark 2 (ECRS Mk2), a new radar system designed to help Royal Air Force (RAF) pilots detect, identify, and neutralize enemy air defenses, completed its first flight test. The prototype radar was tested on a UK Typhoon evaluation aircraft at BAE Systems' facility in Lancashire, with support from its manufacturer, Leonardo UK.
- June 2024: OMNI Air Taxi (OMNI), the largest operator of Leonardo AW139 helicopters in South America, will upgrade its fleet of 31 AW139s with Honeywell's IntuVue RDR-7000 Weather Radar System. The RDR-7000 is an automated flight system that enables pilots to evaluate weather conditions and determine safer flight paths.


Global Airborne Radars Market Report Scope
| Fixed Wing |
| Rotary Wing |
| Unmanned Aerial Vehicles (UAVs) |
| X-Band |
| L-Band |
| S-Band |
| Ku/Ka-Band |
| Multi-Band and Others |
| Active Electronically Scanned Array (AESA) |
| Passive Electronically Scanned Array (PESA) |
| Mechanically Scanned Array (MSA) |
| Surveillance and Airborne Early-Warning |
| Imaging (SAR/GMTI) |
| Weather Monitoring |
| Navigation and Collision-Avoidance |
| Military | Combat Aircraft |
| Non-Combat Aircraft | |
| Helicopters | |
| Commercial | Narrowbody Aircraft |
| Widebody Aircraft | |
| Regional Jets | |
| Helicopters | |
| General Aviation | Business Jets |
| Turboprops and Piston Aircraft |
| North America | United States | |
| Canada | ||
| Mexico | ||
| Europe | United Kingdom | |
| Germany | ||
| France | ||
| Russia | ||
| Rest of Europe | ||
| Asia-Pacific | China | |
| India | ||
| Japan | ||
| South Korea | ||
| Rest of Asia-Pacific | ||
| South America | Brazil | |
| Rest of South America | ||
| Middle East and Africa | Middle East | United Arab Emirates |
| Saudi Arabia | ||
| Rest of Middle East | ||
| Africa | Egypt | |
| Rest of Africa | ||
| By Platform | Fixed Wing | ||
| Rotary Wing | |||
| Unmanned Aerial Vehicles (UAVs) | |||
| By Frequency Band | X-Band | ||
| L-Band | |||
| S-Band | |||
| Ku/Ka-Band | |||
| Multi-Band and Others | |||
| By Technology | Active Electronically Scanned Array (AESA) | ||
| Passive Electronically Scanned Array (PESA) | |||
| Mechanically Scanned Array (MSA) | |||
| By Application | Surveillance and Airborne Early-Warning | ||
| Imaging (SAR/GMTI) | |||
| Weather Monitoring | |||
| Navigation and Collision-Avoidance | |||
| By End User | Military | Combat Aircraft | |
| Non-Combat Aircraft | |||
| Helicopters | |||
| Commercial | Narrowbody Aircraft | ||
| Widebody Aircraft | |||
| Regional Jets | |||
| Helicopters | |||
| General Aviation | Business Jets | ||
| Turboprops and Piston Aircraft | |||
| By Geography | North America | United States | |
| Canada | |||
| Mexico | |||
| Europe | United Kingdom | ||
| Germany | |||
| France | |||
| Russia | |||
| Rest of Europe | |||
| Asia-Pacific | China | ||
| India | |||
| Japan | |||
| South Korea | |||
| Rest of Asia-Pacific | |||
| South America | Brazil | ||
| Rest of South America | |||
| Middle East and Africa | Middle East | United Arab Emirates | |
| Saudi Arabia | |||
| Rest of Middle East | |||
| Africa | Egypt | ||
| Rest of Africa | |||


Key Questions Answered in the Report
What is the current size of the airborne radars market?
The airborne radars market size is USD 15.27 billion in 2025, and it is forecasted to reach USD 23.15 billion by 2030, advancing at an 8.68% CAGR.
Which platform segment is growing the fastest?
UAV-mounted radars lead growth at an 11.22% CAGR because defense agencies invest heavily in autonomous ISR and counter-drone missions.
Why are AESA radars preferred over mechanically scanned arrays?
AESA offers superior range, multi-target tracking, lower maintenance, and better electronic-attack resilience, driving its 48.21% market share in 2024.
Which region will experience the highest growth?
Asia-Pacific is projected to log an 8.23% CAGR through 2030 thanks to aggressive military modernization and booming commercial aviation.
How do supply-chain constraints affect radar production?
Export controls on gallium and limited GaN foundry capacity extend lead times and raise costs, shaving 1.0% off the forecast CAGR.
What technologies will shape future airborne radars?
Software-defined architectures, AI sensor fusion, and GaN-based AESA tiles will dominate future upgrades, enabling rapid capability insertion and cross-platform portability.
Page last updated on:


